Study Population
Data were retrieved from Clalit Health Services (CHS), the largest health care provider in Israel, with 4·7 million members (53% of the population) from all sociodemographic groups of which the pediatric population accounts for 1·5 million members. The study was limited to CHS members aged 1–16 years who had been insured for at least 1 year prior to the beginning of the study on April 1, 2020. Individuals who had a confirmed diagnosis of diabetes, cancer, or developmental diseases (see Table S1 for list of diseases and codes) were excluded. The COVID-19 diagnosed group was composed of all CHS members who met the inclusion criteria and had a confirmed diagnosis of a SARS-CoV-2 infection using a polymerase chain reaction test from April 1, 2020, to March 31, 2021. The index date for each person in this group was the date of the first diagnosis of SARS-CoV-2 infection.
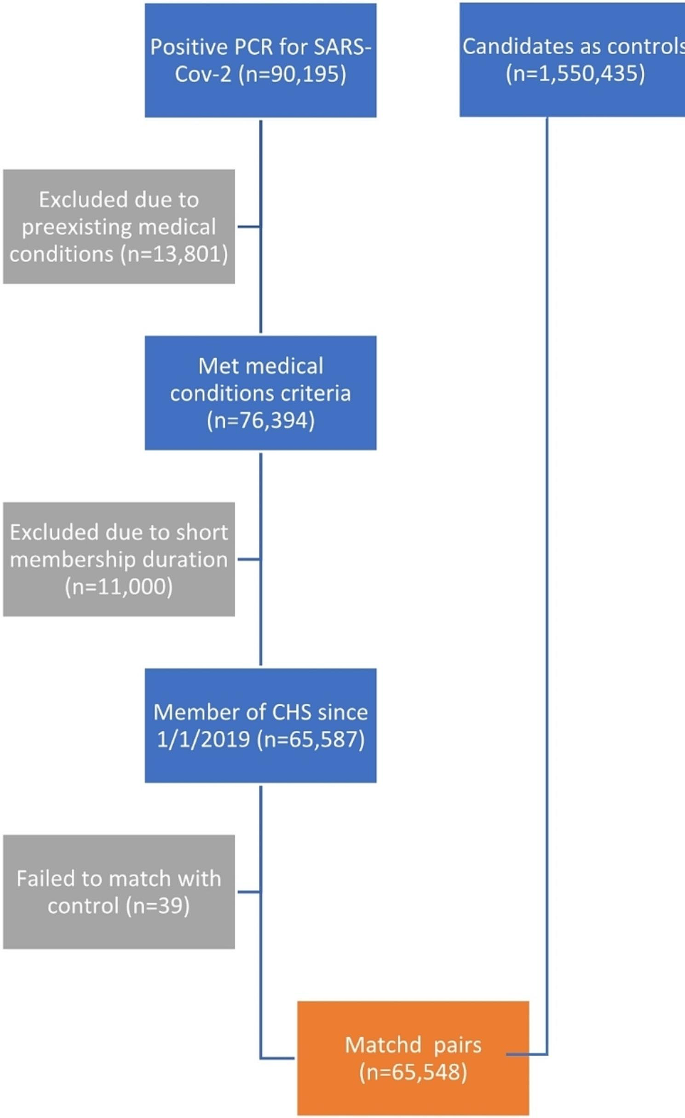
During this time frame, 90,195 participants under the age of 16 were diagnosed with SARS-CoV-2. Of these, 24,512 (27%) did not meet the inclusion criteria either due to pre-existing medical conditions (13,801, 15%) or because they had not been insured by CHS since April 1, 2019. Of these excluded participants the vast majority were diagnosed with lack of expected normal physiological development (ICD-10 R62 code) (11,633 cases, 13%). The prevalence of this diagnosis in the first year of life among CHS members is 14·8% which is similar, but not identical, to the rate observed in the participants of this study. This left 65,683 participants to match to the controls. The study excluded individuals over the age of 16 to avoid potential biases from medical evaluations related to Israeli army conscription. Figure 1 presents the selection process.
Each participant in the COVID-19 diagnosed group was matched without replacement with a single control CHS member who was not diagnosed with SARS-CoV-2 on or before the index date. Matching included month and year of birth, sex assigned at birth, socio-economic status (on a 3-point scale), societal sector (determined according to the registered address and divided into Jewish, Jewish Ultra-Orthodox, Arab, Bedouin, and ‘other’). Participants in the COVID-19 diagnosed group for which no match was found were excluded (135 cases, 0·2% of the cases). Each participant from the control group was assigned the same index date as the participant in the COVID-19 diagnosed group they were matched to. This left 65,548 participants in the COVID-19 diagnosed group and the same number of controls. The age distribution of the participants is presented in Figure S1 and the distribution of index date is presented in Figure S2.
Study variables
Seven primary outcomes were defined within the 3–6 month period after the index date: (1) visits to primary physician, (2) visits to a specialty physician, (3) visits to the Emergency Room, (4) admission to a hospital, (5) prescriptions for any medication, (6) new diagnosis entered into the health record, and (7) referral for mental health services. Laboratory tests were initially considered as another possible outcome but were excluded since it was found that a large proportion of these tests were SARS-CoV-2 PCR tests and Israeli policy at the time only required these tests for people who had not previously tested positive for COVID-19.
The outcomes were recorded for the following periods: 6–12 months before the index date, 3–6 months before the index date, 2–3 months before and after the index date, 1–2 months before and after the index date, 2 weeks-1 month before and after the index date, 2 weeks before and 2 weeks after the index date (see Fig. 2 for a schematic timeline). The outcomes were converted to binary values indicating whether the service was used or not during the given period when used as dependent variables, which made it possible to quantify the relative risks of the outcomes in the infection vs. the control group. In addition to the matching variables and the outcomes, the data also included the total number of diagnoses registered in the Clalit Electronic Health Record (EHR) up to a year before the index date (Tables 1 and 2).
Study design
The study was a retrospective cohort study. The outcome variables for the infected and control groups differed 3–6 months before the index date, even when adjusting for available covariates. Therefore, the remaining analyses targeted the interaction between the infection and the period (before/after the index date) in the Generalized Estimating Equation (GEE) models with sandwich standard error estimators [26] applied to the data of each participant in the two periods. Correlations were assumed to be present between the measurements before/after the index date, as well as between each participant in the COVID-19 diagnosed group and the matched participant in the control group. The model was adjusted for outcomes 6–12 months before the index date, the calendar date of the index date dummy encoded at a resolution of 6 weeks beginning April 1, 2020, socio-economic status, sex assigned at birth, district, societal sector, and count of diagnoses registered in the EHR up to a year before the index date.
As negative controls, we applied the same model while using the period of 2–3 months before the index date and 1–2 months before the index date as the dependent variable. If the groups are comparable (there is no unmeasured confounding), an approximate null result was expected for the infection x period interaction term.
The G-formula was used to compute the marginal relative risks (RR) [26], while 95% confidence intervals and p-values were obtained using the bootstrap method with 999 bootstrap repetitions, and bootstrap sampling at the matched-pairs level. Holm’s method was used to adjust for multiple hypothesis testing for the primary outcomes of the study. GEE logistic regression models (Python statsmodels version 0·13·2) were used to adjust for confounders and account for inter-personal correlations [27]. To assess the sensitivity of the results to modeling assumptions, the results were compared to ones obtained by modified Generalized Additive Models (GAMs) and XGboost [28, 29].


Add Comment