
Human iPSC acquisition and culture
Human induced pluripotent stem cells (iPSCs) [WTC-11 provided by Bruce R. Conklin, the Gladstone Institutes and UCSF Institute, San Francisco, CA, USA] were used to generate neuronal determinant neurogenin-2 (Ngn2) neurons, astrocytes and spinal cord motor neurons (sMNs) (Fig. S1). iPSCs were maintained in iPSC medium (Table 1.) at 37 °C and 5% CO2. Accutase (Life Technologies) was used for dissociation during passaging and cells were seeded on Matrigel (Corning, 10 μl/ml) coated 6-well plates. For coating, Matrigel was diluted in Knock-Out Dulbecco’s Modified Eagle Medium (KO DMEM; ThermoFisher Scientific) and plates were incubated for a minimum of 1 h at 37 °C.
Differentiation of human iPSCs to Ngn2 neural co-cultures
Stably transduced WTC-11 Ngn2 iPSCs were directly differentiated into excitatory cortical layer 2/3 neurons by overexpression of neurogenin-2 (Ngn2) [23,24,25] using an adapted protocol for inducible overexpression in the presence of doxycycline, as previously described [23]. In short, on day 0, coverslips were coated with poly-L-ornithine (Sigma, 100 μg/ml) for 1 h at room temperature in the dark. Coverslips were then washed 3 times with sterile deionised water and air-dried for 30 min. A droplet of Matrigel was placed in the middle of the coverslip and incubated for 1 h at 37 °C then removed. A 50 μl droplet of Ngn2-iPSC cell suspension was then placed on a coated coverslip and incubated for 30 min at 37 °C 5% CO2 to promote cell attachment. After attachment, wells were filled with iPSC medium supplemented with doxycycline (4 μg/ml) (Table 1.). The next day (day 1), medium was refreshed with differentiation medium (Table 1.). To promote synaptic maturation, iPSC-derived astrocytes were added to the culture in a 1:1 ratio [26]. Neural progenitor cells derived from the WTC-11 human iPSC line were differentiated into astrocytes in 4 weeks using a combination of LIF and BMP4 as previously described [25]. The neuron-astrocyte co-culture medium was refreshed the day after with Ngn2 medium (Table 1.). During the differentiation and maturation, half of the medium was refreshed every other day. After 21 days the neural co-cultures were considered mature and used in experiments.
Differentiation of human iPSCs to spinal cord motor neurons
iPSCs were differentiated into sMNs as previously described [27, 28] and expressed the expected motor neuron-specific markers (Fig. S2). Briefly; on day 0, iPSCs were dissociated using Collagenase type IV (Thermofisher Scientific) to form embryoid bodies in suspension, which were cultured for 2 days at 37 °C in sMN basal medium (Table 1.) supplemented with 5μM Y-27632 (Merck Millipore), 40μM SB431542 (Tocris Bioscience), 0.2μM LDN (Stemgent) and 3μM CHIR99021 (Tocris Bioscience). On day 2 and 5, medium was changed to sMN basal medium supplemented with 0.1μM retinoic acid (Sigma) and 500nM SAG (Merck Millipore). On day 7, medium was changed to sMN basal medium supplemented with retinoic acid, SAG, 10ng/ml BDNF (Peprotech) and 10ng/ml GDNF (Peprotech). On day 9, medium was changed to sMN basal medium supplemented with retinoic acid, SAG, BDNF, GDNF and 10μM DAPT (Tocris Bioscience). On day 10, embryoid bodies were dissociated to single cells at 37 °C using 0.05% trypsin (Gibco). Cells were then plated at a density of 6.5 × 10⁴ cells per well in 24 well plates containing glass coverslips, precoated with poly-L-Ornithine (Sigma) and Matrigel, in day 9 medium. On day 11, half of the medium in each well was replaced with fresh day 9 medium. On day 14, half of the medium in each well was replaced with sMN basal medium supplemented with BDNF, GDNF and 20μM DAPT (Tocris Bioscience). On day 16, half of the medium in each well was replaced with sMN basal medium supplemented with BDNF, GDNF, 10ng/ml CNTF (Preprotech) and 20μM DAPT. From day 17 onwards, medium was replaced with sMN basal medium supplemented with BDNF, GDNF and CNTF every 2–3 days.
Seeding of compartmented culture device
On day 10 of sMN differentiation, 4.5 × 10⁴ cells in 40 μl of day 9 medium were seeded in the poly-L-Ornithine and Matrigel-coated cell body compartment of an Omega4 compartmented culture device (Enuvio) and left to adhere for 1 h at 37 °C, then topped up to 140 μl. 100 μl of medium was placed in the distal axon compartment of the compartmented culture device, and differentiation continued as stated above. Compartmented devices were used between 2 and 4 weeks post-seeding.
Virus strains and culturing
Viruses were grown and passaged on Vero cells (African green monkey kidney epithelial cells, ATCC CCL-81) at an MOI of 0.01 for 5–6 days in Dulbecco’s modified Eagle’s medium (DMEM; Lonza) with 2% heat-inactivated foetal bovine serum (Sigma-Aldrich), 100U/ml penicillin, 100μg/ml streptomycin (Lonza) and 2mM L-glutamine (Lonza). Supernatant was harvested and spun at 4000xg for 10 min to remove cell debris. Spun supernatant was aliquotted and frozen at -80 °C. The virus strains used in this study were USUV (lineage Africa 3, GenBank accession MH891847.1, EVAg 011 V-02153, isolated in 2016 from Turdus merula) and WNV (lineage 2, GenBank accession OP762595.1, EVAg 010 V-04311, isolated in 2020 from Phylloscopus collybita). The USUV and WNV strains used represent prevalent strains circulating in Europe [29, 30], thereby modelling the risk situation in Europe. All virus stocks were sequenced and used at passage 3.
USUV and WNV infection of iPSC-derived neuronal cultures and inhibition of IFN response
iPSC-derived Ngn2 neural co-cultures and sMN cultures were used between days 21–35. When stated, iPSC-derived sMNs were pre-treated with 8μM of Ruxolitinib (reconstituted in DMSO to a stock concentration of 10mM, SelleckChem), a JAK1/2 inhibitor, or 5 μg/ml of a neutralising anti-Human IFN-Alpha/Beta Receptor Chain 2 antibody (Clone MMHAR-2, PBL assay science), diluted in day 17 medium, at 37 °C for 2 h prior to infection. Treatments were maintained throughout the infection and subsequent culture period. For infection, all medium was removed before addition of virus inoculum diluted in day 17 medium, for sMNs, or in Ngn2 medium, for Ngn2 neural co-cultures, to an MOI of 0.01 or 1. For determination of ISG responses in sMNs, an MOI of 10 was used to ensure exposure of all cells to virus, thereby synchronising infection to increase the chances of observing small differences and reduce the variability potentially introduced by non-exposed/non-infected cells. Plates were returned to the incubator at 37 °C for 1 h, then the virus inoculum was removed before addition of fresh medium. Supernatant was removed and refreshed at the specified time points. The harvested supernatants were stored at -80 °C for titration or RNA isolation. For infection of compartmented culture devices, fluidic isolation of the distal axon compartment was maintained at all times throughout infection and subsequent incubation.
Tissue titration
Tenfold serial dilutions of supernatants were inoculated onto a monolayer of Vero cells in a 96-well plate (2.3 × 10⁴ cells/well). Cytopathic effect (CPE) was used as the readout and determined at 6 days post-infection (dpi), and virus titres were calculated as the 50% tissue culture infective dose (TCID50) using the Spearman-Kärber method [31]. An initial 1:10 dilution of supernatant resulted in a detection limit of 31.6 TCID50/ml.
RNA isolation and real-time reverse transcription quantitative PCR for quantification of virus
Sample supernatants or cell lysates in MagnaPure lysis buffer were incubated with Agencourt AMPure XP (Berckman Coulter) magnetic beads in a 96-well plate. The plate was then placed on a DynaMagTM-96 magnetic block (Invitrogen) and supernatant was removed. The beads were washed 3 times with 70% ethanol whilst still on the magnetic block and then left to air dry. The plate was removed from the magnetic block and the beads were resuspended in de-ionised water to elute the isolated RNA.
A real-time TaqMan™ assay was performed using the Applied Biosystems 7500 real-time PCR system (Thermo Fisher Scientific). Primer/probe mix (Table 2.) was diluted in TaqMan™ fast virus 1-Step Master Mix and topped up with de-ionised water to a final volume of 12 μl before addition of 8 μl sample RNA. The following program was used: 5 min 50 °C, 20 sec 95 °C and 45 cycles of 3s 95 °C and 30 sec 60 °C. Samples were compared to a standard curve of virus stock dilutions to acquire a TCID50 equivalent/ml.
RNA isolation and real-time quantitative PCR for quantification of host interferon response
Supernatant was removed and cells were gently washed with PBS, then immediately lysed with TriPure™ (Sigma-Aldrich) at the specified time point. RNA was extracted from the intracellular lysates using 5PRIME Phase Lock Gel tubes (Quantabio) for phase separation with chloroform. Next, RNA was precipitated from the aqueous phase using isopropanol. The RNA was then reverse-transcribed into cDNA using the RevertAid H Minus reverse transcriptase (Thermo Scientific) and a combination of random hexamers and oligo(dT)20 primer. To measure the host interferon response a real-time quantitative PCR was performed with iQ SYBR Green Supermix (Biorad). The samples were run in a CFX384 Touch real-time PCR detection system (Bio-Rad) using the following program: 3 min at 95 °C and 30 s at 60 °C, followed by 40 cycles of 10 s at 95 °C, 10 s at 60 °C and 30 s at 72 °C, and ending with 10 s at 95 °C and melt curve analysis using a temperature gradient from 60 °C to 95 °C with a 0.5 °C increment. Gene expression was quantified by the standard curve method using a standard dilution series of the samples in the qPCR to determine the mRNA levels as arbitrary units. mRNA levels were then normalised to RPL13a, and the fold change over the mock was calculated. The primers used for qPCR of host genes are listed in Table 3.
Immunofluorescent staining
Cells were fixed at the specified time points by incubating for 30 min in 10% formalin. In the compartmented culture system, cells were fixed for 2 h to ensure inactivation of virus in the microchannels. Fixed cells were permeabilised with 0.5% triton (Sigma) diluted in PBS for 30 min. Cells were blocked with 5% bovine serum albumin (BSA; Aurion) for 1 h before incubation with primary antibodies diluted in PBS with 2% BSA overnight at 4 °C. Cells were gently washed three times in PBS then incubated with secondary antibodies for 1 h at room temperature in the dark. Cells were gently washed three times then incubated with Hoechst (1:1000, Invitrogen) for 20 min at room temperature in the dark. Images were obtained using a Zeiss LSM 700 laser scanning microscope.
The primary antibodies used in this study were: mouse anti-flavivirus envelope protein (1:250, D1-4G2-4-15 hybridoma; ATCC, USA), rabbit anti-MAP2 (1:200, Millipore), guinea pig anti-MAP2 (1:200, Synaptic systems), rabbit anti-NF200 (1:200, Sigma Aldrich) and rabbit anti-GFAP (1:200, Millipore). The secondary antibodies used in this study were: donkey anti-mouse AF488 (1:250, Invitrogen), donkey anti-rabbit AF488 (1:200, Invitrogen), donkey anti-rabbit AF555 (1:200, Invitrogen), donkey anti-guinea pig AF647 (1:200, Invitrogen).
Image processing
Following confocal imaging, the acquired images were subjected to processing and file-type conversion using ImageJ software (version 1.53t, National Institutes of Health, Bethesda, MD).
Statistical analysis
Quantitative data were analysed and the statistical tests detailed in the figure legends were carried out using Prism 9.4.1 (GraphPad). As viral titres are presented on a logarithmic scale and have exponential growth, the raw TCID50/ml values obtained from titration were log-transformed (Y = log[Y]) using GraphPad Prism prior to statistical analysis (as presented in Fig. 1A-B and Fig. 4C-D) to aid in visualisation of the error bars and allow for better representation of the central point of data, as encouraged by Richardson et al. [32]. 2-way ANOVA with multiple comparison was employed to allow for comparison of all means of each different condition across time.

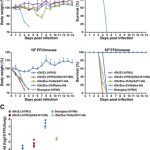
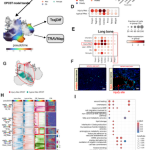
USUV can productively infect and spread within Ngn2 neural co-cultures but not motor neurons. A. Growth kinetics of USUV and WNV on iPSC-derived Ngn2 neural co-cultures infected at MOI 1 and 0.01. 3 replicates per condition, per experiment. n = 3. ** p = 0.0018. *** p = 0.0004. **** p < 0.0001. B. Growth kinetics of USUV and WNV on iPSC-derived motor neuron cultures infected at MOI 1 (n = 3) and 0.01 (n = 2). 3 replicates per condition, per experiment. Mean with SD. **** p < 0.0001. ns = non-significant. Horizontal blue line = USUV MOI 1 0hpi vs. USUV MOI 1 72hpi. Horizontal red line = WNV MOI 1 0hpi vs. WNV MOI 1 72hpi. Vertical black lines = USUV MOI 1 vs. WNV MOI 1. Data displayed has been log-transformed (Y = log[Y]). 2-way ANOVA with multiple comparison carried out on log-transformed data C. IF staining of viral envelope protein showing the distribution of USUV- and WNV-infected cells within iPSC-derived Ngn2 neural co-cultures and motor neuron cultures at 3 and 7 dpi. DAPI is shown in blue. Flaviviral envelope protein is shown in green. Scale bar represents 100 μm. Representative images of 3 experiments. An MOI of 1 was used for infection
Add Comment