Landscape of the TME in ICC
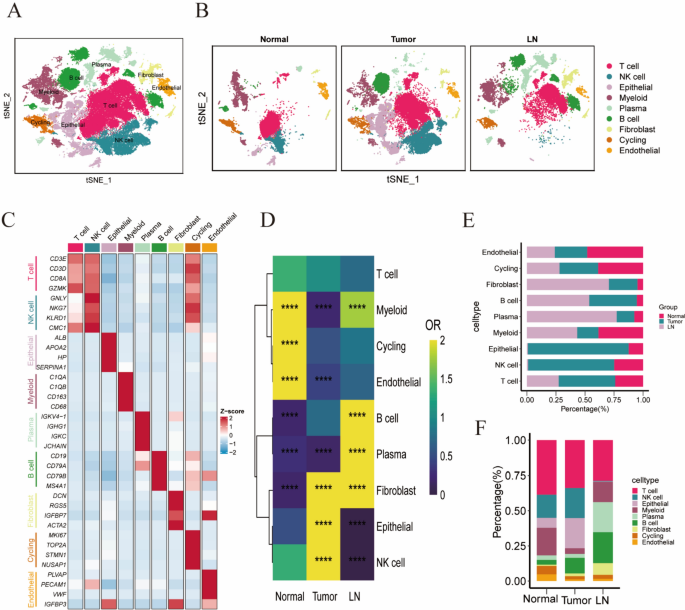
To elucidate the cellular composition of the TME and abdominal lymph nodes in ICC, we obtained tumor and abdominal lymph node samples from a patient. Fresh tissues were rapidly processed into single-cell suspensions and subjected to scRNA-seq. Given the limited sample size, we integrated our data with previously published scRNA-seq datasets on ICC to gain deeper insights into the TME. This analysis ultimately included five tumor samples, three normal samples, and one lymph node sample. To eliminate batch effects between samples, we used the Harmony package in R to integrate data from different samples. To remove low-quality cells and doublets (droplets containing two cells), we filtered out cells with fewer than 200 unique molecular identifiers (UMIs) or those with fewer than 200 or more than 8000 expressed genes per cell. We also excluded cells with over 10% mitochondrial gene UMI content to eliminate dead or dying cells. This process yielded scRNA-seq data for 79,797 high-quality cells (Figures S1A–C). Unsupervised clustering identified multiple cell clusters (Fig. 1A) without significant batch effects across samples (Fig. 1B). These clusters were classified into T cells, NK cells, epithelial cells, myeloid cells, B cells, fibroblasts, circulating cells, and endothelial cells based on canonical marker gene expression (Fig. 1C, S1D). Notably, the distribution of these eight cell types varied significantly across samples: NK and epithelial cells were predominantly found in tumor tissues, while B and plasma cells were mainly in lymph nodes (Figs. 1D–F). We observed a significant increase in NK cells and fibroblasts in ICC tumor tissues compared to normal tissues, potentially linked to cytokine recruitment within the TME. Endothelial cells were more enriched in normal tissues than in tumor tissues, but their numbers are limited in both. Given the lack of research on ICC endothelial cells, we explored their potential role in the TME.
Immunological infiltration landscape within the TME of ICC. A t-SNE dimensionality reduction plot depicting the distribution of distinct cell populations after integrating tumor, normal, and lymph node samples from ICC patients. B t-SNE plot illustrating the distribution of cell populations within normal tissue, tumor tissue, and lymph node samples. C Heatmap showing the expression of canonical marker genes specific to each cell type. D Odds ratio (OR) heatmap comparing the abundance of each cell type across normal tissue, tumor tissue, and lymph node samples. E Proportional distribution of cell types in normal tissue, tumor tissue, and lymph node samples. F Bar graphs illustrating the proportions of each cell type within normal tissue, tumor tissue, and lymph node samples
Heterogeneity of TECs in the TME of ICC
In ICC tumor tissues, there is abundant blood supply, characterized by a high number of blood vessels with complex structures, affecting the metabolic and immunological status of the TME [19,20,21]. These tissues exhibit elevated levels of pro-angiogenic factors that activate TECs, thereby playing a pivotal role in the TME [22,23,24]. Therefore, we analyzed the role of TECs in the TME.
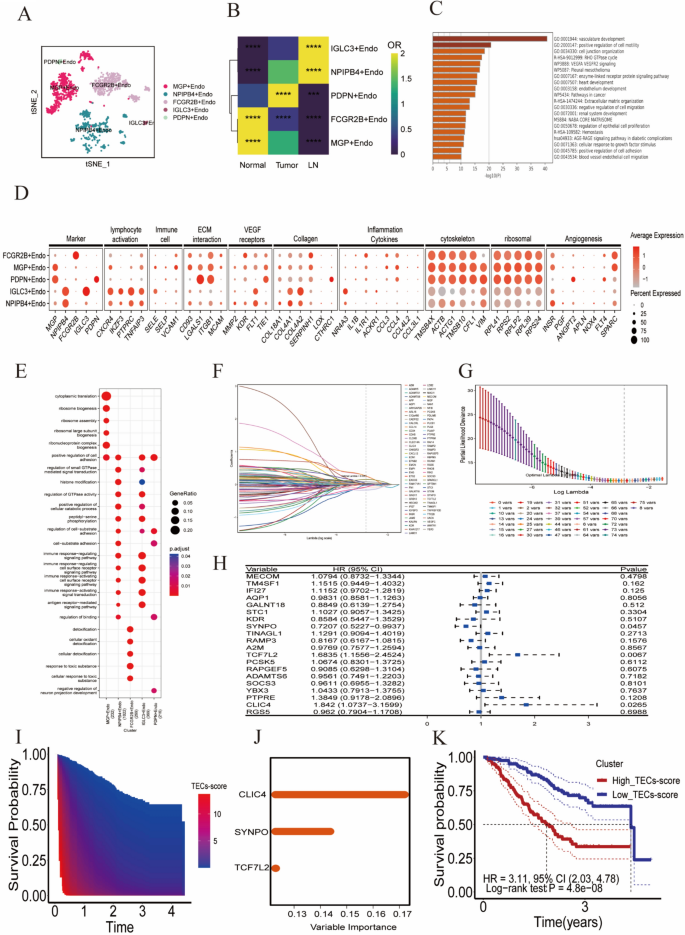
A total of 1643 TECs with significant heterogeneity were identified. Through clustering analysis, all TECs were categorized into five distinct cell clusters: MGP+Endo, NPIPB4 +Endo, FCGR2B+Endo, IGLC3 +Endo, and PDPN+Endo (Fig. 2A). ROGUE was used to precisely quantify the purity of the identified endothelial cell subpopulations, ensuring a robust and sensitive assessment of their homogeneity (Figure S1E). The distribution of endothelial cell subpopulations showed significant variation across tissues (Fig. 2B). MGP+Endo and FCGR2B+Endo were predominantly enriched in normal tissues, while NPIPB4 +Endo and IGLC3 +Endo were primarily enriched in lymphatic tissues. PDPN+Endo and a subset of NPIPB4 +Endo were mainly found in tumor tissues.
Characterization and functional analysis of endothelial cell populations. A t-SNE dimensionality reduction plot depicting the distribution of endothelial cells after integrating tumor, normal, and lymph node samples from ICC patients. B OR heatmap comparing the abundance of endothelial cells across normal tissue, tumor tissue, and lymph node samples. C Enrichment analysis of highly expressed genes in endothelial cells. D Expression patterns of functionally relevant genes across different endothelial cell subpopulations, demonstrating their characteristics in various functional pathways. E GO functional enrichment analysis results of characteristic genes in endothelial cell subpopulations, presented as dot plots. F–G Distribution plots of the partial likelihood deviation and coefficient of LASSO regression. H Forest plot from Cox multivariate regression analysis, identifying three independent prognostic-related genes by analyzing the relationship between each gene and the HR with a CI of 95%. I Heatmap illustrating the correlation between TEC scores and survival time. J Bar graph showing the importance ranking of gene variables in the random forest model. K Kaplan–Meier survival curves comparing high and low TEC score groups, indicating a poorer prognosis for the high TEC score group
Pathway enrichment analysis revealed that genes overexpressed in these cells were primarily associated with angiogenesis and extracellular matrix remodeling (Fig. 2C). Each endothelial cell cluster exhibited a distinct gene expression pattern (Fig. 2D–E): The MGP+Endo cluster is characterized by the upregulation of genes involved in immune cell interactions (SELE, SELP, VCAM1), collagen production (COL4A1, COL4A2), and angiogenesis (INSR, SPARC), and is enriched in the “positive regulation of cell adhesion” pathway. The FCGR2B+Endo cluster shows increased expression of genes associated with the inflammatory response (IL1B, IL1R1, CCL3, CCL4), indicating its role in inflammation. The NPIPB4 +Endo and IGLC3 +Endo clusters overexpress genes linked to lymphocyte activation (CXCR4, IKZF3, PTPRC, TNFAIP3) and collagen (COL4A1, COL4A2), with enrichment in pathways regulating and activating immune responses, suggesting these lymph node-derived endothelial cells play a significant role in immune regulation. The PDPN+Endo cluster, predominantly found in tumor tissue, upregulates genes involved in extracellular matrix interactions (ITGB1, LGALS1) and angiogenesis (ANGPT2, FLT4), highlighting its involvement in these processes.
Establishment and validation of a three-gene prognostic signature based on TEC marker genes
Characteristic gene expression-related alterations in TECs within the TME precisely regulate their proliferation, migration, and vascular structural stability [25,26,27,28,29]. The aberrant expression of these genes can promote abnormal angiogenesis and potentially lead to tumor progression and poor prognosis [30, 31]. To investigate the impact of TEC-specific genes on prognosis, we selected 206 genes that were highly expressed in TECs based on the following criteria: avg_log2FC > 1 and P_val_adj < 0.05. Through Cox univariate regression analysis, we further identified 79 genes that significantly influenced ICC patient prognosis (P < 0.05, Supplementary Table 1). Subsequently, we employed LASSO regression analysis to determine the key variables most associated with OS. To enhance the accuracy of the model, we set the number of iterations for the algorithm to 1000. In addition, we utilized the cv.glmnet function for tenfold cross-validation, to reduce the risk of model overfitting. Ultimately, at a lambda.min value of 0.0351, we selected 19 variables with non-zero coefficients (Figs. 2F–G). Through Cox multivariate regression analysis of these 19 variables, three genes were identified as independent prognostic factors for ICC patients (P < 0.05, Fig. 2H).
The genes TCF7L2, CLIC4, and SYNPO are highly expressed in endothelial cells and show a certain level of specificity (Figure S1F-G). The TEC score indicated the expression levels of these three genes, and was calculated as follows: 0.6872 × TCF7L2 expression + 0.9846 × CLIC4 expression − 0.5397 × SYNPO expression.
We discovered that the prognosis of ICC patients worsened with an increase in the TEC scores (Figs. 2I and S2A). The results of random forest survival analysis indicated that the CLIC4 expression level was the most significant variable contributing to the TEC score (Fig. 2J). Using the median TEC score value, we classified 244 ICC patients into high and low TEC score groups. Kaplan–Meier curve analysis confirmed the poorer prognosis in the high TEC score group compared to the low TEC score group (hazard ratio [HR] = 3.11, 95% confidence interval [CI]: 2.03–4.78, P = 4.8e-08, Fig. 2K). Time-dependent ROC analysis showed AUC values of 0.754 and 0.785 for predicting OS at 1 and 3 years, respectively, and was used to assess the predictive ability of TEC scores (Figure S2B). In the GSE89749 validation set, ICC patients in the high TEC score group also exhibited a poorer prognosis (Figure S2C), confirming the robustness of the TEC score for predicting ICC patient prognosis. Time-dependent ROC curves further validated the predictive efficacy of the TEC score for long-term survival in ICC patients (Figure S2D).
TEC scores and Intrahepatic metastasis were identified as reliable factors for predicting ICC patient prognosis
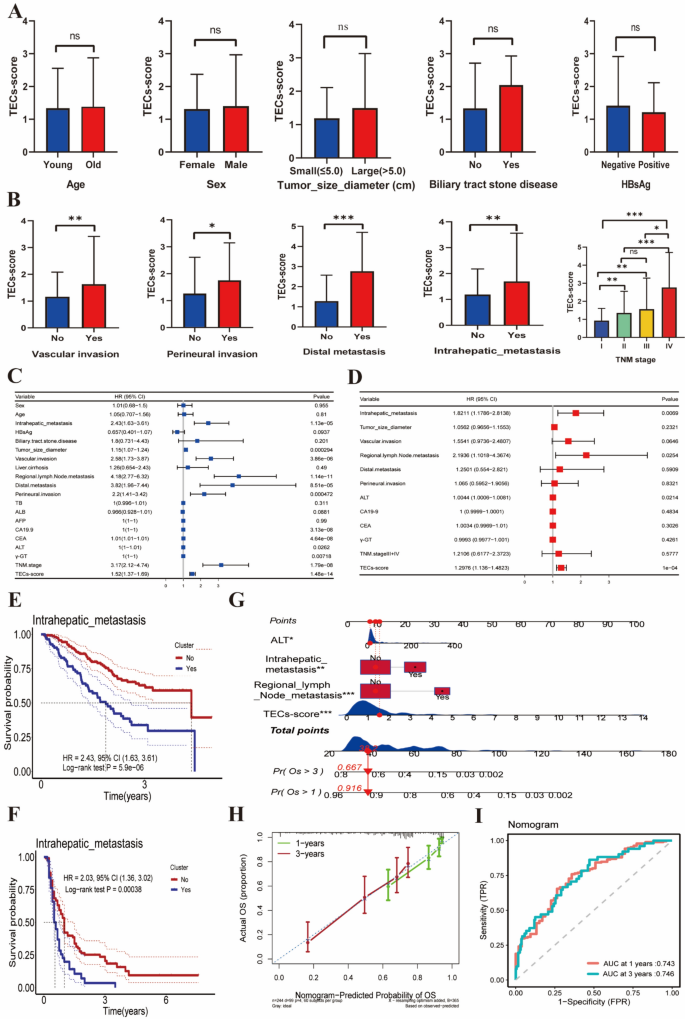
To thoroughly examine the association between the TEC score and the clinical features of ICC patients, we performed a comprehensive correlation analysis. The results indicated that the TEC score was not associated with patient age, sex, tumor diameter, history of gallstones, or hepatitis B surface antigen (HBsAg) status (Fig. 3A). However, it was significantly correlated with vascular invasion, perineural invasion, distant metastasis, intrahepatic metastasis, and TNM staging (Fig. 3B). Furthermore, the TEC score was significantly and positively correlated with tumor markers, including elevated levels of carbohydrate antigen 19–9 (CA19-9) and carcinoembryonic antigen (CEA) (Figure S2E–F). These findings suggest that the TEC score may be related to tumor invasiveness.
Analysis of the relationship between TEC scores, clinical characteristics, and prognosis. A Comparison of TEC scores among various clinical characteristics, presented as a bar graph showing the impact of factors such as age, sex, tumor diameter, history of bile duct stones, and HBsAg status on TEC scores. B Bar graph showing the correlation between TEC scores and tumor invasion characteristics, including vascular invasion, perineural invasion, distant metastasis, intrahepatic metastasis, and TNM staging. C Forest plot showing hazard ratios (HR) and p-values for various clinical characteristics, derived from Cox univariate regression analysis identifying significant factors affecting ICC patient prognosis. D Cox multivariate regression analysis identifying independent risk factors affecting long-term survival in ICC patients. E Kaplan–Meier curves illustrating the relationship between intrahepatic metastasis and survival time, comparing patients with and without intrahepatic metastasis. F Kaplan-Meier survival curve analysis for validation cohort 1, stratified by intrahepatic metastasis. G A nomogram for predicting ICC patient prognosis, incorporating factors such as intrahepatic metastasis, regional lymph node metastasis, ALT levels, and TEC scores. H A calibration curve to verify the predictive performance of the nomogram. I ROC curve assessing the predictive performance of the nomogram, with AUCs of 0.743 and 0.746 for 1-year and 3-year survival rates, respectively
Univariate Cox regression analysis indicated that several factors significantly impacted ICC patient prognosis. These factors included intrahepatic metastasis; tumor size; microvascular invasion; regional lymph node metastasis; distant metastasis; perineural invasion; CA19-9, CEA, alanine aminotransferase (ALT), and gamma-glutamyltransferase (γ-GT) levels; TNM staging; and TEC scores (all with P < 0.05, Fig. 3C). Cox multivariate regression analysis further confirmed that intrahepatic metastasis, regional lymph node metastasis, ALT levels, and TEC scores were independent risk factors affecting ICC patient prognosis (HR > 1, P < 0.05, Fig. 3D).
Notably, there may be a correlation between the TEC score and the occurrence of intrahepatic metastasis, with ICC patients positive for intrahepatic metastasis showing a poorer prognosis (HR = 2.43, 95% CI 1.63–3.61, P = 5.9e-06, Fig. 3E). This suggests that both TEC scores and intrahepatic metastasis are important prognostic indicators for predicting ICC patient outcomes. To further validate this finding, we obtained clinical data from 155 ICC patients. Survival analysis revealed that patients with ICC and intrahepatic metastasis had a poorer prognosis (HR = 2.03, 95% CI 1.36–3.02, P = 0.00038, Fig. 3F). Moreover, within this dataset, intrahepatic metastasis emerged as an independent risk factor influencing the prognosis of ICC patients (Figure S2G–H), which is consistent with previous analytical results.
Finally, we constructed a nomogram for predicting the prognosis of ICC patients based on intrahepatic metastasis, regional lymph node metastasis, ALT levels, and TEC scores (Fig. 3G). Both the ROC curve and calibration curve confirmed the favorable performance of the nomogram for predicting 1-year and 3-year survival rates in ICC patients (Fig. 3H–I).
TEC scores reflect the degree of infiltration of immunosuppressive cells in the TME
To explore the mechanisms underlying the predictive capability of the TEC score, we examined its relationship with immune cell infiltration. Gene expression data from 244 ICC patients were analyzed using the xCell platform (https://comphealth.ucsf.edu/app/xcell) to assess immune cell infiltration proportions. The study revealed significant differences in immune cell infiltration between the high and low TEC score groups. The TME in the high TEC score group was predominantly infiltrated by CD8 + Tcm, DCs, MSCs, monocytes, neutrophils, Th2 cells, and iDCs, whereas the low TEC score group was mainly infiltrated by CD8 + Tem, mast cells, plasma cells, and Th1 cells (Fig. 4A). High levels of infiltration of neutrophils and Th2 cells reflected a robust inflammatory response state, suggesting that ICC patients in the high TEC score group may exhibit higher levels of inflammation.
Analysis of the relationship between TEC scores and TME immune cell infiltration. A Bar graph comparing immune cell infiltration between high and low TEC score groups, showing differences in the proportions of various immune cells. B Heatmap analysis of high and low TEC score groups, illustrating the mRNA and protein expression levels of S100A family members in both groups. C Heatmap showing differences in markers that promote or inhibit cancer inflammation at the mRNA level between high and low TEC score groups. D Kaplan–Meier curves illustrating the relationship between immune cell composition in the TME and survival time, highlighting the impact of different immune cell infiltrates on patient survival. E Sankey diagram of TME cell composition between different risk groups, demonstrating the difference in immune cell composition between the high and low TEC score groups. F Bar graph comparing TME cell compositions based on HBV infection status, illustrating differences in immune cell proportions between HBV-positive and negative patients
The mRNA and protein levels of S100A family members (including S100A8/S100A11) were upregulated in the high TEC score group (Fig. 4B), potentially associated with oncogenic inflammation. GSEA enrichment analysis revealed that the high TEC score group was primarily enriched in inflammatory response, IL-6/JAK/STAT3 signaling, TGF-β signaling, and TNF-α/NF-κB signaling pathways, indicating that these tumors might be driven by underlying chronic overt or smoldering inflammation (Figure S3A–D) [32,33,34,35]. Additionally, the numbers of immunosuppressive neutrophils and iDCs were significantly increased in the TME of the high TEC score group (Fig. 4A), suggesting that ICC patients in this group may have a potent immunosuppressive microenvironment. Concurrently, increased mRNA levels of CD8A, GZMA, and PRF1 in the low TEC score group confirmed the upregulation of anti-tumor immune responses (Fig. 4C).
Kaplan–Meier curve results showed that ICC patients exhibiting high infiltration of neutrophils, Th2 cells, and iDCs had a poorer prognosis, whereas those with high infiltration of CD8 + Tem exhibited a contrasting outcome (Fig. 4D). In the ICC TME, high infiltration of neutrophils and iDCs leads to an upregulation of immunosuppressive genes (Figure S3E-F), further confirming that ICC patients in the high TEC score group may exhibit an inflammation-dominated immunosuppressive phenotype. ICC patients in the high TEC score group showed a high overlap with the immune-suppressed subgroup (IG1) reported by Lin et al. (Fig. 4E) [36].
HBV infection is a known risk factor for ICC, but the immunogenomic characteristics of HBV-associated ICC are poorly understood. Immune infiltration analysis revealed a significant increase in adaptive immune cells, including B cells, CD4 + T cells, CD4 + memory T cells, CD8 + Tem, and NK cells in the TME of HBV-positive ICC patients, with no significant difference in immunosuppressive myeloid cells (Fig. 4F). This finding indicates that HBV infection does not amplify the oncogenic inflammatory response in ICC; instead, it enhances the infiltration of cytotoxic immune cells.
Overexpression of CXCL12 and KRAS mutations affect TME neutrophil and iDC infiltration
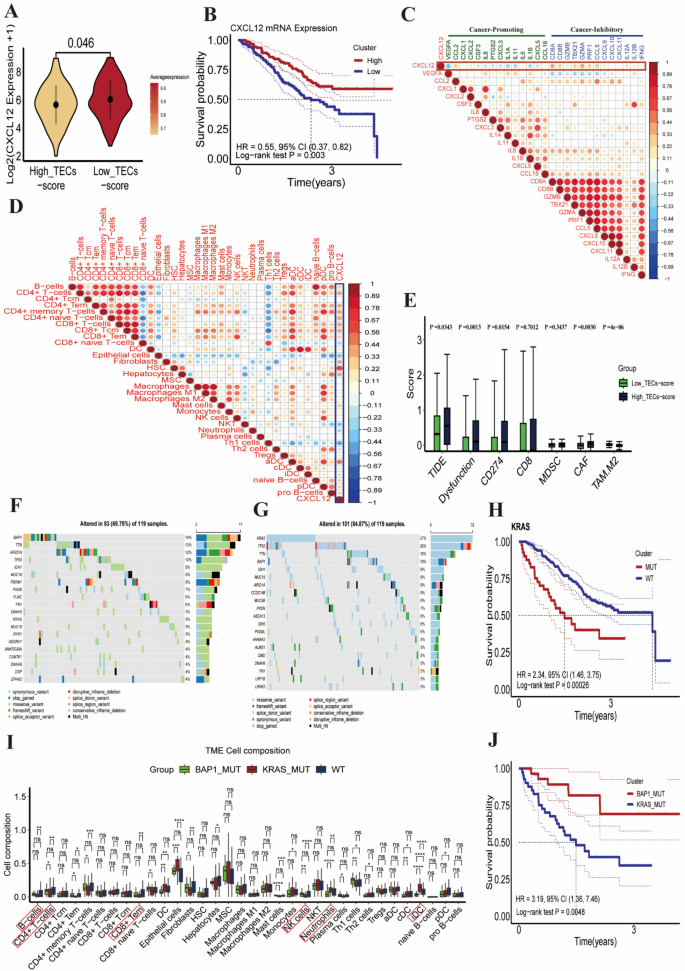
Studies have demonstrated that the chemokine CXCL12 regulates directional leukocyte migration through its interaction with receptors CXCR4 or CXCR7 [37]. Intriguingly, we observed significantly higher CXCL12 expression levels in the low TEC score group (Figs. 5A, S3G), contrasting with the excessive infiltration of neutrophils and iDCs in the high TEC score group (Fig. 4A). As expected, patients with higher CXCL12 mRNA levels exhibited a more favorable prognosis (HR = 0.55, 95% CI 0.37–0.82, P = 0.003) (Fig. 5B). The levels of CXCL12 mRNA were negatively correlated with oncogenic factors, including VEGF, IL1A, IL1B, CXCL3, and IL-6, and positively correlated with tumor suppressive factors, including CD8A, GZMA, TBX21, and CCL5 (Fig. 5C). The CXCL12 mRNA levels were negatively associated with the infiltration of neutrophils and iDCs, and positively correlated with the infiltration of NK, CD4 + T, and CD8 + Tem cells (Fig. 5D). These findings suggest that CXCL12 overexpression might facilitate the infiltration of adaptive immune cells (e.g., NK, CD4 + T, and CD8 + Tem cells) while reducing neutrophils and iDCs.
Analysis of the relationship between CXCL12 expression levels, KRAS mutations, and TME immune cell infiltration. A Violin plot comparing CXCL12 expression levels between high and low TEC score groups. B Kaplan–Meier curves illustrating the relationship between CXCL12 mRNA expression levels and patient prognosis. C Correlation bubble plot illustrating the relationship between CXCL12 and both oncogenes and tumor suppressor genes. D Correlation bubble plot showing the relationship between CXCL12 and various cell infiltrates. E Comparison of TIDE scores and Dysfunction scores in different TEC score groups. F Mutation waterfall plot showing the types and frequencies of gene mutations in the low TEC score group among 119 ICC patients. G Mutation waterfall plot showing the types and frequencies of gene mutations in the high TEC score group among 119 ICC patients. H Survival analysis under different gene mutation statuses, illustrated by Kaplan–Meier curves showing survival differences between patients with mutated and wild-type KRAS. I Comparison of immune cell infiltration in the TME among patients with wild-type genes, KRAS mutations, and BAP1 mutations. J Kaplan–Meier survival curve analysis comparing KRAS and BAP1 mutations with ICC patient prognosis
Tumor immune dysfunction and exclusion (TIDE) is a predictor of the response to immune checkpoint inhibitors (ICIs) in various cancers. The low TEC score group had the lowest TIDE and dysfunction scores (Fig. 5E), indicating that patients with lower TEC scores might have less potential for immune escape and may respond more effectively to ICIs.
We further investigated genomic alterations that might be associated with immunological characteristics. The primary mutated genes in the low TEC score group were BAP1, TTN, and ARID1A, with an overall mutation frequency of 69.75% (Fig. 5F). In contrast, the primary mutated genes in the high TEC score group were KRAS, TP53, and TTN, with an overall mutation frequency of 84.87% (Fig. 5G). We hypothesized that KRAS mutations might be attributable to the poorer prognosis in ICC patients with high TEC scores. Kaplan–Meier curve analysis confirmed that patients with KRAS mutations had a worse prognosis (HR = 2.34, 95% CI 1.46–3.75, P = 0.00026, Fig. 5H), while patients with BAP1 mutations had a better prognosis (HR = 0.54, 95% CI 0.26–1.12, P = 0.093, Figure S4A). Immune infiltration analysis revealed that patients with KRAS mutations showed a significant reduction in NK, B, CD4 + T, and CD8 + Tem cells, along with a marked increase in neutrophil and iDC infiltration. Conversely, patients with BAP1 mutations exhibited a contrasting trend (Fig. 5I). ICC patients with KRAS mutations had higher TEC scores (Figure S4B), and poorer prognoses (HR = 3.19, 95% CI 1.36–7.46, P = 0.0048) (Fig. 5J). GSEA enrichment analysis revealed that ICC patients with KRAS mutations were predominantly enriched in pathways associated with myeloid cell-driven inflammatory responses, including neutrophil degranulation, inflammatory response, and TNF-α signaling via NF-κB signaling pathways. In contrast, BAP1 mutations in ICC patients were primarily enriched in the oxidative phosphorylation (OXPHOS) signaling pathway (Figure S4C), which is crucial for immune activation.
In summary, the TEC score can reflect the genomic mutation status in ICC patients. KRAS mutations may increase the infiltration of neutrophils and iDCs, while decreasing the infiltration of NK, CD4 + T, and CD8 + Tem cells. In contrast, BAP1 mutations and CXCL12 overexpression have contrasting effects.
TECs interact with various immune cells through the CXCL12/CXCR4 axis
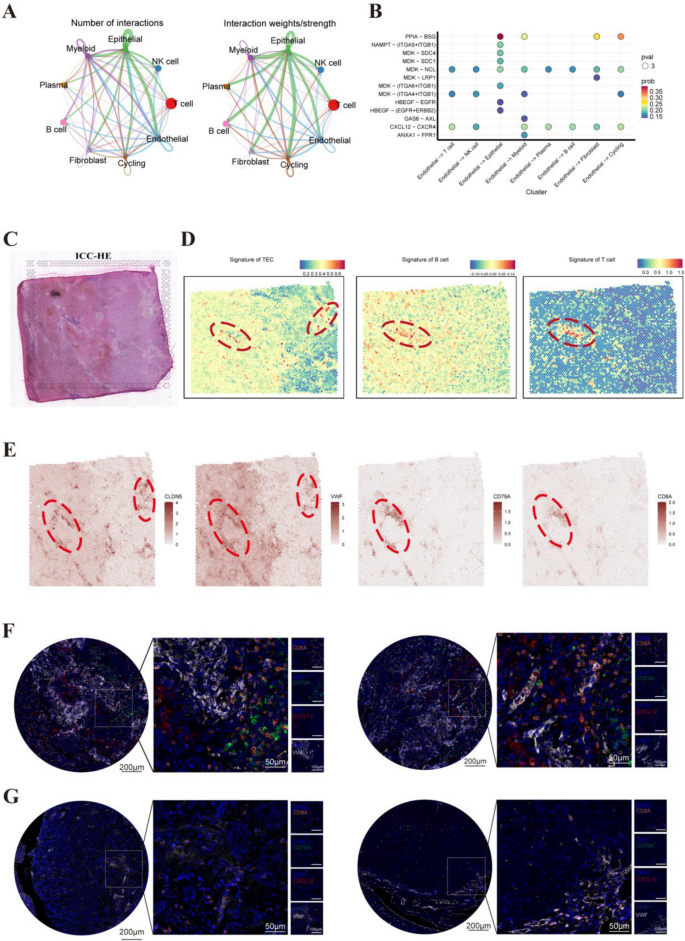
To investigate the interactions between TECs and various immune cells within the TME, the CellChat package in R was used to perform a detailed analytical examination of cell–cell communication networks. The analysis found significant interactions between TECs and various immune cells in the TME (Fig. 6A). Further analysis of the receptor–ligand pairs involved in interactions between TECs and other cell types revealed that CXCL12/CXCR4 is the primary signaling axis through which TECs interact (Fig. 6B). TECs are the primary producers of CXCL12 (Figure S5A), and ICC patients with high CXCL12 expression levels have a better prognosis (Fig. 5B).
TECs interact with T cells and B cells. A Interaction network diagram depicting the relationships between TECs and other cell types. B Dot plot illustrating the strength of interactions, with a focus on the CXCL12/CXCR4 signaling axis. C Histological image of ICC tumor samples. D Spatial transcriptomic analysis showing the spatial distribution of endothelial cell signatures, B cell signatures, and T cell signatures within the ICC tissue. E Spatial maps showcasing the signature expression of VWF and CLDN5 (endothelial markers), CD79A (B cell marker), and CD8A (T cell marker), illustrate the spatial co-localization of these cells within the tissue. F Immunofluorescence staining experiments demonstrated that endothelial cells in tumor tissues secrete higher levels of CXCL12, which is associated with increased infiltration of T cells and B cells around the endothelial cells. G Immunofluorescence staining experiments showed that endothelial cells in tumor tissues secrete lower levels of CXCL12, accompanied by reduced infiltration of T cells and B cells around the endothelial cells
We extracted the feature matrix from scRNA-seq data and uploaded it to the CIBERSORTx online analysis platform (https://cibersortx.stanford.edu/) to evaluate the abundance of immune and stromal cells in each ICC sample. The correlation heatmap depicted a robust positive association between the prevalence of TECs and the concurrent abundance of T cells and myeloid cells, highlighting the interplay between these cells in the TME (Figure S5B). Spatial transcriptomic deconvolution analysis further confirmed the spatial co-localization of TECs with T cells and B cells (Figs. 6C–E, S5C). Additionally, TEC regions with high CXCL12 expression show a marked tendency for co-localization with T cells and B cells compared to regions with lower expression (Figure S5D). This suggests that TECs may interact with immune cells by secreting CXCL12, promoting immune activation and exhibiting an anti-tumor effect. Multiplex immunofluorescence staining experiments also confirmed the chemotactic effect of TECs with high CXCL12 expression levels on both T and B cells (Fig. 6F, Figure S5E–F), while those with low expression do not show this trend (Fig. 6G).
TEC.Sig predicts the response to immunotherapy
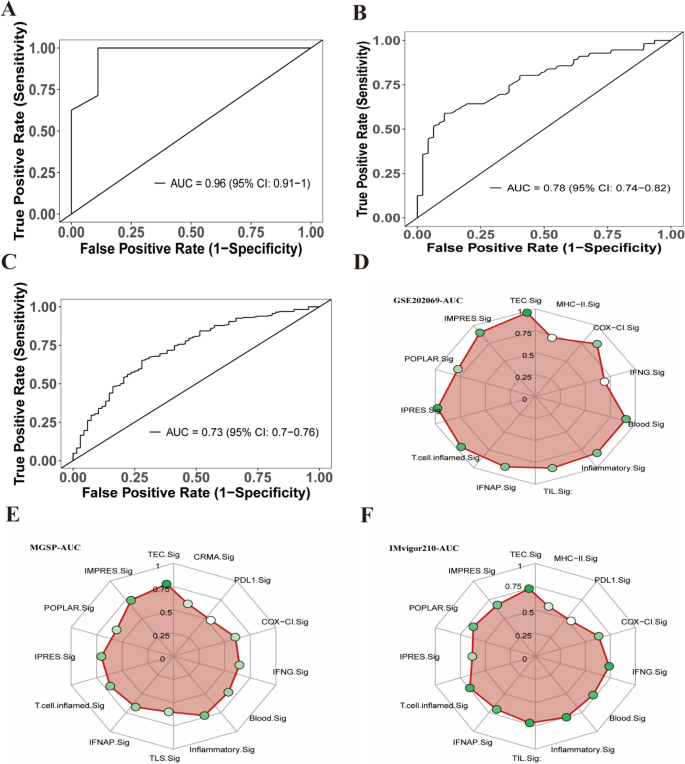
To investigate the association between the TEC.Sig and response to immunotherapy, we downloaded immunotherapy-related data from the GEO database for primary HCC (GSE202069), melanoma (MGSP: Melanoma Genome Sequencing Project), and bladder cancer (IMvigor210). The Cancerclass package in R software was used to calculate the z-score based on the expression levels of TEC.Sig genes for each tumor patient, to predict their responsiveness to immunotherapy. In the GSE202069 dataset, we found that the TEC.Sig could significantly predict immunotherapy outcomes in HCC patients, with an AUC of 0.96 (95% CI 0.91–1, Fig. 7A). Similarly, TEC.Sig also showed a high predictive value in the MGSP and IMvigor210 datasets, with AUC values of 0.78 (95% CI 0.74–0.82) and 0.73 (95% CI 0.7–0.76), respectively (Fig. 7B–C). Compared to previously reported gene sets used for predicting immunotherapy responses [38,39,40,41], TEC.Sig also exhibited larger AUC values (Figs. 7D–F, S6A–C). These results indicate that TEC.Sig demonstrates a reliable level of accuracy for predicting the immunotherapy response.
Performance evaluation of the prediction model. A ROC curve of the prediction model using the GSE202069 dataset, with an AUC value of 0.96. B ROC curve of the prediction model using the MGSP dataset, with an AUC value of 0.78. C ROC curve of the prediction model using the IMvigor210 dataset, with an AUC value of 0.73. D Comparison of AUC values of the prediction model on the GSE202069 dataset using radar charts, demonstrating the performance of the TEC.Sig compared to other models used for predicting the immunotherapeutic response. E Comparison of AUC values of the prediction model on the MGSP dataset using radar charts, demonstrating the performance of the TEC.Sig compared to other models used for predicting the immunotherapy response. F Comparison of AUC values of the prediction model on the IMvigor210 dataset using radar charts, demonstrating the performance of the TEC.Sig compared to other models used for predicting the immunotherapy response



Add Comment