Identification of bioactive molecules and their respective targets
After exploring, refinement, and removing the repetitions, 10 active compounds were selected based on their bioavailability rate (F ≥ 30%) and the potential for oral drug candidacy (DL ≥ 0.18) (Table 1). Bioavailability (F) refers to the extent and speed at which the pharmacologically active substance of a medication is absorbed and reaches the systemic circulation, enhancing its efficacy [50]. Meanwhile, drug-likeness (DL) is used to measure the potential of a compound to turn into an oral medication by evaluating its structure and properties [51].
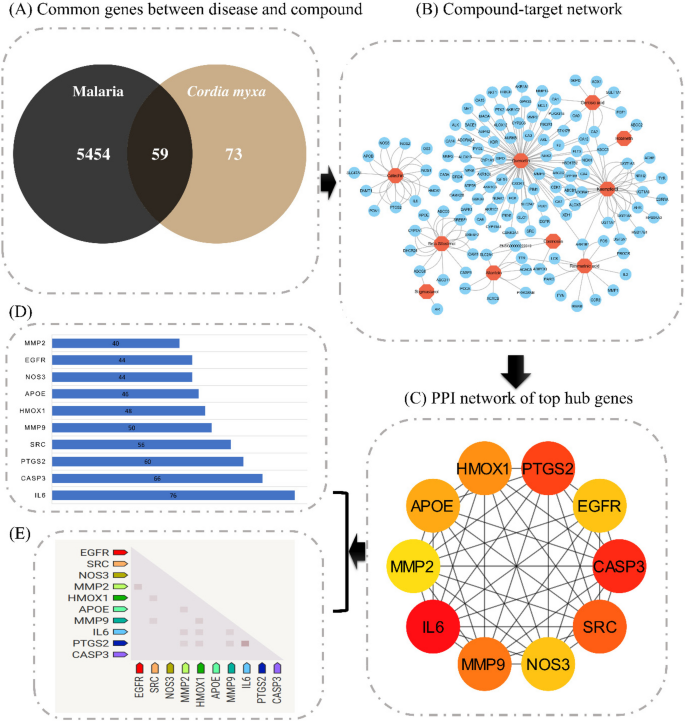
Swiss Target Prediction and STITCH databases were utilized to examine probable target genes of the 10 active constituents. As a result, 132 total targets were obtained. To further narrow down the search, 11,563 genes associated with malaria were downloaded through the GeneCards database. A Venn diagram was used to recognize overlapping targets of both malaria and active compounds, and 59 putative anti-malaria genes of C. myxa were recognized as key targets (Fig. 2A).
The SwissADME tool was employed to evaluate various pharmacokinetic properties, which are critical for predicting absorption, distribution, metabolism, and excretion (ADME) characteristics. Toxicity parameters for the compounds were assessed using the ProTox-II tool and the results show that all the compounds are non-toxic. The ADMET profiling revealed that the compounds exhibited favorable pharmacokinetic properties without any adverse effects. Furthermore, the analysis of ADMET characteristics, including their roles as Gi Absorption, BBB, P-glycoprotein substrates, and inhibitors of enzymes such as CYP1A2, CYP2C19, CYP2C9, and CYP2D6, produced promising results, indicating the compounds’ potential as drug candidates. Overall, the compounds demonstrated non-toxic behavior (Table 2).
Compounds-target network construction
After conducting an extensive investigation, a total of 10 active compounds were found from C. myxa that showed promising results in the treatment of malaria. Subsequently, 59 main targets were selected, along with the associated pathways with the most genes. These.
were used to create an “active compound-targeted genes-connected” network structure. Interestingly, every active molecule is linked to several targets, suggesting that a synergistic effect may be induced by the C. myxa compound when used as an anti-malaria agent (Fig. 2B).
The degree of connectivity for each of the 10 compounds was evaluated using the compound-targeted genes-connected network, with flavonoids and steroids having the greatest level of connectivity (Table 3). In contrast, other compounds had a lower degree of connectivity compared to flavonoids and steroids. All 10 compounds were chosen for docking analysis. The analysis of these compounds will provide a deeper understanding of their potential efficacy and provide valuable insights into their mechanism of action for the treatment of malaria.
Functional annotation and KEGG pathway analysis
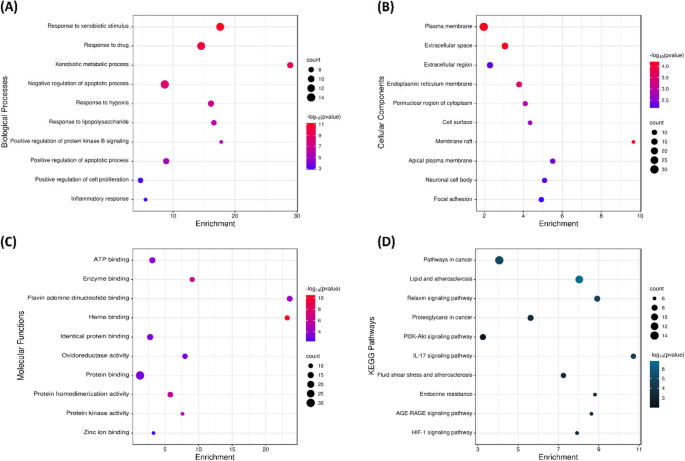
To further comprehend the dynamic activity of putative targets of C. myxa against malaria, a GO enrichment and KEGG pathway investigation was performed. The GO analysis displayed that the targets of C. myxa were associated with a variety of biological processes (BP) comprising drug response, response to xenobiotic stimulus, negative regulation of metabolic processes, and more (Fig. 3A). The GO cellular component (CC) analysis revealed that these target genes were distributed in different parts of the cell, including the plasma membrane, extracellular matrix, and endoplasmic reticulum membrane among others (Fig. 3B). The GO molecular function (MF) analysis uncovered that the targets were associated with functions such as ATP binding, protein binding, protein homodimerization activity, and other functions (Fig. 3C). The KEGG pathway analysis revealed various pertinent signaling pathways associated with C. myxa’s anti-malaria action. According to this, most of the genes were implicated in pathways related to oncogenesis, Relaxin signaling pathways, PI3K-Akt signaling, and other pathways (Fig. 3D). Moreover, the KEGG pathway analysis highlighted that interleukin 6 (IL6), caspase-3 (CASP3), prostaglandin-endoperoxide synthase 2 (PTGS2), SRC proto-oncogene (SRC), heme oxygenase-1 (1HMOX1), Matrix Metallopeptidase-9 (MMP9), apolipoprotein E (APOE), nitric oxide synthase-3 (NOS3), Epidermal growth factor receptors (EGFR), and Matrix Metallopeptidase-2 (MMP2) were highly significant target genes.
Network-pharmacology analysis of multiple compounds, targets associated with them, and the pathways involved in the malaria treatment. A Venn diagram illustrating the overlap between targets of C. myxa and malaria, B Network diagram showing compounds and their associated targets, C Top 10 hub genes ranked according to their degree, D Bar plot depicting the 10 hub genes, E Examination of the expression of 10 hub genes was observed in
Homo sapiens.
Construction of PPI network
To investigate the prospective targets of C. myxa for malaria therapy, the 59 overlapped genes were analyzed using the STRING database to construct a PPI network. This network provided insights into the interrelationship among multiple targets throughout the progression of the disease, with nodes and their associated interactions indicating these connections. To conduct a more detailed analysis of the PPI network of the intersecting genes, the CytoHubba plugin in Cytoscape was employed. The results showed that IL6 (76), CASP3 (66), PTGS2 (60), SRC (56), MMP9 (50), HMOX1 (48), APOE (46), NOS3 (44), EGFR (44), and MMP2 (40) had the highest degrees of overlapping (Fig. 2C). This indicates that these genes are highly correlated with each other and may be key targets for the treatment of malaria. Comparison with enrichment analysis results pinpointed IL6 and CASP3 as the primary anti-malaria targets of C. myxa. These genes were chosen for molecular-docking experiments to determine their potential binding affinity with compounds from C. myxa.
Compound-target-pathway network construction
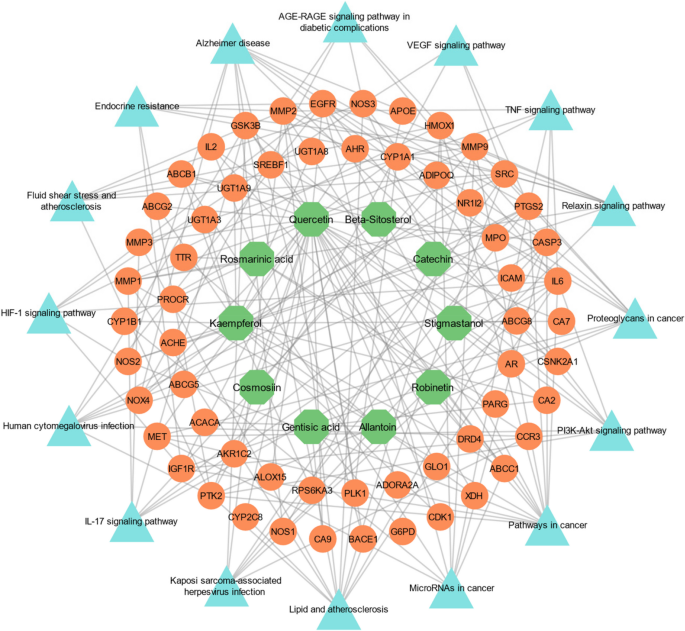
To enhance our understanding of the pathways in which the target is implicated, KEGG analysis was utilized to gather data on the target pathways, which was then imported into Cytoscape 3.9.1. Through this process, several pathways were identified that were top-ranked by KEGG and known to be associated with malaria. Notably, this analysis highlighted the involvement of target proteins in various metabolic pathways. These include pathways in cancer, the PI3K-Akt signaling pathway, proteoglycans in cancer, Relaxin and TNF signaling pathway, VEGF signaling pathway, MicroRNAs in cancer, lipid, and atherosclerosis, IL-17 and HIF-1 signaling pathway, and AGE-RAGE signaling pathway (Fig. 4). Identifying these specific pathways can provide further insights into the mechanisms underlying malaria and potentially assist in the advancement of more effective treatments for this devastating condition.
Molecular docking
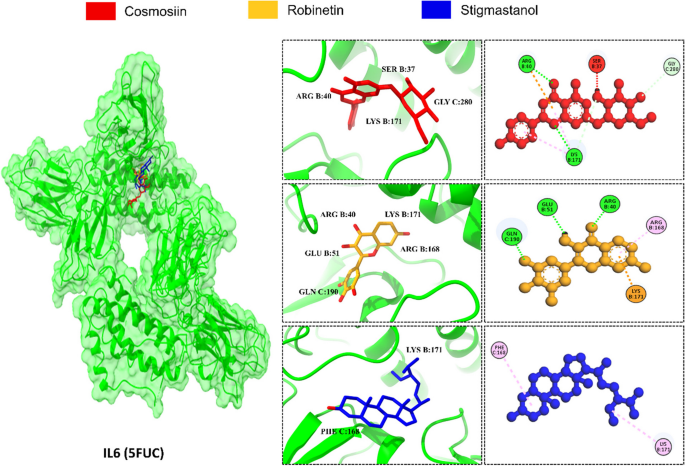
The structured analysis of the PPI network was conducted to identify the top target IL6 and CASP3 for molecular docking. The crystal arrangement of IL6 (PDB ID: 5FUC) and CASP3 (PDB ID: 2DKO) were obtained through the Protein Data Bank (PDB), and structural improvement was carried out utilizing the UCSF Chimera tool. Following that, minimization of energy was executed to ensure that the protein receptors were devoid of clashes and incorrect configurations, and any atypical residues were discarded. The molecular docking process was undertaken to look for a putative target with the potential to reduce the risk of malaria. The analysis revealed strong binding affinities between the constituents and the target protein’s binding pockets, assessed through docking scores and RMSD (Table 4). Protein 5FUC exhibited the highest binding energies with cosmosiin (-7.7 kcal/mol), robinetin (-7.6 kcal/mol), and stigmastanol (-7.4 kcal/mol). The RMSD of cosmosiin, robinetin, and stigmastanol was 3.222 Å, 1.638 Å, and 0.951 Å respectively. Notably, all compounds exhibited robust hydrogen bonding with the conserved LYS B:171 except beta-sitosterol and allantoin (Fig. 5).
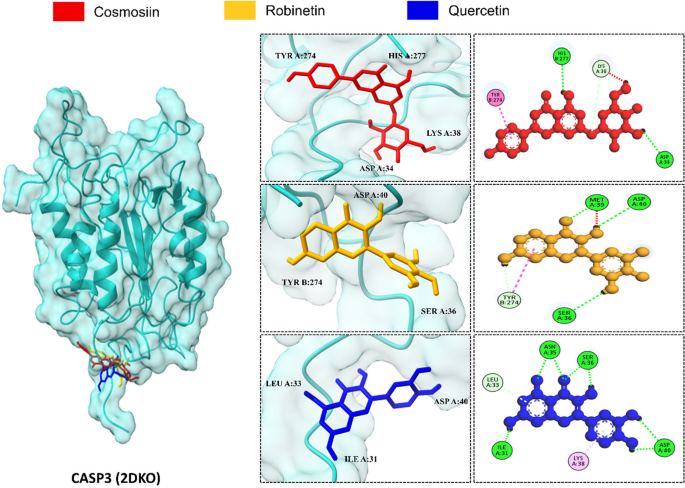
The protein 2DKO showed the strongest binding affinities with cosmosiin (-6.5 kcal/mol), robinetin (-6.2 kcal/mol), and quercetin (-6.1 kcal/mol). The root mean square deviation (RMSD) values for cosmosiin, robinetin, and quercetin were 1.243 Å, 2.172 Å, and 0.813 Å, respectively. Importantly, all compounds, except quercetin, allantoin, and gentisic acid formed strong hydrogen bonds with the conserved TYR B:274 (Fig. 6). Additionally, our findings suggested that understanding the interaction between this target is crucial for a comprehensive understanding of the functional mechanism of action of active constituents against malaria.
Molecular dynamic simulation analysis
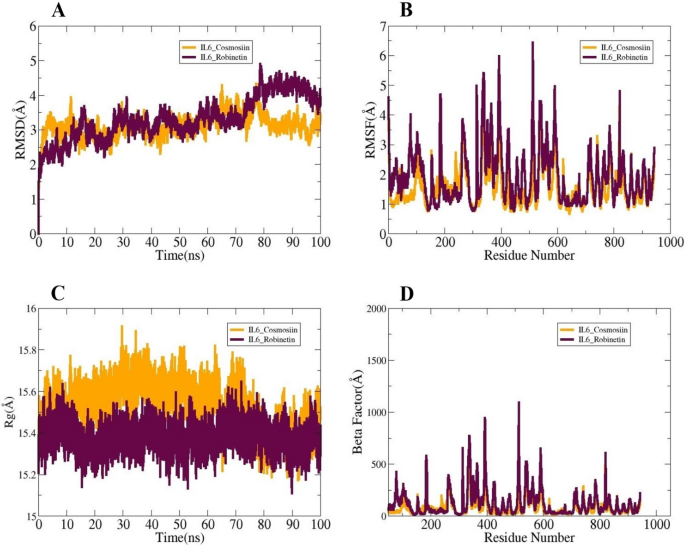
Molecular dynamic simulation studies are necessary to verify macromolecules’ dynamic behavior [34]. The radius of gyration (RoG) [52], root mean square fluctuation (RMSF) [35, 53], and root mean square deviation (RMSD) [53] are all included in the simulations analysis. The carbon alpha atom of the complexes served as the reference for these investigations. The studies aimed to assess the persistence and stability of interactions between the ligand and receptor during the simulation. The accurate delivery of the ligand to the IL6 target protein hinges on stable receptor-ligand interactions. Initially, no significant structural alterations were observed, as indicated by the consistent RMSD plots of the systems. The highest RMSD values of the systems reached up to 3 Å, with mean values for IL6_Cosmosiin and IL6_Robinetin calculated at 3.11 Å and 3.31 Å, respectively, and maximum values were 4.32 Å and 4.89 Å, respectively (Fig. 7A). Secondly, RMSF was computed to reveal details about the flexibility of receptor residues in the presence of the ligand molecule (Fig. 7B). Most system residues exhibited average stability (< 5 Å). The RMSF values for IL6_Cosmosiin and IL6_Robinetin showed maximum values of 5.68 Å and 6.44 Å, mean values of 1.57 Å and 1.93 Å, and minimum values of 0.66 Å and 0.77 Å, respectively. Radius of Gyration (RoG) analysis was used to assess system compactness over time. Increased flexibility in certain residues was attributed to internal loop dynamics within the system, but did not affect ligand binding to the receptors. RoG values indicated maximum values of 15.91 Å and 15.64 Å, mean values of 15.52 Å and 15.37 Å, and minimum values of 15.17 Å and 15.11 Å for IL6_Cosmosiin and IL6_Robinetin, respectively (Fig. 7C). At the end of the simulation, RMSD indicated that each system remained compact with no significant changes, except for IL6_Robinetin which exhibited some initial fluctuations that stabilized towards the end of the simulation. The following results were derived from the Beta Factor study: The mean values for IL6_Cosmosiin and IL6_Robinetin were 78.55 Å and 121.48 Å, respectively; the lowest values were 11.68 Å and 15.61 Å, while the maximum values were 851.67 Å and 1092.63 Å (Fig. 7D).
Solvent Accessible Surface Area (SASA) analysis
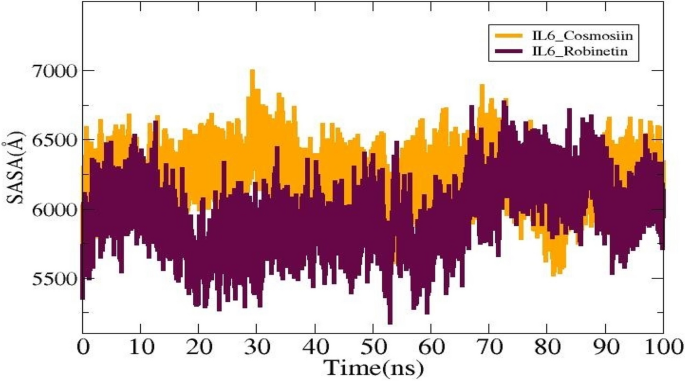
The SASA study was conducted for the ligands to investigate the surface area of IL6 that interacts with solvent molecules. The average values for the systems IL6_Cosmosiin and IL6_Robinetin are (6218.99 Ų), and (5954.6 Ų). The lowest SASA values for IL6_ Cosmosiin and IL6_ Robinetin were 5526.78 Ų and 5178.35Ų, respectively, as shown in (Fig. 8). The maximums were, respectively, 6994.07 Ų and 6773.17 Ų. Plots display the notable differences that are seen upon ligand binding.
MMPB/GBSA analysis
The chosen docked complexes were subjected to MMPB/GBSA analysis to investigate their binding affinity with the receptor protein. These techniques are generally considered more effective in assessing the interaction between the docked ligand and the receptor protein. It was observed that strong intermolecular interactions were formed, leading to stable complexes, as indicated by the highly negative net binding energies of all docked and control complexes. Among these interactions, the van der Waals force was found to be the strongest, contributing to ligand docking at the designated site and promoting system stability. Specifically, the IL6_Cosmosiin and IL6_Robinetin complexes exhibited net van der Waals energies of -62.48 kcal/mol and − 55.38 kcal/mol, respectively. Furthermore, a consistent electrostatic energy was observed in each docked complex. Among all the computed energies, solvation energy had the least favorable contribution to the net energy, with a negative value. In MM-GBSA, the IL6_Cosmosiin and IL6_Robinetin complexes showed net solvation energies of 10.39 kcal/mol and 8.67 kcal/mol, respectively. Conversely, in MM/PBSA, the net solvation energies of IL6_Cosmosiin and IL6_Robinetin were 9.67 kcal/mol and 8 kcal/mol, respectively. More detailed information on the energy terms and values can be found in Table 5.
Prediction and comparison with approved malaria drugs through machine learning
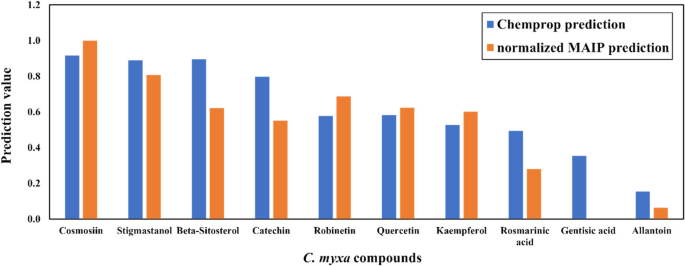
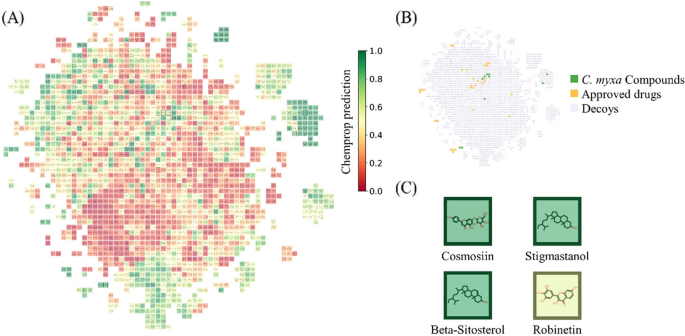
To evaluate the potential activities of our 10 screened compounds, we upload them to the MAIP platform obtain MAIP predictions, and predict them with our trained Chemprop model. Combining the predictions of the two models, we calculate the weighted score (Supplementary Information 2). To understand the similarity between our compounds and approved antimalaria drugs. 31 approved antimalaria drugs (Supplementary Information 3) were obtained from DrugBank [49]. To describe a larger drug similar chemical space, physically similar but topologically distinct, drug-dissimilar decoys were generated by DUD-E [54] based on the drugs. RDKit [55] was used to generate the Morgan fingerprint of compounds, then t-distributed stochastic neighbor embedding (t-SNE) [56] and a grid regularization using the Jonker-Volgenant (JV) algorithm were used to show the chemical space (Fig. 9). This process generates a grid of molecules where adjacent entries are highly similar, preserving the strongest relationships while allowing for greater embedding flexibility as similarity decreases.
As shown in Figs. 7 and 9 compounds out of 10 are predicted with both normalized MAIP and Chemprop predictions over 0.5, which indicates they are potentially active malaria inhibitors. Among them, Cosmosiin, Stigmastanol, Beta-Sitosterol, and Robinetin are still the top 5 compounds, which are consistent with the molecular docking results.
As shown in Fig. 10B, within this embedded chemical space which is primarily delineated by the drug-dissimilar decoys, some of our compounds tend to be surrounded by clusters of approved drugs. The qualitative observations suggest a high degree of structural similarity to antimalarial drugs. For further quantitative analysis, we used the Chemprop model to predict all the molecules and colored them with Chemprop predictions in the chemical space. If set 0.5 as the threshold to distinguish active and inactive, we found that about 3/4 of the approved drugs are predicted as active antimalaria molecules correctly, while about 2/3 of the decoys are inactive. As shown in Fig. 9A, molecules with similar colors tend to cluster together and borders between the clusters can be roughly distinguished, which indicates that the Chemprop model probably learns from molecule structures and the predictions are highly related to the structure similarity. Besides, we can see that the 4 screened compounds are all predicted with relatively high Chemprop predictions, which implies their potential antimalaria activity (Fig. 10C).
Visualization of the chemical space of approved drugs, generated decoys, and compounds from C. myxa. A t-SNE embedding with JV regularization of the 1935 molecules in total. Compounds are highlighted with a dark border. Colorization is the Chemprop prediction. B The same chemical space map but colored by the source of the molecules. C The C. myxa compounds were screened out by network pharmacology-based predictions, colored with Chemprop prediction


Add Comment