An average of 2,176,866 molecules were run per sample for Bionano optical mapping with a total length of 518,777 Mb across all molecules, and an average length of 241.14 kb, N50 of 233.39 kb, and a label density of 16.44/100 kb per sample, resulting in an average coverage of 167.98X (Table 1a). The Nanopore sequencing runs generated an average of 8,146,189 reads, a mean phred score of 14.5, a mean read length of 10.70 kb, N50 of 15.41 kb, and an average coverage of 29.89X (Table 1b).
After applying filtering steps (e.g. confidence scores, the GRCh38 SV mask filter, VAF, polymorphisms (i.e., those that appeared in > 1% of an internal OGM control database; n > 800), AOH/LOH) all SVs detected in the cell lines were annotated. Unfiltered SVs for all lines are reported in Supplementary Tables 1–8. SVs detected with long-read data around the pathogenic variants in SNCA or PRKN are also reported in Supplementary Tables 9–13. An overview of the workflow is illustrated in Fig. 1.
SNCA gene pathogenic variants (SFC831-03-05, SFC827-03-02)
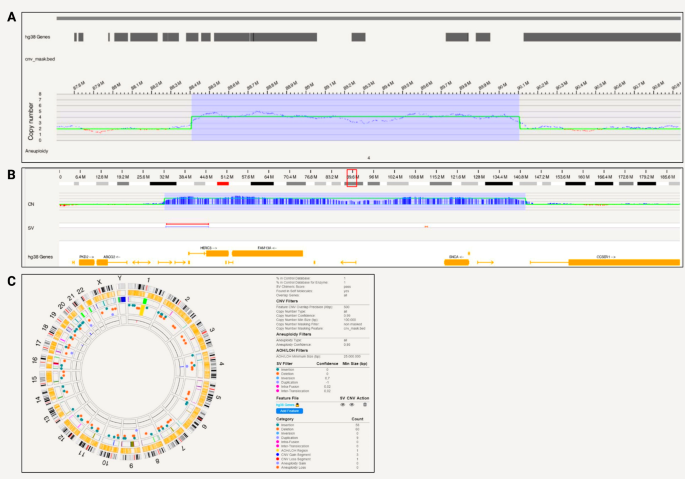
Bionano optical mapping revealed a triplication in iPSC line SFC831-03-05 spanning 1,696,488 bp that encompasses SNCA (Fig. 2a). The triplication is on chromosome 4 at positions 88,407,893 − 90,104,381 (hg38) and includes genes HERC6, HERC5, PIGY, PYURF, PIGY-DT, HERC3, NAP1L5, FAM13A-AS1, FAM13A, TIGD2, GPRIN3, SNCA, SNCA-AS1, MMRN1 (Fig. 2b). In terms of chromosomal abnormalities, no large inter- or intra-chromosomal translocations or gene fusions were detected, and no aneuploidy gain or loss found. Fifty-eight insertions and 60 deletions, one region of absence of heterozygosity, 9 duplications, 3 CNV gains and 1 loss were present and shown in the circos plot (Fig. 2c). Based on internally run Bionano samples to estimate the frequencies of these SVs, and annotation of pathogenicity with databases, no variants other than the triplication were considered pathogenic for PD.
SNCA triplication detected with Bionano in a patient-derived iPSC line. A) A triplication spanning 1,696,488 bp that encompasses SNCA; B) Location of the triplication on chromosome 4 at 88,407,893 − 90,104,381 (hg38) that includes genes HERC6, HERC5, PIGY, PYURF, PIGY-DT, HERC3, NAP1L5, FAM13A-AS1, FAM13A, TIGD2, GPRIN3, SNCA, SNCA-AS1, MMRN1; C) Circos plot showing structural variants detected after filtering
From the long-read sequencing data, we obtained N50 = 9.8 kb and a mean base-calling phred-score of 16.3. From the Nanopore long-read sequencing data, Sniffles did not detect a triplication in the region of interest with a size of ~ 1.7 Mb. However, multiple CNVs with sizes of 37–149 Mb were detected that span the region of interest (Supplementary Table 9). Attempts to refine by adjusting the Sniffles parameters and utilizing the NGMLR alignment tool did not offer additional insights, and the exact triplication was not found. Still, a visible increase in the coverage was observed at the expected triplication when the alignment was visualized with the Integrative Genomics Viewer (Supplementary Fig. 2).
A 313,859 bp long duplication that encompasses SNCA, spanning positions 89,678,642 − 89,992,501 on chromosome 4 was detected in SFC827-03-02 with Bionano optical mapping (Fig. 3a). The region included genes SNCA, SNCA-AS1, and MMRN1 (Fig. 3b). In terms of chromosomal abnormalities, no large inter or intra-chromosomal translocations or gene fusions were detected, and no aneuploidy gain or loss found. Fifty-four insertions and 54 deletions, 2 inversions, 7 duplications, 8 CNV gains and 3 losses were present and shown in the circos plot (Fig. 3c). Based on internally run Bionano samples to estimate the frequencies of these SVs, and annotation of pathogenicity with databases, no variants other than the duplication was considered pathogenic for PD.
SNCA duplication detected with Bionano in a patient-derived iPSC line. A) A 313,859 bp long duplication that encompasses SNCA, spanning positions 89,678,642 − 89,992,501 on chromosome 4; B) Location of the triplication on chromosome 4 at 85388502–89998264 (hg38) that includes genes SNCA, SNCA-AS1, MMRN1; C) Circos plot showing structural variants detected after filtering
From the long-read sequencing data, we obtained N50 = 18.67 kb and a mean base-calling phred-score of 12.2. Nanopore long-read sequencing did not detect a duplication of the size ~ 0.3 Mb in the region of interest with the Sniffles variant caller. However, when aligning only to the region of the expected duplication (chr4:87,678,642 − 91,992,501), other duplications with sizes of 0.6–2.7 Mb were detected that span the expected duplication (Supplementary Table 10). Similar to the triplication, adjusting the Sniffles parameter (i.e. coverage) and utilizing the NGMLR alignment tool did not offer additional insights, and the exact duplication was not found. Still, a visible increase in the coverage was observed at the expected duplication when the alignment was visualized with the Integrative Genomics Viewer (Supplementary Fig. 2).
PRKN pathogenic variants (iPS-L-3034, iPS-L-3244 and iPS-L-10312)
Within PRKN, a compound heterozygous exon 2 and exon 3–5 deletion was captured with phase on the Bionano for one patient iPSC cell line (iPS-L-3034) (Fig. 4a). The PRKN exon 2 deletion starts at position 162,338,358 and ends at 162,450,583, whereas the PRKN exon 3–5 deletion starts at 162,029,361 and ends at 162,279,161.
PRKN compound heterozygous variants detected with Bionano in iPSCs and the parental fibroblast. A) The compound heterozygous exon 2 and exon 3–5 deletion was captured with phase. The PRKN exon 2 deletion starts at position 162,338,358 and ends at 162,450,583, the PRKN exon 3–5 deletion starts at 162,029,361 and ends at 162,279,161 and partially overlaps with PACRG; B) Circos plot showing a translocation and other structural variants detected after filtering in the iPSC line from patient iPS-L-3034; C) Circos plot without the translocation present and structural variants detected after filtering in the parental fibroblast line L-3034
Multiplex-ligation-dependent probe amplification (MLPA) technique alone was unable to phase the deletions (data not shown). In terms of chromosomal abnormalities of the iPSCs, no gene fusions, no aneuploidy but two inter-chromosomal translocations were detected (Fig. 4b). The balanced translocations were not identified by routine single nucleotide variant karyotyping alone (data not shown). Forty-eight insertions and 73 deletions, 8 duplications, 2 inversions, 0 CNV gains and 3 losses were present and shown in the circos plot (Fig. 4b). In light of these findings that include a larger SV, we optically mapped the original fibroblast line, however, did not observe inter-chromosomal translocation in the line. There were no gene fusions and no aneuploidy, but we detected 47 insertions and 61 deletions, 9 duplications and 2 inversions, 1 CNV gain and 1 loss (Fig. 4c). In comparison to the iPSC line, different genetic variants were present in the fibroblasts (Supplementary Tables 3 and 6). In the unfiltered analysis, there were a total of 7596 SVs, 2617 deletions, 4648 insertions in the iPSC line compared to 7804 total SVs, 2673 deletions and 4746 insertions in the fibroblast lines. After filtering for a high-quality score (Q > 20) and rare variants (MAF < 0.01), there were no variants present in both lines.
To assess the quality of the two different biomaterials (iPSC and fibroblast) from the same patient (L-3034), we compared the molecule report for the Bionano run. The detailed molecule report showed a total number of 1,216,144 molecules for the iPSC line compared to 1,833,639 for the fibroblast culture and a total length of 312,589.23 Mb and 442,215.53 Mb, respectively. The average length of the iPSC line was 257.03 kb compared to 241.17 kb in the fibroblast culture. N50 of 239.63 kb for the iPSC and 237.37 kb for the fibroblast culture was achieved. Label density per 100 kb for the iPSC line was 16.84 resulting in a reference coverage of 101.22X compared to 14.55 per 100 kb for the fibroblast culture with a coverage for the reference of 143.19X.
From the long-read sequencing data, we obtained N50 = 12.55 kb and a mean base-calling phred-score of 15.7. Long-read sequencing was performed for the iPSC line, and the exon 2 deletion was confirmed. The sequencing revealed the deletion of exon 2 at position 162,336,451 − 162,448,855. Unfortunately, the exon 3–5 deletion was not found with long-reads when using the default Sniffles variant calling parameters. However, when adjusting parameters to counteract coverage changes within the large deletion, we detected both PRKN deletions, including the exon 3–5 deletion at position 162,029,842 − 162,280,393 (Supplementary Table 11). Additionally, the deletions were visible when assessing the alignment with the Integrative Genomics Viewer (Supplementary Fig. 3).
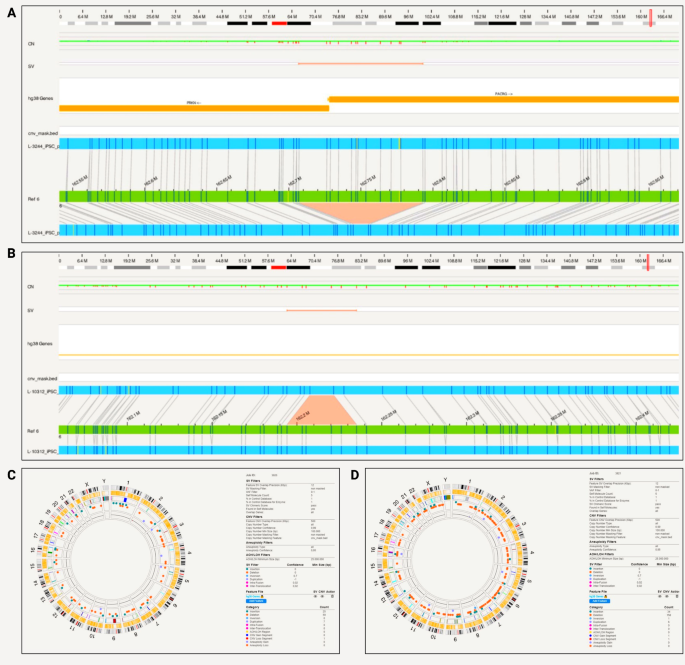
Furthermore, optical mapping detected PRKN deletions in exon 1 and exon 4 of the iPSC lines iPS-L-3244 and iPS-L-10312 (Fig. 5a and b). The PRKN exon 1 deletion starts at position 162,716,506 and ends at 162,792,085 and partially overlaps with PACRG. In this line, no large inter- or intra-chromosomal translocations or gene fusions were detected, and no aneuploidy gain or loss found. Twenty-five insertions and 59 deletions, 7 duplications, and one CNV loss were present and shown in a circos plot (Fig. 5c). From the long-read sequencing data, we obtained N50 = 22.58 kb and a mean base-calling phred-score = 12.2. Long-read sequencing data confirmed the PRKN exon 1 deletion at position 162,710,325 − 162,786,071 (Supplementary Table 12). Additionally, the deletion was visible when assessing the alignment with the Integrative Genomics Viewer (Supplementary Fig. 3).
PRKN compound heterozygous variants detected with Bionano in iPSCs. A) A patient-derived iPSC line (iPS-L-3244) with PRKN exon 1 deletion. PRKN exon 1 deletion starts at position 162,716,506 and ends at 162,792,085 and partially overlaps with PACRG.; B) A patient-derived iPSC line (iPS-L-10312) with PRKN exon 4 deletion. PRKN exon 4 deletion starts at position 162,198,660 and ends at 162,225,645; C) Circos plot showing structural variants detected after filtering in iPS-L-3244; D) Circos plot with structural variants detected after filtering in iPS-L-10312
In the third PRKN-mutant line (iPS-L-10312), the PRKN exon 4 deletion starts at position 162,198,660 and ends at 162,225,645. No large inter- or intra-chromosomal translocations or gene fusions were detected, and no aneuploidy gain or loss was found. We detected 34 insertions and 158 deletions, 1 inversion, 6 duplications, 1 CNV gain and 1 loss which are shown in the circos plot (Fig. 5d). From the long-read sequencing data, we obtained N50 = 13.41 kb and a mean base-calling phred-score of 16.0. Long-read sequencing data confirmed the PRKN exon 4 deletion (Supplementary Table 13). The deletion with a size of 27,092 bp was called with Sniffles and starts at position 162,200,764 and ends at 162,227,856. Additionally, the deletion was visible when assessing the alignment with the Integrative Genomics Viewer (Supplementary Fig. 3).
Control iPSC lines (SFC065-03-03, SFC163-03-01)
To assess generally detected SVs in cell lines not related to PD, we performed OGM on two iPSC lines from healthy control individuals. In control line SFC065-03-03, no large inter or intra-chromosomal translocations or gene fusions were detected, and no aneuploidy gain or loss was found. Sixty-four insertions and 54 deletions, 3 inversions, 21 duplications, 10 CNV gain, and 1 loss were present. In the other control line, SFC163-03-01, no large inter or intra-chromosomal translocations or gene fusions were detected, and no aneuploidy gain or loss was found. We detected 59 insertions and 48 deletions, 2 inversions, 22 duplications, 1 CNV gain and 5 loss. These numbers were comparable to what we have observed in the patient iPSC lines (Supplementary Tables 7–8).


Add Comment