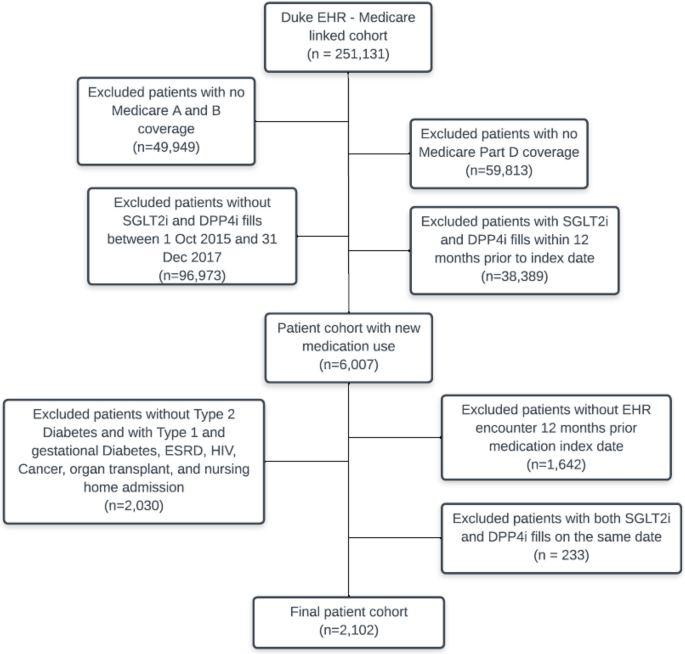
We identified 2,102 eligible patients who initiated an SLGT2i medication (n = 387) or DPP-4i medication (n = 1,715) (Fig. 1). The distribution of baseline characteristics showed that SLGT2i initiators were younger, more likely to be male, and have fewer comorbidities (see Additional File 1 Section B). Most patients (94.6% and 91.5% of the SLGT2i and DPP-4i groups, respectively) were censored. The mean (SE) follow-up time was 267 (116) days and 282 (107) days in the SLGT2i and DPP‐4i group, respectively. The median (IQR) follow-up time was 339 (192, 354) days and 343 (229, 354) days in the SLGT2i and DPP‐4i group, respectively. The crude MACE incidence rates were 88.2 and 134.7 events/1,000 person-years, respectively. Observed events and person-years in the SLGT2i and DPP-4i group were: SGLT2i group: 25 events during 283.4 person-years; DPP-4i group: 179 events during 1,328.9 person-years.
SMDI descriptive functions
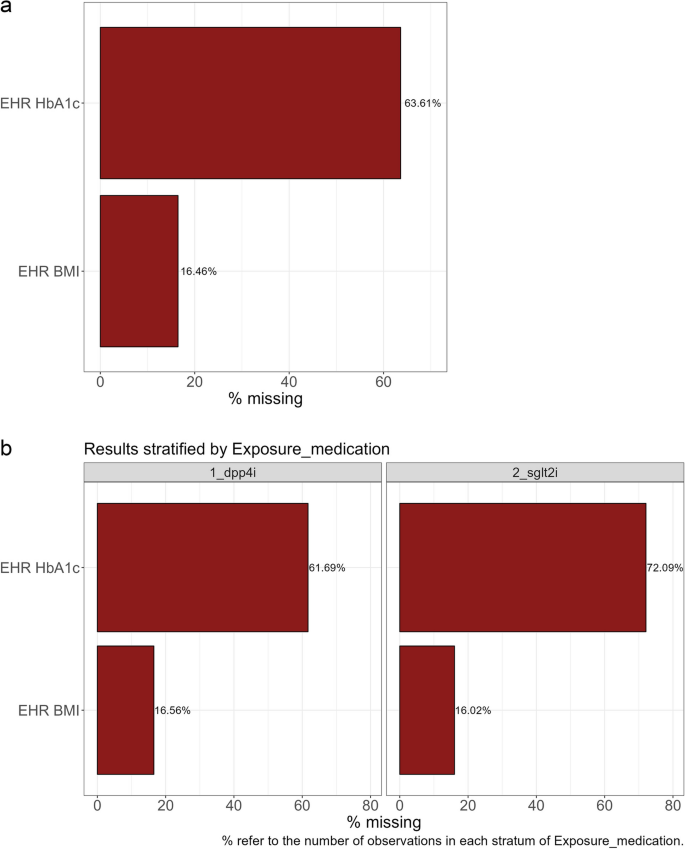
The three descriptive functions identified that HbA1c and BMI were covariates with at least one missing value, created a binary missing indicator variable for each, and output a summary of these values. We observed that HbA1c was missing in 64% of study participants (72% in SGLT2i group compared to 62% in the DPP-4i group). For BMI, overall, 16% of participants were missing values, and this was similar between exposure groups (Fig. 2, see Additional File 1 Section C for SMDI commands).
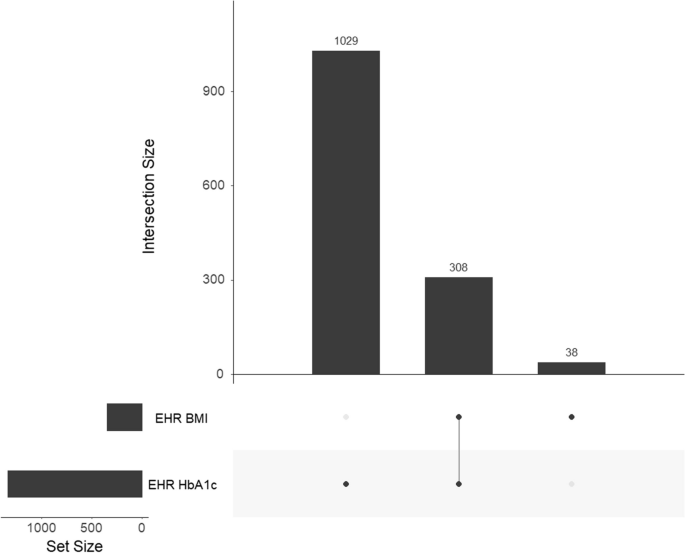
The gg_miss_upset function enabled us to assess the intersection of missingness across variables. A monotone missingness pattern is when missingness in one variable is associated with missingness in another variable. For instance, since height and weight are usually assessed simultaneously, it is highly likely that weight will be missing when height is missing. In our empirical case example, of study participants who were missing at least one value (n = 1,375, 65.4%), about 22.4% (308/1,375) were missing both HbA1c and BMI (Fig. 3). Since monotonicity was not observed, we proceeded to apply the SMDI to a dataset that included both partially observed covariates. In situations where monotonicity is observed, researchers may choose to assess each partially observed covariate separately to avoid distorted values in the missingness diagnostic tests.
SMDI descriptive functions – BMI and HbA1c missingness. The gg_miss_upset and md.pattern functions examine the possibility of monotonicity in the missingness patterns between variables. As missingness patterns across variables exhibit more monotonicity, covariates that exhibit a monotone pattern may result in inflated AUC values in Group 2 diagnostic tests. In situations where missingness of one covariate may perfectly predict missingness in another covariate, researchers should apply the missingness diagnostics for each partially observed covariate independently. The exception is Little’s test, which is intended to be used when there are multiple partially observed covariates
Missingness diagnostic tests
We used the SMDI toolkit to assess both covariates of interest simultaneously. The smdi_diagnose runs all of the missingness diagnostic functions and produces a summary table with the most important test results for each partially observed confounder in a single table (Table 2).
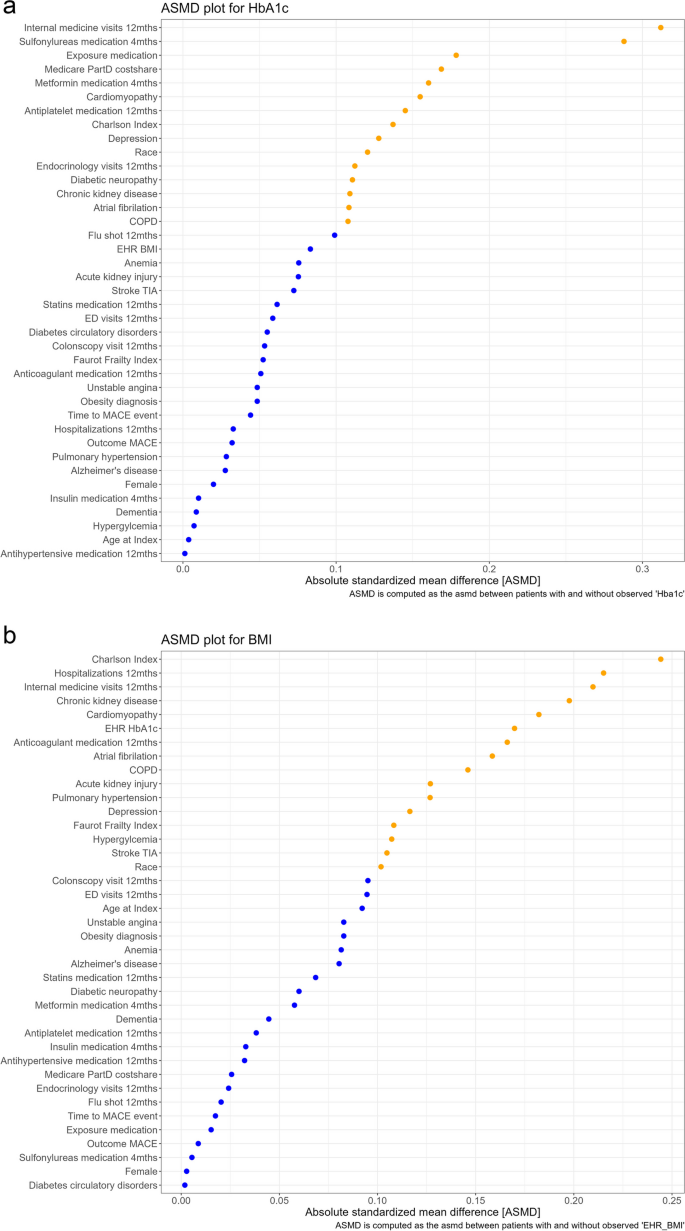
Group 1 diagnostic tests aim to quantify differences in the distribution of covariates between the populations who are and are not missing values for the partially observed covariate(s). The absolute standardized mean differences (ASMD) for all the covariates are summarized in two ways, the ASMD median (with a min and max) as well as visually in a plot of the value for individual covariates from smallest to largest. Values below and over 0.1 are identified by color and those under 0.1 indicate a small difference between the prevalence or mean of the covariate [29]. The median (max, min) ASMD for HbA1c was 0.072 (0.001, 0.312). The plots of the individual covariate ASMD values, showed that about 60% of the values were under the 0.1 threshold [29]. Of those that were over 0.1, all but two covariate values were under 0.2. Two ASMD values were close to 0.3 (total internal medication visits, and use of sulfonylureas medication). For BMI, the pattern was similar; median (max, min) ASMD for BMI was 0.092 (0.002, 0.244), about 40% of the ASMD values were under 0.1, the remainder had ASMD values between 0.1 and 0.2, and three values were between 0.2 and 0.25 with the highest value observed for Charlson comorbidity score (Fig. 4). The SMDI_asmd function also produces a table that indicates direction and magnitude of the univariate differences (see Additional File 1 Section D). We were able to observe that those with an HbA1c value had a higher mean number of internal medicine visits than those without an HbA1c value.
Group 1 diagnostic tests also include Hotelling’s multivariate t-test/Little’s chi-square test for differences between the covariate distribution between groups with and without a value for the partially observed covariate. In our empirical case example tests for both covariates had a p value < 0.001 which indicates significant differences in the distribution of observed baseline characteristics.
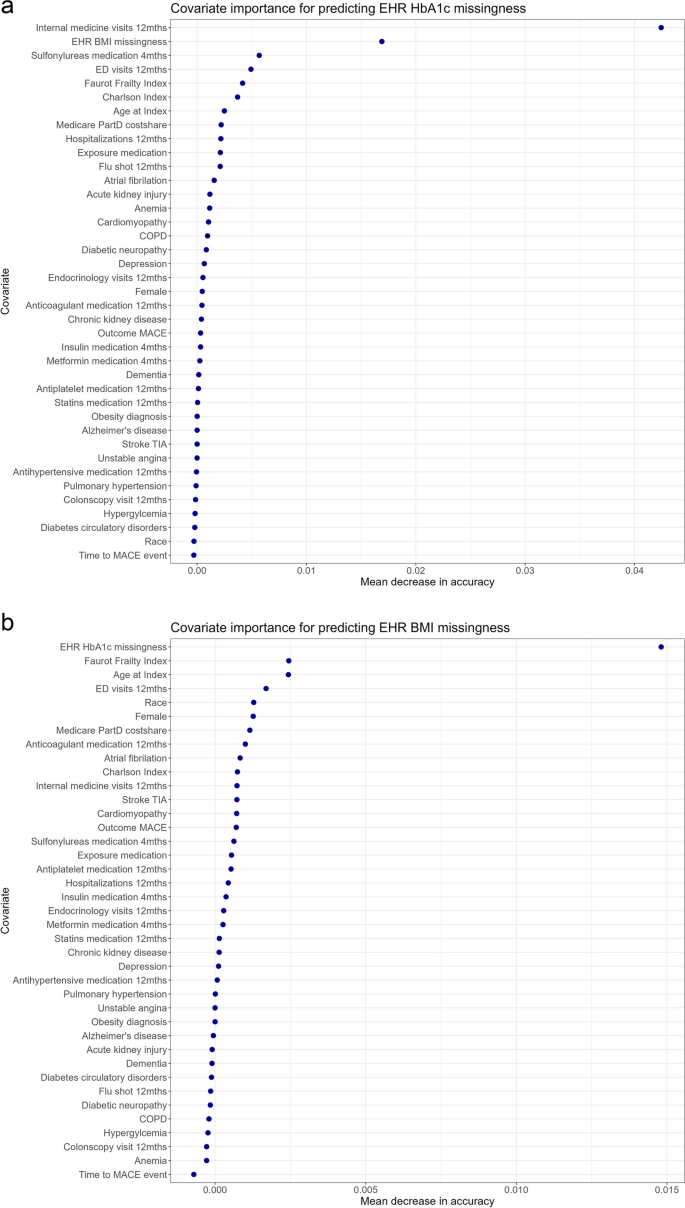
The Group 2 diagnostic assesses the ability of the dataset variables to predict missingness. Smdi_rf trains and fits a random forest model to assess the ability to predict missingness based on the observed covariates and produced an AUC value for each partially observed covariate (0.51 for BMI and 0.64 for HbA1c). The covariate importance plots show the mean decrease in accuracy for each covariate (i.e., the degree to which the accuracy of the prediction [# of correct predictions/total # of predictions made] would decrease, had we left out this specific predictor). For HbA1c, the plot indicated that BMI missingness and total internal medicine visits in the past year were most important for predicting HbA1c missingness. Results for BMI indicate that the highest values in mean decrease in accuracy were low (< 0.015), meaning that none of the variables were particularly important for predicting missingness (Fig. 5).
The Group 3 diagnostic examined the crude and adjusted association between the missingness of the partially observed covariate and the outcome under study. In our empirical case example, the Group 3 diagnostic results for HbA1c and BMI yielded unadjusted and adjusted estimates close to the null value, with CIs that included the null.
Interpreting SMDI results to inform analytic decision-making
Each test in Group 1 was able to provide some evidence about the underlying missingness mechanism (Table 3) [16]. The mean ASMD for both partially observed covariates was < 0.1 (evidence that supports MCAR); however, the plot of individual covariate ASMDs showed that many variables had an ASMD greater than 0.1, and the Little’s test p-value was low (both pieces of evidence against MCAR).
In general, it is important to note that the Hotelling’s/Little’s test results (i.e., rejection of the null hypothesis that the missingness mechanism is MCAR) are sensitive to small differences that may not be apparent in the ASMD mean value and assumptions about the underlying data. Though we found the ASMD mean to be under 0.1, evidence from the ASMD plot can indicate the extent to which other covariates could be used to recover some of the missingness. In other words, strong evidence against MAR would entail observing an ASMD median below 0.1 and few, if any, variables with an individual ASMD > 0.1. Group 1 diagnostic results should be interpreted in the context of both ASMD and Hotelling/Little’s statistics, and MCAR or MNAR considered only when Group 1 results contain little to no evidence to the contrary. Collectively, these results provided evidence against MCAR for both partially observed covariates and indicated that existing covariates have information that may be leveraged to inform missingness mitigation techniques.
Group 2 diagnostics consist of a single test that yields AUC values that range from 0.5 to 1.0. A value of 0.5 indicates a complete lack of ability to predict missingness, and higher values indicate stronger relationships between covariates and missingness. In our empirical case example, the AUC for BMI was 0.51, and the low mean decreases in accuracy values of even the strongest predictors indicate that there likely are no informative covariates. These results for BMI align with the expected results for a MCAR or MNAR missingness mechanism (Table 3) [16]. In comparison to the maximum AUC values in a true simulated MAR mechanism (~ 0.59) [16], the observed AUC of 0.64 for HbA1c indicates strong evidence for MAR and against MCAR/MNAR. The relatively higher covariate importance of two variables; BMI missingness, and total internal medicine visits also support this mechanism. This may align with a possible clinical explanation, in that a higher frequency of internal medicine visits and missingness of BMI could reflect a more intensive treatment regimen where HbA1c is more likely to be measured regularly. Since a few observed covariates are able to predict missingness relatively well, we interpret that the underlying missingness mechanism for HbA1c may be missing at random (MAR).
The Group 3 diagnostic examines the association between the missingness of the partially observed covariate and the outcome under study and produces a crude and adjusted LogHR. In general, examining the resulting values and observing the differences between both the point estimates and the confidence interval provides evidence for various missingness mechanisms. For example, no apparent association in either the crude or adjusted setting provides evidence for MCAR, as the missingness without or with the observed covariates is not associated with the outcome. If the association is present in the crude model but not the adjusted, this indicated that observed covariates may have a MAR missingness pattern. If an association remains after adjustment, i.e., the association between missingness and the outcome cannot be explained by observed covariates, this may be indicative of an MNAR mechanism. It is important to note that only the Group 3 results can distinguish between MCAR and MNAR.
In our empirical case example, for both HbA1c and BMI, the unadjusted and adjusted estimates were close to zero before and after adjustment, providing some evidence for MCAR. In our prior simulation study, we consistently observed that under MNAR or MAR mechanisms, the Group 3 diagnostics resulted in crude estimates indicating an association with the outcome, which was not observed in our study. We note, however, that confidence intervals in both results included the null value.
In summary, results of the SMDI (in particular the Little’s/Hotelling test p value < 0.05 and the relatively high AUC) was able to provide evidence that the missingness mechanism of the HbA1c was likely MAR. Therefore, for HbA1c, we have the ability to use the distribution of measured covariates to improve imputation of missing values. The SMDI results for BMI indicated a MCAR mechanism (ASMD < 0.1 and AUC ~ 0.5). However, the ASMD plot and Hotelling/Little’s test results indicates that we could also, to a lesser extent, leverage observed variables to better impute missing data.
Use case example results
The crude hazard ratio comparing the two groups was 0.64 (95%CI: 0.43, 0.98). The hazard ratio adjusting for all covariates except the partially observed EHR covariates was 0.91 (95%CI: 0.58, 1.41, n = 2,102). Adjusting for demographic and clinical characteristics (which executed a complete case analysis, deleting 1375 observations due to missingness in EHR covariates of interest), showed a marked but uncertain reduction in MACE events for SLGT2i medication initiators compared to DPP-4i initiators (Hazard Ratio (HR):0.50 [95%CI:0.16, 1.60], n = 737). Using the MICE random forest approach to missingness mitigation yielded a HR of 0.90 (95%CI: 0.58–1.41, n = 2,102).


Add Comment