
Study design and population
We conducted a secondary analysis of a single center randomized clinical trial testing a lung and diaphragm protective ventilation strategy (REDVent, R01HL124666, Clinicaltrials: NCT03266016) at Children’s Hospital of Los Angeles (CHLA). The study was approved by the CHLA Institutional Review Board. Children and young adults between 1 month and 21 years of age were included in the parent study when they met hypoxemia and radiographic criteria for PARDS. Exclusion criteria comprised contraindications to an esophageal catheter or conditions precluding conventional weaning (i.e. elevated intracranial pressure, pulmonary hypertension, critical airway, do not resuscitate). The complete protocol for the REDVent parent study has been previously published [18, 19].
Patients received synchronized intermittent mandatory ventilation Pressure Control/Pressure Support (SIMV PC/PS) or Pressure Support/continuous positive airway pressure (CPAP) mode of ventilation using cuffed endotracheal or cuffed tracheostomy tubes connected to an ICU ventilator (Servo I (Maquet, Solna, Sweden), NKV-550 (OrangeMed, Santa Ana, CA), or AVEA (CareFusion, Yorba Linda, CA)). Physiologic waveforms of PES, flow, and airway pressure (PAW) were recorded daily. Each day the patient remained intubated, a target of 3 inspiratory and 3 expiratory hold maneuvers were performed most typically in the morning between 8 and 11 am. PAW and flow were measured proximally at the endotracheal tube along with an airway pressure line and self-calibrating pneumotachometer (Viasys Variflex 51,000–40094; Conshohocken, PA). PES was measured using an age appropriate esophageal balloon catheter (Carefusion, Avea SmartCath 6, 7, or 8 Fr) with air inflated based on a calibration algorithm [20]. All sensors were connected to a custom-made hardware device (New Life Box, Applied Biosignals, Weener, Germany), which recorded data at a frequency of 200 Hz. Offline analyses were processed with a custom-built software program for breath annotation (R Core Team, Vienna, Austria).
Patient days were not included in analysis if the ventilation mode was CPAP without pressure support or high frequency oscillation, and if PES or PAW waveforms were inadequate because of artifacts or inaccurate esophageal catheter position (confirmed on chest X-ray, or suspected by an end-expiratory PES (PES-PEEP) value either too high (> 20 cmH2O) or too low (< 5 cmH2O), with a difference > 3 cmH2O as compared to other days, and a failed occlusion test). We have previously found that plateau pressure measurements on the AVEA ventilator are inaccurate when patients have respiratory effort [13]. Patient days were therefore excluded from analysis if the subject was ventilated with an AVEA.
Measurements
Two investigators (Inter-rater reliability checked using a subset of 10 patient days with kappa statistics > 0.8) measured effort and drive variables during a maximum of three of each of the following recorded breath types for each patient day: inspiratory hold (Pressure Control (PC) hold or Pressure support (PS) hold), expiratory hold, PC breath, and PS breath. Inspiratory and expiratory hold breaths were excluded with air leak above 20% and/or artifact, and inspiratory holds required a clear plateau phase for inclusion. For each measurement, the median of available inspiratory and expiratory holds per day was used for analysis. P0.1 was measured during the spontaneous expiratory holds as previously described [13]. Respiratory effort was measured in patient-triggered breaths (PC or PS) using the inspiratory esophageal pressure swing (∆PES-REAL), which corresponds to the absolute difference between the PES at the end of expiration and the minimal PES reached during inspiration [11, 12, 21] (Additional file 1: Figure E1). We also computed the estimated respiratory effort from the P0.1 value (∆PES-PRED) using our previously published equation: ∆PES-PRED = 5.91*P0.1 [13].
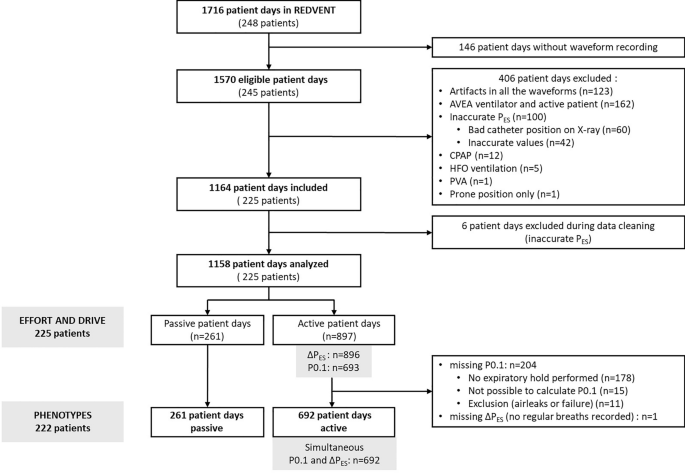
Flow chart. P0.1, Airway occlusion pressure in the 100 ms; PAW, airway pressure; ∆PES, esophageal pressure swings during inspiration; CPAP, Continuous positive airway pressure; HFO, High frequency oscillation; PVA, Patient-ventilator asynchronies.
Phenotypes definition
Six different phenotypes were defined by cross-referencing the values of ∆PES-REAL and ∆PES-PRED (Additional file 1: Figure E2). We chose “clinically relevant” thresholds to define mismatch between ∆PES-REAL and ∆PES-PRED: if ∆PES-REAL was above 10 cmH2O, mismatch was defined when the percentage error between the absolute value of ∆PES-PRED and ∆PES-REAL was above 50%; if ∆PES-REAL was ≤ 10 cmH2O, mismatch was defined by an absolute difference of at least 5 cmH2O between the two values. According to whether P0.1 (as a reflection of drive) was aligned or not with ∆PES (as a reflection of effort), we defined phenotypes as follows:
-
(i)
Low drive aligned with low effort: ∆PES-REA L < 5 cmH2O with absolute value of the difference between ∆PES-PRED and ∆PES-REAL ≤ 5 cmH2O
-
(ii)
Mismatch with overestimated effort: ∆PES-REAL < 10 cmH2O with a ∆PES-PRED at least 5 cmH2O greater than ∆PES-REAL
-
(iii)
Normal effort and drive: ∆PES-REAL 5–10 cmH2O with absolute value of the difference between ∆PES-PRED and ∆PES-REAL ≤ 5 cmH2O
-
(iv)
Mismatch with high underestimated effort: ∆PES-REAL ≥ 10 cmH2O with a ∆PES-PRED < 50% ∆PES-REAL
-
(v)
High drive aligned with high effort: ∆PES-REAL > 10 cmH2O with absolute value of percentage difference between ∆PES-PRED and ∆PES-REAL within 50%
-
(vi)
Passive patient: no evidence of spontaneous breathing on the esophageal pressure waveform (no evidence of negative deflection during inspiration).

Evolution of A respiratory effort (∆PES), B respiratory drive (P0.1), and C phenotypes over the course of ventilation. In each panel, the proportion of files (in %) in each category of effort, drive, or phenotype, is represented across ventilation days stratified into three categories: 0–2 days, 3–7 days, and after 7 days. The number of files in each timing is presented above the column. A Four categories of effort have been defined based on the values of the measured ∆PES (∆PES-REAL) (regular breaths) in each file: low (∆PES-REAL < 5cmH2O), normal (∆PES-REAL between 5 and 10 cmH2O) or high (∆PES-REAL > 10 cmH2O). Patient days without spontaneous breathing activity were defined as passive. B Four categories of drive have been defined based on the values of the measured P0.1 (spontaneous expiratory hold) in each file: low (P0.1 < 1cmH2O), normal (P0.1 between 1 and 3.5 cmH2O) or high (P0.1 > 3.5 cmH2O). Patient days without spontaneous breathing activity were defined as passive. C Six phenotypes have been defined by cross-referencing the values of ∆PES-REAL and predicted ∆PES (∆PES-PRED) based on P0.1 using ∆PES-PRED = 5.91*P0.1: Definition for phenotypes: passive (no evidence of PES deflection during inspiration), low drive aligned with low effort (∆PES-REAL < 5 cmH2O with absolute value of ∆PES-PRED and ∆PES-REAL ≤ 5 cmH2O), mismatch with overestimated effort (∆PES-REAL < 10 cmH2O with a ∆PES-PRED at least 5 cmH2O greater than ∆PES-REAL), normal effort and drive (∆PES-REAL 5–10 cmH2O with absolute value difference between ∆PES-PRED and ∆PES-REAL ≤ 5 cmH2O), mismatch with high underestimated effort (∆PES-REAL ≥ 10 cmH2O with a ∆PES-PRED < 50% ∆PES-REAL), high drive aligned with high effort (∆PES-REAL > 10 cmH2O with percentage error between ∆PES-PRED and ∆PES-REAL within 50%)
The two mismatch phenotypes were the subgroups of interest.
Analysis
Each patient day was classified into one of the 6 phenotypes above. Baseline characteristics as well as characteristics related to lung injury, ventilator settings, gas exchange, respiratory mechanics, and sedation, were described in the 6 phenotypes. In addition, we described the trajectory of effort, drive, and phenotypes for each patient day over the course of ventilation, using the thresholds of ∆PES-REAL described above to categorize the level of effort (passive, low effort, normal effort, and high effort), and the thresholds described in previous studies for respiratory drive (passive, low drive if P0.1 was ≤ 1 cmH2O, normal drive if P0.1 was between 1 and 3.5 cmH2O, high drive if P0.1 was > 3.5 cmH2O) [13, 14].
To investigate risk factors for the occurrence of each mismatch phenotype we created two mixed effects logistic regression models adjusted for repeated measures per patient, comparing each of the two to the other phenotypes where spontaneous breathing was present. Because it may be more harmful to miss high effort, our primary analysis focused on the risk factors for being in the high underestimated effort group as compared to others. Secondary analysis investigated risk factors for P0.1 overestimating effort as compared to others.
Variables of interest were described at the patient level and at the patient day level (see Additional file 2). Patient level factors included demographic data, co-morbid conditions and lung injury severity at randomization. Patient daily data included: calculated static respiratory mechanics (resistance (RRS), respiratory system compliance (CRS), chest wall compliance (CCW), lung compliance (CL), lung elastance (EL)/respiratory system elastance (ERS) ratio); respiratory drive (gas exchange and dead space markers, minute ventilation (VME), neural respiratory rate); ventilator settings; and data related to sedation drugs (cumulative opioid/benzodiazepine dosing per day) and pain, sedation, and delirium scales. We also investigated the relationship between neuromuscular weakness and phenotype B membership, using the maximum airway pressure during airway occlusion (PiMAX) (from the first spontaneous breathing trial) as a surrogate for respiratory muscle strength [5]. Data were presented as medians (Interquartile range, IQR) for continuous variables and number (%) for categorical variables.
Univariate modeling was first conducted for each variable, treating the patient as a random effect to account for repeated measures. Multivariable models considered two random effects, the patient, and the patient’s day of ventilation. Candidate variables (p < 0.15 in univariate analyses) which remained statistically different (p < 0.05) and/or changed the estimates of the others (cofounder) were kept in the final multivariable models, with careful attention to avoid collinearity. Detailed statistical analysis is provided in supplement (additional file 2). Data were analyzed using R programming software.
Add Comment