Clinical antibiotic susceptibility characteristics of K. pneumoniae isolates
The clinical profiles of the K. pneumoniae isolates, including data sample collection, sample type, age, and antimicrobial resistance phenotype, are shown in Table 1. Complete microbiological information was available for 92.8% (13/14) of the isolates, seven of these isolates were resistant to carbapenems. However, in silico genomic analysis revealed that only four of these isolates contained blaKPC. Antimicrobial susceptibility testing via MICs across 14 antibiotics showed that all isolates were resistant to ampicillin-sulbactam, ceftriaxone (100% each), and gentamicin (92%) (Supplementary Table 1). Moreover, the susceptibility of the three isolates to cefepime was dose dependent. Doripenem, cefotaxime, nitrofurantoin, and sulfamethoxazole were found to be effective against most of the isolates tested.
Molecular characteristics of K. pneumoniae clinical isolates
The genome size of the 14 K. pneumoniae isolates was 5.52 Mb with a GC content of 57.35% and a median N50 of 5,070,563 bp. Coding sequences were around 5.157, and approximately 68 tRNAs were identified. The sequencing depth ranged from 8 to 79X, with an average of 26.56X (Supplementary Table 4). Based on in silico typing and MLST, 8 different STs were identified among the isolates. The most common ST was ST45 (6/14), followed by ST629, ST307, and ST1774. Four loci variants were identified in STs (ST45-2LV from ST45, ST629-2LV, ST629-3LV from ST629, and ST13-2LV) (Supplementary Table 4). Capsular typing showed that K62 and K107 were identified in 9/14 of the isolates, with frequencies of five and four isolates, respectively, while K50 was identified in two isolates, and the remaining three isolates corresponded to K135, K160, and K3 types (Supplementary Fig. 1). Furthermore, we found that K62 is associated with a higher number of virulence genes.
Four O-loci, O3/O3a, O2afg, O2a, and O12, were identified in Ecuadorian isolates; the O2a locus was the most common (7/14), while the O12 locus was the least common (1/14). Among the isolates with the O2a locus, two had low confidence levels (Supplementary Table 5).
Functional annotation
Functional genome annotation using the COG and subsystem databases showed consistent results. For instance, the COG database predicted an average of 2,802 genes associated with subsystems, with isolate KPEC11K having the highest number of genes (2,954 genes) and isolate KPEC37K having the lowest number of genes (2,639 genes). The genes were mostly classified in the superclass associated with metabolism (41.85%), followed by energy (14.3%), membrane transport (8.9%), stress response (8,26%), and protein processing (8.24%) (Supplementary Fig. 2). The cofactor, vitamins, and prosthetic group (313 genes); amino acid metabolism (288 genes); carbohydrate metabolism (254 genes); energy and precursor metabolite generation (246 genes); membrane transport (250 genes); and stress response, defense, and virulence (232 genes) were the most representative classes (Supplementary Fig. 2, Supplementary Table 6, Supplementary Table 7).
Regarding subsystems, 393 structural complexes were identified, with an average classification for each isolate showing predominance in metabolism (34%), stress response, defense and virulence (12.3%), protein processing (12.1%), energy (10.1%), membrane transport (8.6%), cellular process (6.1%), DNA processing (5.2%) among others (experimental subsystem) (Supplementary Table 7).
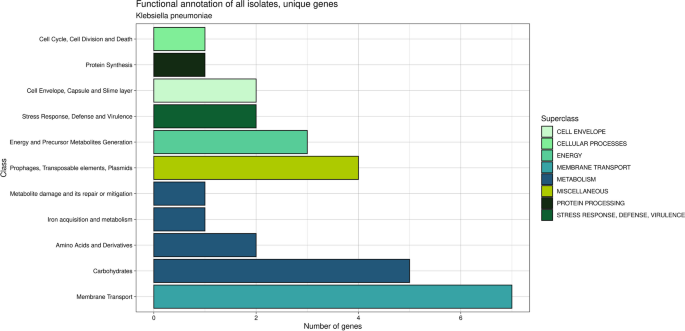
Genes that are specific to each isolate are of considerable interest because of their potential impact on the variability observed within these isolates. Through a functional annotation analysis, 29 unique genes were identified. These genes are associated with various biological functions, including metabolism (9 genes), membrane transport (7 genes), energy (3 genes), cell envelope (2 genes), stress response, defense and virulence (2 genes), cellular processes (1 gene), and protein processing (1 gene), as well as an additional category of miscellaneous genes related to P2-like phages, exclusive to the KPEC11K isolate (4 genes) (Fig. 1).
Comparative genomic analysis
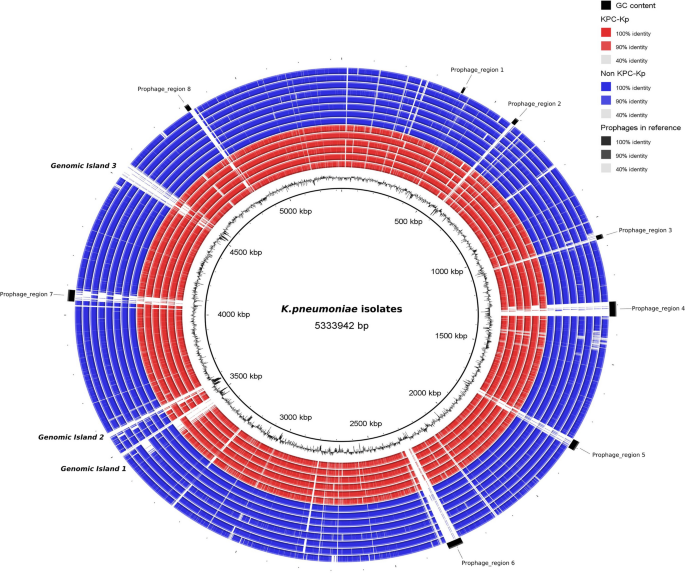
A circular genome map was produced to identify regions in the clinical isolates that differed from the KPC clinical isolate as the reference genome (HS11286, accession code NC_016845.1). Overall, the BRIG analysis highlighted that the regions covered in the isolates exhibited high genomic identity with the reference genome in terms of presence, but this did not encompass the additional genomic elements that may be unique to each isolate. The draft genomes of the clinical isolates are represented in a BRIG plot and plotted according to drug resistance. Concentric blue rings represent non-blaKPC isolates, whereas red rings represent blaKPC isolates (Fig. 2). Overall, BRIG showed > 99% identity in the coverage zones of the isolates. Most of the gaps in the circles represent prophage regions remaining in the reference genome that were absent from clinical isolates. Some of the phages identified were found within the Ecuadorian isolates with variable coverage, suggesting that these phages contribute to the observed genomic variability. The prophage with the highest average coverage was prophage 1 (Phage_Bacill-vB_Bts_BMBtp14) (98%), whereas prophages 2 (Phage_Entero_P4), 3 (Phage_Entero_P4), 4 (Phage_Edward_GF_2), 5 (Phage_Klebsi_ST512_KPC3phi13.2), 6 (Phage_Salmon_SEN34), 7 (Phage_Klebsi_ST147_VIM1phi7.1), and 8 (Phage_Salmon_ST64B) had coverages of 14.46%, 25.73%, 9.97%, 22.94%, 13.13%, 31.78%, and 38.1%, respectively; prophage 4 had the lowest average coverage (Supplementary Table 8). Nevertheless, it must be taken into consideration that PHASTER identified prophages 1, 3, and 8 as incomplete; prophages 4, 5, 6, and 7 as intact; and prophage 2 as questionable. In addition, three genomic islands were identified in the reference genome. The first, which extends from positions 3,433,545 to 3,495,693, is linked to the type IV secretion system and various virulence factors. Regarding key virulence loci, the presence of virulence-associated integrative conjugative element of K. pneumoniae variant 4—ICEKp4 and yersiniabactin cluster 10—ybt10 clusters were found within this island in the reference genome. Conversely, our results using Kleborate revealed the existence of ICEKp4, associated with the ybt10 cluster, at the identical genomic site as ICEKp3 in seven isolates characterized as blaKPC-negative and belonging to ST45 (6/7). Furthermore, an unknown ybt was found in a blaKPC-positive isolate (KPEC34K) with ST45-1LV. The second genomic island ranged between 3,555,090 and 3,607,401, encompassing genes encoding multidrug efflux pumps and metabolic enzymatic functions. The third genomic island, ranging from 4,502,849 to 4,545,387, predominantly harbors genes encoding hypothetical proteins, with some genes encoding phage integrase, transposase insertion sequence, DNA-binding prophage protein, and antirestriction protein (Supplementary Table 9). Remarkably, these two genomic islands were not present in the Ecuadorian isolates. In addition, comparison of Ecuadorian isolates with different reference genomes, showed variable distribution of gaps, some of these include prophage regions, suggesting a high genome plasticity of K. pneumoniae due to prophages (Supplementary Fig. 3).
Comparative genomic analysis of K. pneumoniae isolates using BLAST Ring Image Generator (BRIG). The blaKPC (red circles) and non-blaKPC (blue circles) isolates were compared to the reference K. pneumoniae HS11286 genome (inner black circle). The inner black section represents GC content. The inner circle represents the genome sequence of each sequenced strain. Black rectangles indicate prophages in the outer layer of the circles
Pangenomic analysis
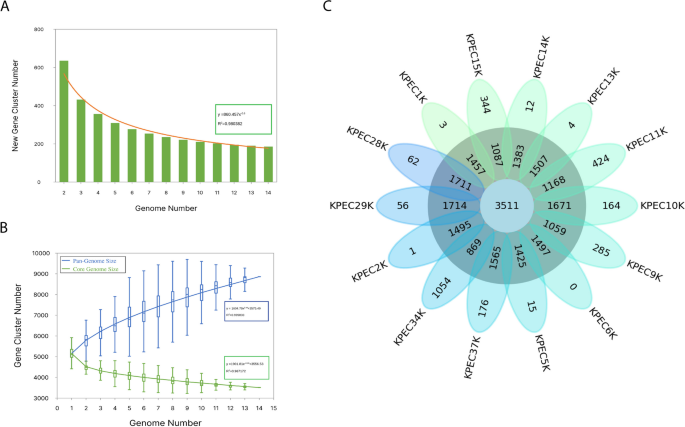
To determine the genome architecture and diversity, a pangenome analysis was performed on the 14 K. pneumoniae genomes assembled in this study. The analysis revealed that 8,860 gene families were associated with the pangenome and were distributed among 3,511 core genes, zero soft-core genes, 2,332 shell genes, and 3,017 cloud genes. For each strain, there was an average of 5,097 genes with a slightly different number of identified protein-coding genes, with a minimum of 4,994 genes found in the KPEC9K isolate and a maximum of 5,677 genes found in the KPEC34K isolate. It is crucial to approach unique genes with caution, particularly when considering the low coverage obtained for the KPEC34 isolate, because our isolates presented an average of 186 unique genes. Pangenome analysis revealed that 177 new genes were added to each genome (Fig. 3A, 3C), and the outline curve did not reach a plateau, with a power-law exponent of 0.44 (Fig. 3B), indicating an open pangenome and increased genetic diversity among these clinical isolates.
Pangenome and functional annotation of K. pneumoniae. A Bar graphs showing the number of new genes associated with an increase in the number of K. pneumoniae genomes. B Gene accumulation curves of the pangenome (blue) and the core genome (green). Blue and green boxes denote the K. pneumoniae pangenome and core size for each genomic comparison, respectively. C Flower plots showing the core, accessory, and strain-specific genes of 14 K. pneumoniae isolates. The flower plot shows the core gene number (in the center), accessory gene number (in the annulus), and strain-specific gene number (in the petals)
Overview of antibiotic resistance genes
A clustering analysis was performed considering the presence of genes related to antibiotic resistance, KPC, and virulence factors. The presence of three nonrandom groups and ten subgroups can be observed (SIMPROF p = 0.01 at 999 iterations): the first Group A (Group A, 1 isolate) corresponded to the KPEC34K isolate with the presence of blaKPC-3, while the second group registered a greater presence of genes related to virulence factors and absence of blaKPC (Group B, 7 isolates—SIMPROF) and the third group (Group C, 6 isolates) with fewer genes related to virulence factors and the presence of blaKPC-2, with the exception of KPEC9K. Importantly, the KPEC11K isolate was blaKPC-2 but did not show phenotypic resistance to carbapenems.
Categorization of the isolates was determined based on MLST by considering the presence or absence of antibiotic resistance and virulence genes, revealing a predominance of ST45 in group B and ST629 in group C. A total of 44 resistance genes were identified in the isolates and classified into 10 antibiotic classes based on the Antibiotic Resistance Ontology (ARO) classification system. The antibiotic classes included β-lactams, aminoglycosides, fluoroquinolones, sulfonamides, trimethoprim, fosfomycin quinolone, phenicol, macrolides, and tetracycline (Fig. 4). The predominant resistance mechanisms observed included antibiotic inactivation (aph(3’’)-Ib, aph(6)-Id, aac(3’)-IIe, blaCTX-M-15) in a range–9–13 isolates, antibiotic target replacement (sul2, dfrA14) in 13 isolates, antibiotic target protection (qnrB1) in 10 isolates, and antibiotic efflux (tet(A)) in 9 isolates.
Heatmap of antibiotic resistance genes and virulence factor profiles of 14 K. pneumoniae isolates from neonatal clinical isolates from Ecuador. Black boxes indicate the presence of genes, and gray boxes indicate the absence of genes. The characteristics of antibiotic resistance and virulence factors are represented in different colors in the first row, and these characteristics are described in the legend. Cluster analysis was based on the Euclidean distance between the genes present in each sample and representing real groups (p = 0.01 at 999 iterations, SIMPROF)
Analysis of the groups within the cluster revealed that group A exhibited 13 genes, whereas groups B and C had 18 and 27 genes, respectively. Unique genes were identified within each group, with nine unique genes in group A, four in group B, and 14 in group C. The principal resistance mechanisms exhibited by these genes primarily involved antibiotic inactivation, such as blaKPC-3, blaOXA-9, aadA1, aac(6′)-Ib-AKT, aac(3)-IVa, aph(4)-Ia in group A; blaSHV-145, blaTEM-1, blaOXA-1, blaSHV-101 in group B; and blaSHV-11, blaCTX-M-12, blaKPC-2, blaSHV-110, blaSHV-106, fosA6, and mph(A). Additionally, antibiotic efflux has been identified as a key resistance mechanism in groups A and C (oqxAB alleles).
Our study examined resistance-associated point mutations (RAPM) in the isolates, identifying mutations primarily in ompK35, ompK36, ompK37, gyrA, parC, and acrR (Supplementary Table 10, Supplementary Fig. 1). For one hand, mutations in ompK genes affect β-lactam antibiotic resistance in non-carbapenemase-producing. Regarding ompk35, we found a premature stop codon in one of the isolates (KPEC15K), while in ompk36, eleven isolates had mutations mainly p.N49S and p.L59V (11/14) and 3 had the absence of the gene; finally, for ompk37, 13 isolates had mutations, predominantly p.I170M and p.I128M, while one had the absence of the gene. Notably, among seven carbapenem-resistant isolates in the antibiogram, three were blaKPC-negative but had porin mutations conferring resistance to this antibiotic class. On the other hand, our study showed that the acrR gene was present in 13 out of 14 isolates (92.85%), with one isolate (7.14%) lacking this gene. All isolates with the acrR gene shared the same mutations (p.P161R, p.G164A, p.F172S, p.R173G, p.L195V, p.F197I, and p.K201M), suggesting resistance to fluoroquinolones and β-lactams. Additionally, we detected a one-point mutation in gyrA, which was present in all the KPC-2 isolates (p.S83I). Similar to gyrA, parC was mutated (parC p.S80I) in KPC-2. Mutations in parC and gyrA are associated with resistance to fluoroquinolones, particularly ciprofloxacin.
We also identified the presence of cross-resistance genes, including the oqxAB system, composed of oqxA and oqxB subunits, and the aac(6’)-Ib-DY18 (aac(6’)-Ib-cr) gene. These genes are known to elevate the minimum inhibitory concentrations (MIC) of specific fluoroquinolones. The aac(6´)-Ib-cr gene notably enhances aminoglycoside activity and induces cross-resistance to fluoroquinolones. We found both oqxAB and aac(6’)-Ib-cr genes in six isolates (KPEC14K, KPEC13K, KPEC15K, KPEC28K, KPEC37K, and KPEC29K), suggesting a possible increase in fluoroquinolone resistance (Fig. 4).
Additionally, we examined the acrAB system, which imparts resistance to quinolones and beta-lactams, requiring both acrA and acrB subunits. Ten isolates had the complete system (Supplementary Fig. 1), while three isolates contained only one gene. One isolate was missing the acrAB system entirely.
Virulence factors
In this study, we analyzed 14 K. pneumoniae isolates using the Virulence Factor Database (VFDB) and identified a range of virulence factors, categorizing them into eight distinct groups based on their functional roles. We identified genes associated with biofilm formation (mrkABCDFHIJLM), adherence (fimABCDEFGHIK), immune evasion, secretion systems (tssABCDFGHIJKLM, tli1, and KPHS_23120), and a notably high number of genes associated with the iron-uptake system (entABCDEF, fepABCDG, fes, iroE, ybtSXQPAUTE, irp1, irp2, and fyuA). Additionally, a small number of genes were linked to efflux pumps (acrAB) and regulatory functions (rcsAB), with some isolates showing genes associated with serum resistance (Supplementary Table 11). The most prevalent virulence factors are related to the iron uptake system. Notably, the majority of the ST45 types possessed most of the iron uptake genes, whereas the yersiniabactin cluster (ybtSXQPAUTE, irp1, irp2, and fyuA) was found only in non-KPC isolates (Group B: SIMPROF). The second representative virulence factor is the secretion system, which includes many genes encoding the type VI secretion system (T6SS) that exhibits antibacterial activity (tssA to tssL).
In relation to Virulence-related biofilm genes, cps (capsular-encoded genes; see Fig. 4), mrk (type III fimbriae), and fim (adherence) genes, were identified in all the isolates. Regarding non-KPC strains, genes related to serum resistance and LPS synthesis (i.e. wbbM and wzm) were identified in this group. We also identified multidrug efflux pump transporters that are widespread among Gram-negative bacteria, including those of the resistance-nodulation-division (RND) superfamily, which is the most important mechanism associated with resistance against various antimicrobial molecules in K. pneumoniae. The acrA and acrB genes, which were identified in most of the Ecuadorian isolates (10/14), were classified into the RND family (Fig. 4). We also identified rcsA and rcsB, which are associated with capsule polysaccharide formation in most isolates. In terms of genes related to hypervirulence (e.g. aerobactin, salmochelin, etc.), none of them were not found in these isolates.
Plasmid prediction and resistance genes association
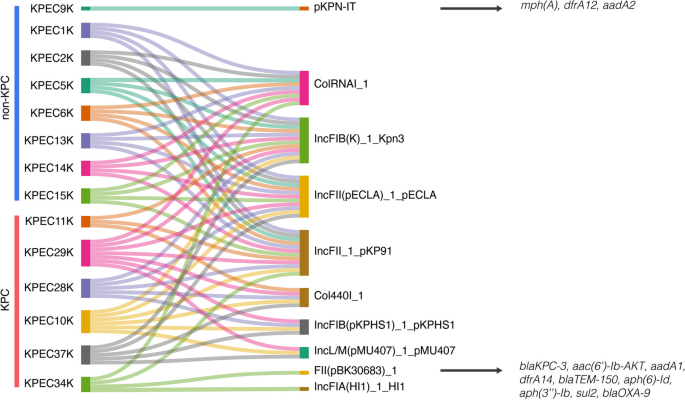
A total of 10 replicons were identified in our study, with ST45 isolates exhibiting ColRNAI, pKPN3, IncFII(pECLA), and IncFII_1_pKP91 replicons. In contrast, the IncL/M(pMU407) replicon was found only in the ST629 and ST629-LV isolates. Furthermore, the Col440I replicon was uniquely present in blaKPC-2 isolates, whereas blaKPC-3 isolates harbored distinct replicons, specifically FII (pBK30683) and IncFIA (HI1). Through plasmid reconstruction, our results revealed the association of specific resistance genes with certain isolates, such as the presence of a unique replicon of KPEC34K, FII(pBK30683) (accession number KF954760) (coverage 99.9%, pairwise identity 98.7%), which was associated with the presence of genes such as blaKPC-3, aac(6′)-Ib-AKT, aadA1, dfrA14, blaTEM-150, aph(6)-Id, aph(3’’)-Ib, sul2, and blaOXA-9. Similarly, reconstruction of the pKPN-IT plasmid (accession number JN233704.1) revealed the resistance gene profile of the KPEC9K isolate, including mph(A), dfrA12, and aadA2, which are known to be part of a class 1 integron (Fig. 5). Notably, although the pKPN3 plasmid was similar to pKPN-IT (coverage 76.2%, pairwise identity 99.3%), the latter contained an integron with resistance genes absent in pKPN3 isolates. None of the remaining replicons showed any association with the resistance genes in our isolates.
Phylogenetic analysis
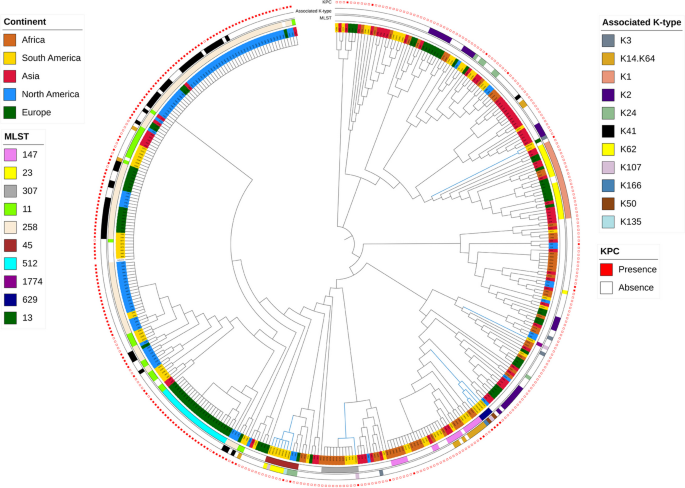
Using the core single nucleotide polymorphisms (cgSNPs) of 90,474 SNPs, we conducted a phylogenomic analysis to determine the relationship between Ecuadorian isolates and isolates from other countries based on factors such as associated K-type, MLST, and the presence of carbapenemase-producing genes. According to geographical distribution, seven were related to North America and four were related to Africa, except for three isolates (KPEC15K, KPEC9K, and KPEC11K) that were distributed among isolates from Asia and Africa (Fig. 6). Among the MLSTs, ST45 and ST629 were the predominant STs among all Ecuadorian isolates considered in this study. However, the isolates from Ecuador clustered into different clades, including the ST45 and ST629 variants. Most ST45 isolates were non-KPC producers, in contrast to the ST629 isolates, which were KPC-positive. The remaining isolates showed a high level of diversity without discernible patterns. Additionally, the Ecuador isolates did not exhibit a link with those globally producing carbapenemases. Finally, we observed variations in the associated K-types across isolates.
Phylogenetic tree of K. pneumoniae isolates. Isolates from different phylogroups are colored differently. Layers around the tree denote (from inside out) MLST including sLV (ST locus variant), KPC, and the associated K-type. Blue branch color represents Ecuadorian isolates. Branch lengths are not to scale



Add Comment