


Demographic characteristics of the study participants
A total of 4,043 participants were enrolled in the study, of which 50.3% (n = 2,034) were female and 49.7% (n = 2,009) were male. The overall mean age of the participants was 45.3 ± 16.7 years. At enrolment, participants reported various symptoms and signs as presented in Table 1. In relation to sex, blood in feaces (P < 0.004), ever received PZQ (P < 0.001) and ever vomited blood (P < 0.004) were reported more frequently among males’ participants. There was no significant difference in relation to age for the following reported symptoms: (i) diarrhoea (χ2(5) = 1.4938, P = 0.9), (ii) blood in stool in the last two weeks (χ2(5) = 1.7392, P = 0.9) and (iii) abdominal pain (χ2(5) = 7.9583, P = 0.2). Having ever vomited blood was reported more frequently in the age group 36–45 years (1.6%), 46–55 years (3%) and 56–65 years (2.1%) (Exact = 0.1), currently vomiting blood (Exact = 0.9) and ever had abdominal distension problems (χ2(5) = 5.1942, P = 0.4). In the older age groups ≥ 36 years, the proportion of individuals who had ever taken PZQ treatment was higher compared to the younger age groups (χ2(1) = 164.2949, P = 0.001).
Prevalence and intensity of Schistosoma mansoni infection
The overall prevalence of S. mansoni infection based on Kato-Katz-Technique was 30.4% (95%CI:29.0-31.9%), with male participants having a higher prevalence than female participants (32.2% versus 28%, χ2(1) = 11.2005, P = 0.001). The youngest age groups 18–25 years and 26–35 years had the highest prevalence compared to the older age groups ≥ 36 years (Table 2). Figure 2 shows the prevalence of S. mansoni categorised by age groups.
The geometrical mean of eggs per gram of faeces (GMepg) was 105.3 (95%CI:98.7-112.3 GMepg), with males having the highest GMepg value of 113.8 (95%CI:104.0–124.4 GMepg) while the GMepg value of females was 96.3 (87.8-105.6 GMepg) (t = 3.6076, P = 0.001). There was a significant difference in the intensity of infection between the age groups, with the youngest age groups 18–25 years (126.6–95%CI:100.3-131.9 GMepg) and 25–35 years (115.04-95%CI:100.3-131.9 GMepg) having the highest intensity of infection (F = 9.61, P = 0.001). In relation to infection intensity categories, 53.9%, 32.4% and 13.7% had light, moderate and heavy intensity of infection, respectively. No significant difference was observed in all infection categories (χ2(2) = 6.2142, P = 0.045) in relation to sex. The youngest age groups 18–25 years and 26–35 years had a higher proportion of people with heavy infection intensity (19% and 16.4%) than other age groups (χ2(10) = 21;2487, P = 0.02).
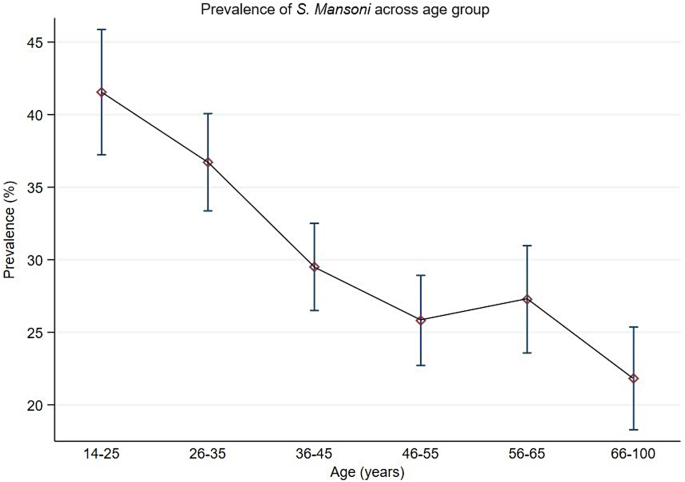
Prevalence of Schistosoma mansoni infection categorized by age based on Kato Katz technique among adult community members on Ukerewe district
A limited number of POC-CCA tests were available, both stool and urine samples could therefore only be analysed from a random sample of participants (n = 2,945). Overall, the prevalence of Schistosoma based on the POC-CCA test was 84.7% (95%CI:83.3–85.9%), with no significant difference between male and female participants (84.9% versus 84.4%, χ2(1) = 0.1387, P = 0.7). The youngest age groups (Figs. 3), 18–26 years (94.1%) and 26–35 years (87.2%) had the highest prevalences compared to the oldest age groups (χ2(5) = 48.1767, P = 0.001. Of the 2494/2945 (84.7%) who had POC-CCA positive results, 803/2,995 (27.3%) had S. mansoni egg positive slides.
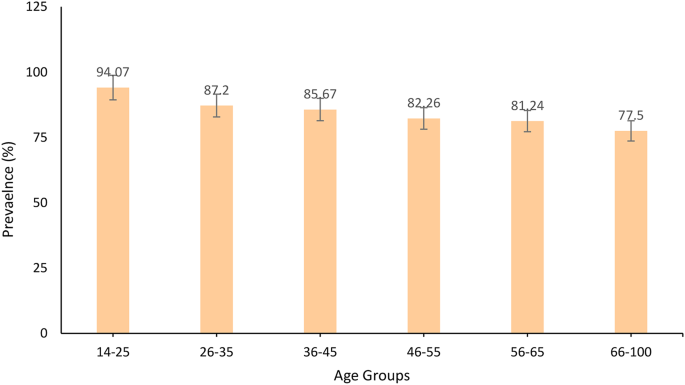
Prevalence of Schistosoma mansoni infection categorized by age and sex based on Point-of-Care Circulating Cathodic Antigen Test among adult community members on Ukerewe district
Based on KK-technique, factors associated with S. mansoni infections were being male (aPR = 1.2,95%CI:1.0-1.1, P = 0.001), age groups, 18–25 years (aPR = 1.2,95%CI:1.1–1.3, P < 0.001), 26–35 years (aPR = 1.2,95%CI:1.1–1.2, P < 0.001), 36–45 years (aPR = 1.1,95%CI:1.0-1.1, P < 0.001), 46–55 years (aPR = 1.1,95%CI:1.0-1.1,P < 0.04) and 56–65 years (aPR = 1.1,95%CI:1.0-1.1, P < 0.03), reported blood in stool (aPR = 1.1,95%CI:1.0-1.1, P < 0.002), no history of PZQ use (aPR = 1.1,95%CI:1.0-1.1, P < 0.001) and village of residence. Table 3 present risk factors associated with S. mansoni infection among the adult population.
Co-infection of S. mansoni with Hepatitis C, B and HIV-1
A total of 3,939 participants had complete results for hepatitis C antibodies, 3, 933 for hepatitis B surface antigen and 3,895 for HIV-1 antibodies. Overall, the prevalences of hepatitis C antibodies, HIV and hepatitis B surface antigen were 0.4%, 2.2% and 4.7%. In general, 0.3%, 2.2% and 5.4% of the participants were co-infected with hepatitis C and S. mansoni, HIV and S.mansoni and hepatitis B and S. mansoni. A possible triple infection with hepatitis B, C and S. mansoni infections was observed in one participant whereas triple infection with HIV, hepatitis B and S. mansoni infection was observed in two participants.
Schistosoma mansoni related hepatosplenic morbidities and their associated factors
Complete data for abdominal ultrasound data were available for 3,630 participants from 20 villages.
Periportal fibrosis and its associated factors
A total of 3,447 participants had complete data for hepatosplenomegaly. The overall prevalence of periportal fibrosis (PPF) was 48.1% (1,657/3,447,95%CI:64.4–49.7%) and 47.3% of them had a detectable active S. mansoni infection as indicated by S. mansoni egg positive slides. Male participants had a higher prevalence of PPF than female participants (55.8%,95%CI:56.1–60.7% versus 37.3%,95%CI:34.9–39.6%, χ2(1) = 154.0461, P = 0.001). The older age group (≥ 36 years) had the highest prevalence of PPF compared with the youngest age group < 36 years (χ2(2) = 21.4302, P = 0.001). For all the participants who had PPF, had liver image pattern C and Cb (15.2%), D (7.8%), E and F (2.9%).
Factors associated with PPF are presented in Table 4. At univariate analysis, increased liver image pattern was associated with increased risk of having PPF. At multivariable analysis, being male (aPR = 1.2, 95%CI:1.1–12,P < 0.001), older age groups, 36–45 years (aPR = 1.2,95%CI:1.0-1.2,P < 0.02), 46–55 years (aPR = 1.1,95%CI:1.1–1.2,P < 0.001), 56–65 years (aPR = 1.2,95%CI:1.0-1.1,P < 0.02) and ≥ 66 years (aPR = 1.2,95%CI:1.1–1.2,P < 0.001), reported ever vomited blood (aPR = 1.1,95%CI:1.0-1.3,P < 0.03), reported abdominal distension (aPR = 1.1,95%CI:1.1–1.3,P < 0.001) and villages of residences were associated with increased risk of having PPF.
Prevalence of splenomegaly
The overall prevalence of splenomegaly was 40.5% (95%CI: 38.8–42.1%) with significant difference observed between sex. Male participants had a higher prevalence than female participants (45.7% versus 35.1%, χ2(1) = 41.9573, P = 0.001). There was no significant difference in prevalence of splenomegaly between age groups (χ2(5) = 1.7894, P = 0.9). Of those with splenomegaly, 57.9% (n = 851) and 42.1% (n = 618) had enlarged and severely enlarged spleens.
Left liver lobe hepatomegaly and its associated factors
The overall prevalence of hepatomegaly (enlargement of the left liver lobe) was 66.2% (95%CI:4.6–67.7%). Female participants recorded a higher prevalence of hepatomegaly than male participants (70.4% versus 62.1%, χ2(4) = 28.2256, P = 0.001). By age groups, the older age groups ≥ 36 years recorded a higher prevalence of hepatomegaly then the youngest age groups (χ2(5) = 28.6018, P = 0.001). Of those who had hepatomegaly, 66.8% and 33.2% had enlarged and severely enlarged left liver.
Table 5 illustrates factors which remained independently associated with left liver lobe hepatomegaly were being female (aPR = 1.1,95%CI:1.0-1.1, P < 0.001), age groups, reported history of non-use of praziquantel drug (aPR = 1.1,95%CI:1.0-1.1, P < 0.002), village of residences and liver image pattern (C-D).
Portal vein dilatation and its associated factors
The overall prevalence of portal vein dilatation (PVD) was 67.7% (95%CI: 66.2–69.2%). Male participants had a higher prevalence of PVD than female participants (72.6% versus 62.7%,χ2(1) = 40.2610, P = 0.001) (Fig. 4). In relation to age groups, the older age groups (> 40 years), had the highest prevalence of PVD and the prevalence was observed to increase with increasing age (χ2(5) = 28.4994, P = 0.001) (Fig. 5). Of the participants with PVD, 51.2% and 48.8% had a dilated and severely dilated portal vein.
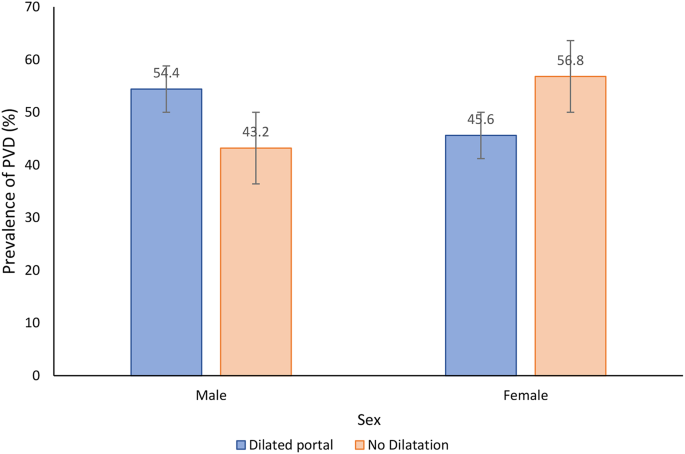
Prevalence of portal vein dilatation categorised by sex among adult population on Ukerewe island, north-western Tanzania
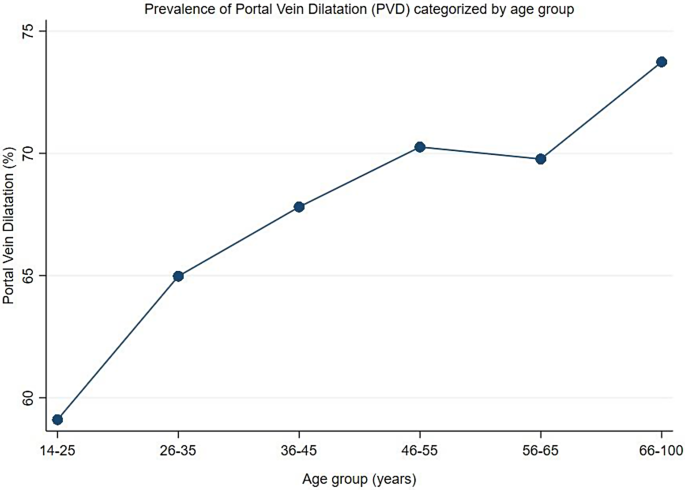
Prevalence of Portal Vein Dilatation categorized by age groups, the prevalence of PVD increased with increase in age
Factors associated with portal vein dilatation included age groups, 46–55 years (aPR = 1.1,95%CI:1.0-1.1, P < 0.03), 56–65 years (aPR = 1.1, 95%CI:1.0-1.1, P < 0.02) and (aPR = 1.1,95%CI:1.0-1.2, P < 0.001), as well as liver image pattern C (aPR = 1.5,95%CI:1.4–1.5, P < 0.001), pattern D (aPR = 1.4,95%CI:1.4–1.5, P < 0.001), pattern E (aPR = 1.6,95%CI:1.5–1.7, P < 0.001) and pattern F (aPR = 1.6,95%CI:1.5–1.8, P < 0.001). Other factors are shown in Table 6.
Prevalence of both splenomegaly, hepatomegaly, and portal vein dilatation
A proportion of participants who had hepatomegaly (66.2%) and splenomegaly (40.5%) had an enlargement of both organs (hepatosplenomegaly). A total of 46.6% of those who had enlargement of either the liver or spleen had hepatosplenomegaly. In relation to the portal vein dilation, a total of 50.9% of those who had splenomegaly, had also a portal vein dilatation. Conversely, 71.9% of those who had hepatomegaly had also a portal vein dilatation. Lastly, 56% of the participants who had hepatosplenomegaly, had portal vein dilatation. Figures 6 and 7 summarizes the prevalence of hepatosplenic morbidities categorised by age and sex among the adult participants on Ukerewe island.
Other ultrasound detectable morbidities related to S. mansoni infection
Other detectable morbidities included gall bladder wall thickening (≥ 4 mm) with a prevalence of 40.4% (95%CI:38.5–42.3%). The prevalence was higher in males than in females (χ2(1) = 98.8089, P < 0.001), as well as in the older age groups (≥ 26 years, ≥ 40%). Ascites was found in 1.7% and collateral veins in 18.3% of the study participants.

Prevalence of S. mansoni related ultrasound detectable morbidities (splenomegaly, hepatomegaly, and portal vein dilatation) categorised by age groups
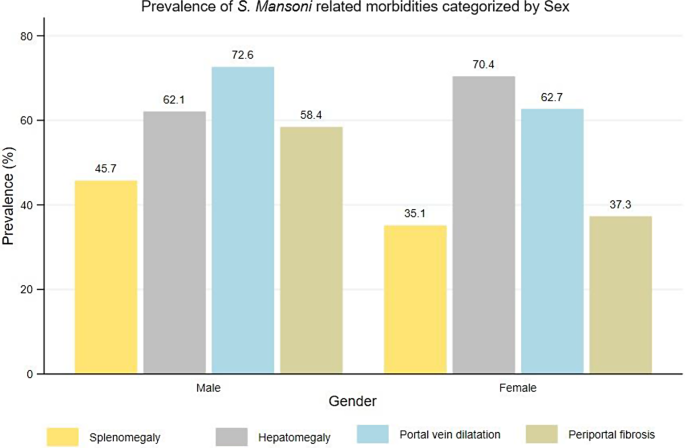
Prevalence of S. mansoni infections and its related ultrasound detectable morbidities (splenomegaly, hepatomegaly, periportal fibrosis and portal vein dilatation) categorised by sex
Add Comment