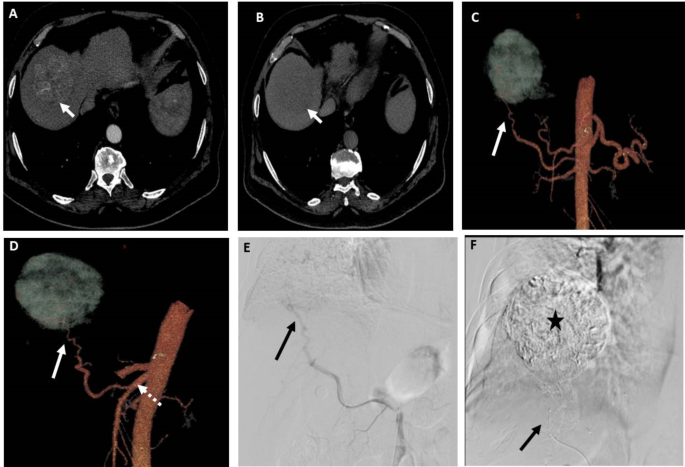
Sixty-nine consecutive patients were included in the study; 59 were males (85.5%), and 10 were females (14.5%), with a mean age of 65 ± 6 years (range, 54–81 years). Forty-four patients (63.8%) had their CT examinations conducted at our institution, while the remaining 25 patients underwent CT scans at four other hospitals.
A total of 136 active HCCs were detected among the 69 patients included in the study. The mean size of the 136 included active lesions was 4.2 cm ± 3.6 cm (median/interquartile range (IQR) = 3.3/3.8 cm), and the lesions ranged in size from 1 to 24 cm. Ninety-six lesions (70.6%) were > 2 cm in size, and 40 lesions (29.4%) were ≤ 2 cm in size. A total of 129 lesions (94.9%) were capsulated, and the remaining 7 lesions (5.1%) were diffuse.
The 3D CT versus DSA quality grades were subsegmental in 47 (68.1%) versus 50 patients (72.5%), segmental in 21 (30.4%) versus 18 (26.1%), and lobar in one (1.4%) versus one (1.4%) patient, respectively, with no statistically significant difference between them (chi-square test (X2), P = 0.9).
Hepatic arterial variant anatomy was noted in 28 patients (40.5%); replaced right hepatic artery from the SMA in 20 patients (Fig. 2), accessory left hepatic artery in three patients, replaced left hepatic artery arising from the left gastric artery in one patient, middle hepatic artery arising from the gastroduodenal artery in one patient, CHA arising from the SMA in one patient, CHA arising from the aorta in one patient, and separate origin of both segment III and II arteries from the CHA in one patient. One patient had occlusion of the celiac trunk origin, and another patient had celiac stenosis with prominent pancreaticoduodenal collateral arteries in both patients. DSA and 3D CT image findings were consistent in 100% of these patients according to both observers.
A patient with segment VII HCC measuring 6.5 cm. (A) and (B) Axial CT images in the arterial and venous phases, respectively, showing early arterial contrast enhancement of the lesion and contrast washout in the venous phase relative to the surrounding liver. (C) and (D) 3D reconstructed CT angiography images in AP view and oblique views, respectively, showing the possible feeding artery (arrow) to the lesion arising from replaced right hepatic artery from SMA (dashed arrow). (E) DSA of the SMA at the origin of the replaced right hepatic artery using 5Fr catheter showing the possible feeding artery (arrow). (F) Post-TACE DSA image showing complete opacification of the lesion with lipiodol after chemotherapy-lipiodol mixture injection through the microcatheter (arrow) in the feeding artery. Both observers identified the feeding artery in 3D images and DSA images
Feeding artery detection (Table 1)
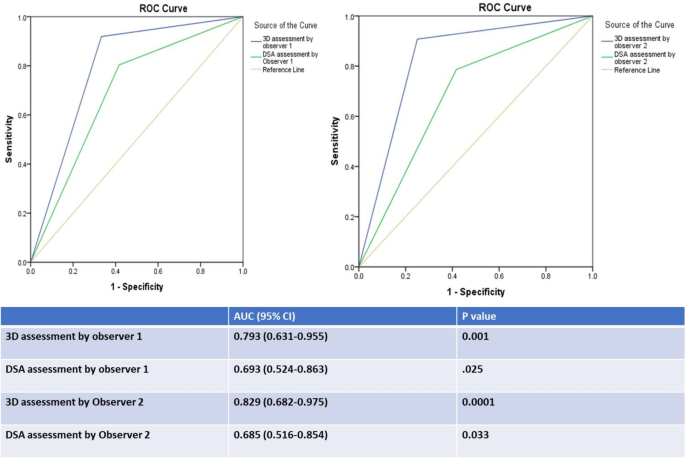
A total of 185 feeding arteries were detected by 3D CT and DSA by both observers and included in the analysis; 173 of them (93.5%) were true feeding arteries according to the ground truth. 3D CT detection of feeding arteries by observer1 versus observer2 revealed a sensitivity of 91.9% versus 90.8% (mean = 91%), a specificity of 66.7% versus 75% (mean = 71%), a PPV of 97.5% versus 98.1% (mean = 98%), an NPV of 36.4% versus 36% (mean = 36%), and an accuracy of 90.3% versus 89.7% (mean = 90%). ROC curve analysis of the results for observers 1 and 2 revealed that the AUC was 0.79 (0.63–0.96, 95% CI; P = 0.001) and 0.83 (0.68–0.98, 95% CI; P = 0.0001), respectively (mean AUC = 0.81). There was very good agreement between the two observers regarding feeding artery detection by 3D CT images (K = 0.829, P = 0.0001).
DSA detection of feeding arteries by observer1 versus observer2 revealed a sensitivity of 80.3% versus 78.6% (mean = 80%), a specificity of 58.3% versus 58.3% (mean = 58%), a PPV of 96.5% versus 96.5% (mean 96.5%), an NPV of 17.1% versus 15.9% (mean = 16.5%), and an accuracy of 78.9% versus 77.3% (mean = 78%). ROC curve analysis of the results for observers 1 and 2 revealed that the AUC was 0.69 (0.52–0.86, 95% CI; P = 0.025) and 0.69 (0.52–0.85, 95% CI; P = 0.03), respectively (mean AUC = 0.69). There was very good agreement between the two observers regarding feeding artery detection by DSA (k = 0.863, P = 0.0001).
For lesions ≤ 2 cm, DSA detection of feeding arteries by both observers revealed a mean sensitivity of 45%, a mean specificity of 50%, a mean PPV of 97%, a mean NPV of 2% and a mean accuracy of 45%, while 3DCT revealed a mean sensitivity of 89%, a mean specificity of 100%, a mean PPV of 100%, a mean NPV of 18.5%, and a mean accuracy of 89%.
The accuracy of detection of the feeding arteries and the area under the receiver operating characteristic (ROC) curve (AUC) were greater for 3D CT than for DSA for both observers (Fig. 3).
Among the 136 detected active HCCs, the rate of 3DCT detection of all feeding arteries of each lesion was higher than DSA by both observers but without statistical significance i.e. observer1 has detected all feeding arteries of 124 lesions (91.2%) by CT and all feeding arteries of 107 lesions (76.5%) by DSA (X2 test, P = 0.15) while observer2 has detected all feeding arteries of 121 lesions (89%) by CT and all feeding arteries of 100 lesions (73.5%) by DSA (X2 test, P = 0.22).
Factors affecting accuracy (Table 2)
There was a significant association between 3D CT image quality and the accuracy of detection of the feeding vessels by both observers, as false negative results were greater for “Lobar “ 3DCT image quality than for “segmental and subsegmental” image qualities (X2 test with post hoc analysis, P = 0.0001), and true positive results were lower for “Lobar” 3DCT image quality than for “segmental and subsegmental” image qualities (X2 test with post hoc analysis, p = 0.0001). However, there was no significant association between DSA quality and the accuracy of detection of feeding vessels by either observer (X2, P = 0.78).
There was a significant association between the type of lesion and the 3D CT accuracy of feeding artery detection by both observers, i.e., true positive results were greater in capsulated lesions (X2 test with post hoc analysis, P = 0.003), and false negative results were lower in capsulated lesions (X2 test with post hoc analysis, P = 0.0001). There was no significant association between the type of lesion and DSA accuracy of detection of the feeding arteries by both observers (X2 test, P = 0.45).
There was a significant association between lesion size and DSA accuracy of feeding artery detection by both observers, i.e., true positivity was greater in lesions > 2 cm, while false negativity was greater in lesions ≤ 2 cm (X2 test with post hoc analysis, P = 0.0001). However, there was no association between size category and 3D CT accuracy of detection of feeding vessels by either observer (X2 test, P = 0.5).
In the 69 patients, DSA was done using 5Fr catheter in 60 patients (87%) and using microcatheter in 9 patients (13%). Among these 9 patients, the 5 Fr catheter could not be advanced in the ostium of the replaced right hepatic artery in 7 patients or in the celiac trunk in one patient with celiac stenosis and another patient with celiac occlusion. There were no statistically significant differences between the 5 Fr catheter DSA and microcatheter DSA in detecting feeding arteries as observed by both observers. For observer1, TP feeders were 75.3% (n = 122) for the 5 Fr catheter DSA and 73.9% (n = 17) for the microcatheter DSA, while FP feeders were 2.5% (n = 4) and 4.3% (n = 1), respectively. TN feeders were 3.1% (n = 5) and 8.7% (n = 2), and FN feeders were 19.1% (n = 31) and 13% (n = 3), (X2 test; P = 0.5). Observer1 missed three feeding arteries in DSA using the microcatheter, which were detected by 3D CT images. For observer2, TP feeders were 74.1% (n = 120) for the 5 Fr catheter DSA and 69.6% (n = 16) for the microcatheter DSA, while FP feeders were 2.5% (n = 4) and 4.3% (n = 1), respectively. TN feeders were 3.1% (n = 5) and 8.7% (n = 2), and FN feeders were 20.4% (n = 33) and 17.4% (n = 4), (X2 test, P = 0.55). Observer2 missed four feeding arteries in DSA using the microcatheter, which were detected by 3D CT images.
The degree of confidence and the factors affecting it (Table 3)
The degree of confidence of feeding artery detection by 3D CT by observers 1 and 2 was “definitely feeding artery” in 106 versus 98 arteries, “probably feeding artery” in 26 versus 34, “intermediate probability” in 31 versus 28 and “not a feeding artery” in 22 versus 25. There was very good agreement between both observers regarding the degree of confidence in feeding artery detection by 3DCT (k = 0.828, P = 0.0001).
The degree of confidence of feeding artery detection by 3DCT by both observers as “definite feeding artery” was significantly greater in lesions > 2 cm than in lesions ≤ 2 cm (X2 test with post hoc analysis, p = 0.0001), while “intermediate probability” was significantly lower in lesions > 2 cm than in lesions ≤ 2 cm (X2 test with post hoc analysis, p = 0.0001). The degree of confidence was also significantly lower in image quality, graded as “lobar” than “subsegmental and segmental” quality grades, for both observers (X2 test with post hoc analysis, p = 0.0001).
The degree of confidence of feeding artery detection by DSA by observers 1 and 2 was “definitely a feeding artery” in 94 versus 100 arteries, “probably a feeding artery” in 38 versus 33 arteries, “intermediate probability” in 12 versus 8 arteries and “not a feeding artery” in 41 versus 44 arteries, respectively. There was very good agreement between both observers regarding the degree of confidence in feeding artery detection by DSA (k = 0.846, P = 0.0001).
The degree of confidence in feeding artery detection by DSA as “definite feeding artery” by both observers was significantly greater in lesions > 2 cm than in lesions ≤ 2 cm, while the degree of not detecting the feeding artery or intermediate probability of being a feeding artery was significantly greater in lesions ≤ 2 cm than in lesions > 2 cm (X2 test with post hoc analysis, P = 0.0001). However, there was no significant difference in confidence score between the different image quality grades. (X2test, P = 0.62 and 0.28 for both observers).


Add Comment