

EE and LC %
Using a UV spectrophotometer (PE, USA) adjusted at 324 nm, the EE and LC of Um-Al MOF nanoparticles were found to be 90% and 18%, respectively. These results show the potential of Al-MOF nanoparticles as an efficient drug carrier.
Fourier Transform Infrared Spectroscopy (FT-IR)
The FT-IR spectra of Al-MOF nanoparticles and their components are presented in (Fig. 1A). Um’s FT-IR spectrum displayed a sharp peak of the OH group at 3,153 cm−1. C-H stretching vibrations are identified at 3,122 and 2,987 cm−1, single bonded carbonyl group vibrations at 1388, 1,345, and 1,233 cm−1, and C–C stretching vibrations at 1,578, 1,454, 1,446, 1,409, and 1,386 cm−1, similar observation has been recorded previously [54]. The Fourier transform infrared spectra of the Al-MOF nanoparticles (Fig. 1A) show vibration bands in the range of 1,400–1,700 cm−1 for the carboxylic functional group. Additionally, bands at 1,608 and 1,512 cm−1 indicate asymmetric stretching (-COO-), whereas bands at 1,435 and 1,417 cm−1 are indicative of symmetric stretching (-COO-). Also, The absorption band at 1,669 cm−1 was caused by unreacted BDC molecules’ –COOH group being trapped in Al-MOF nanoparticles’s cavities that agree with previously reported data [55]. The spectra of the Um-Al MOF nanoparticles showed changes at different peaks, with the characteristic peaks of Um disappearing in the Al-MOF nanoparticles spectrum, indicating that Um was impeded in the nanoparticles matrix rather than on the surface, suggesting a possible interaction between Um and Al-MOF nanoparticles.

FTIR, XRD, and TGA analysis of the prepared nanoparticles. A FTIR spectra. B XRD analysis. C TGA analysis of Al-MOF nanoparticles, Um and Um-Al MOF nanoparticles composites prepared
X-ray diffractometry (XRD)
The XRD patterns of Um, Al-MOF nanoparticles, and Um-Al MOF nanoparticles demonstrated the high crystallinity of the prepared Al-MOF nanoparticles (Fig. 1B). For the XRD pattern of Um, two strong peaks were found with diffraction peaks at 2θ of 11.2°, 16.0°, revealing the drug’s crystalline nature (crystallinity percent = 92.2%) where the Joint Committee on Powder Diffraction Standards (JCPDS) card number for Um is 01–084-4965 [54]. Prominent diffraction peaks at 2θ of 8.5 and 16° indicated the crystallinity of Al-MOF nanoparticles (crystallinity percent = 51.6%) and JCPDS card number is 00–021-1919, 00–002-0173 [56]. The XRD pattern of Um-Al MOF nanoparticles showed some changes, where a decrement in the intensity of the diffraction peak at 8.66 and a shift in the diffraction peak at 12.4 were observed, suggesting the conjugation of Um to Al-MOF nanoparticles (crystallinity percent = 55.5%).
Thermal gravimetric analysis (TGA)
The reduction of a defined mass of Al-MOF nanoparticles loaded with Um was studied using TGA by heating under air atmosphere flow from 50 to 600 °C at a constant rate of 10 °C/min and a flow rate of 40 ml/min. As shown in (Fig. 1C), TGA profiles of Al-MOF nanoparticles exhibited three weight losses within the range of 14.89–218.81 °C, 226.86–456.1 °C, and 464.24–585.93 °C, representing the thermal breakdown of Al-MOF nanoparticles and the evaporation of physically adsorbed water. TGA of Um showed three stages of weight loss, corresponding to the degradation temperature in the range of 14.89–173.38 °C (physically adsorbed water and volatile solvents loss), 184.06–279.35 °C, and 282.47–400.17 °C (thermal decomposition of Um). Um-Al MOF nanoparticles conjugate displayed three thermal breakdowns in the range of 14.89–301.34 °C, 309.4–418.82 °C, and 432.15–574.18 °C, respectively, due to the degradation of Um-Al MOF nanoparticles conjugate and water content. Um was successfully encapsulated into Al-MOF nanoparticles, as demonstrated by the thermogravimetric analysis (TGA) of the Um-Al-MOF conjugate, which exhibited the thermal degradation profiles characteristic of both Um and the Al-MOF nanoparticles.
Transmission electron microscopy (TEM)
Figure 2 presents transmission electron micrographs of Um-Al MOF and Al-MOF nanoparticles. In Fig. 2A, Al-MOF nanoparticles were morphologically analyzed and found to be grey, light spherical, polydisperse, smooth-surfaced, and around 100 nm. In Fig. 2B. Um-Al MOF nanoparticles, with sizes around 200 nm, seemed almost more aggregated. Um can engage in various interactions with Al-MOF, including hydrophobic interactions, π-π stacking between Um’s aromatic ring and the conjugated systems within Al-MOF, as well as electrostatic interactions involving Um’s hydroxyl (-OH) and carbonyl (C = O) functional groups with the charged functional groups on the surface of Al-MOF nanoparticles. These interactions contribute to an increased propensity for the particles to aggregate or form clusters, rather than staying evenly dispersed. The grey Al-MOF changed to a dark color as a result of saturation with the loaded Um.

Transmission electron microscopy (TEM) images OF (a) Al-MOF nanoparticles, (b) morphology and dispersity of Um-Al MOF nanoparticles
In-vitro drug release study
Um in-vitro release profile via Al-MOF nanoparticles in PBS at physiological pH 7.4 at 37 °C is displayed in (Fig. 3A). The release was initially fast and continued for more than 7 days, indicating that Al-MOF nanoparticles achieved a sustained drug release pattern. The biphasic drug release profile, consisting of an initial burst release followed by a slower, sustained release phase, is influenced by the distinct interaction of Um molecules with the Al-MOF structure. During the initial burst release phase, Um molecules loosely associated with the surface of the Al-MOF rapidly dissolve into the surrounding medium. These surface-bound molecules are not fully encapsulated within the Al-MOF, resulting in their quicker release. In contrast, the slower sustained release phase occurs as Um molecules that are more deeply integrated within the pores of the Al-MOF gradually diffuse out, taking more time to be released compared to those on the surface. The slow and small release confirmed the perfect complexation of Um and Al-MOF nanoparticles.
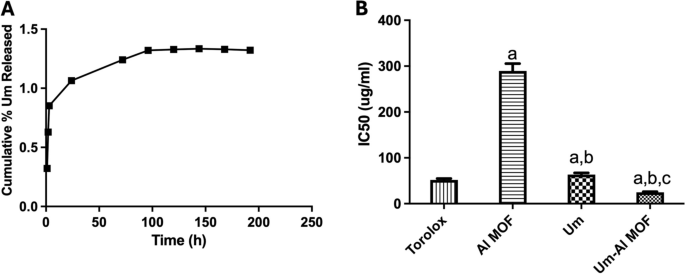
A The in vitro release profile of Um from Al-MOF nanoparticles. B DPPH% scavenging activity of Al-MOF nanoparticles, Um, and conjugated Um-Al MOF nanoparticles represented by IC50 values. The results were presented as a mean and SEM. a significant versus “control”. b significant versus “Al-MOF”, c significant versus “Um” at p < 0.05
Antioxidant activity of the formulation
Measurement of Antioxidant Activity Exogenous factors and agents, as well as normal metabolic processes, generate free radicals, which can quickly initiate the peroxidation of membrane lipids, resulting in the accumulation of lipid peroxides. A hydrogen free radical is present in DPPH, which exhibits a distinctive absorption at 517 nm. The DPPH test, measuring the decrease of the DPPH radical in the presence of an antioxidant molecule, was used to assess the Um formulations’ in-vitro antioxidant activity. The proton scavenging activity of Al-MOF nanoparticles, both free and loaded with Um, was determined using DPPH in this study. The total DPPH scavenging potential of Al-MOF nanoparticles and Um-Al MOF nanoparticles at various concentrations were determined, and the results are shown in (Fig. 3B). Um exhibited its well-known antioxidant power, scavenging the DPPH radical. Although Al-MOF nanoparticles showed weak antioxidant activity, the conjugation of Um into Al-MOF nanoparticles showed almost complete scavenging of the DPPH radical, indicating enhanced antioxidant properties of Um upon conjugation into Al-MOF nanoparticles.
Anti-inflammatory activity of the formulations
Inhibition of LPS-induced Expression of COX2, IL6, NF-kB p65, and TNFα According to studies, LPS increases the generation of ROS in BV2 cells, which may cause harm to many cellular structures and functional molecules. Additionally, ROS functions as a messenger molecule in cells, triggering signaling pathways and transcription factors like COX2, IL6, NF-kB p65, and TNFα. To elucidate the anti-inflammatory action of Al-MOF nanoparticles, free and Um-Al MOF nanoparticles, the effect on the production of ROS was first evaluated. ELISA was used to validate the protein expression of COX2, IL6, NF-kB p65, and TNFα in LPS-stimulated microglial BV2 cells. ELISA analysis revealed that LPS significantly elevated COX2 expression levels (54.02 ± 2.47), IL6 (140 ± 2.14), NF-κB (4.21 ± 0.06), and TNFα (239.4 ± 16.1) compared to the control group. However, pretreatment with free Um significantly inhibited the increased expression of COX2 (17.23 ± 0.92 vs 54.02 ± 2.47). Although pretreatment with Al-MOF nanoparticles did not affect the increased expression of COX2 (47.59 ± 1.84 vs 54.02 ± 2.47), the conjugated Um exhibited the highest potential inhibitory activity for the increased expression of COX2 (5.45 ± 0.34 vs 54.02 ± 2.47) (Fig. 4A). Similarly, pretreatment with Al-MOF nanoparticles significantly inhibited the increased expression of NF- κB p65 (3.97 ± 0.07 vs 4.21 ± 0.06), free Um (1.34 ± 0.09 vs 4.21 ± 0.06), and conjugate (0.69 ± 0.04 vs 4.21 ± 0.06) (Fig. 4B). Additionally, pretreatment with Al-MOF nanoparticles significantly inhibited the increased expression of TNFα (210.4 ± 6.15 vs 239.4 ± 16.1), free Um (116 ± 3.62 vs 239.4 ± 16.1), and conjugate (61.38 ± 3.51 vs 239.4 ± 16.1) (Fig. 4C). Furthermore, pretreatment with Al-MOF nanoparticles inhibited the increased expression of IL6 (131.5 ± 3.1 vs 140 ± 2.14), free Um (73.96 ± 2.09 vs 140 ± 2.14), and conjugate (59.1 ± 1.72 vs 140 ± 2.14) (Fig. 4D). Notably, the conjugated Um (Um-Al MOF nanoparticles) exhibited the highest potential inhibitory activity for the increased expression of COX2, IL6, NF-kB p65, and TNFα signaling cascades. These results demonstrated that the inclusion of Um in Al-MOF nanoparticles may be useful in improving the bioavailability and bioactivity of Um as an anti-inflammatory agent by inhibiting the stimulation of COX2, IL6, NF-kB p65, and TNFα pathways.
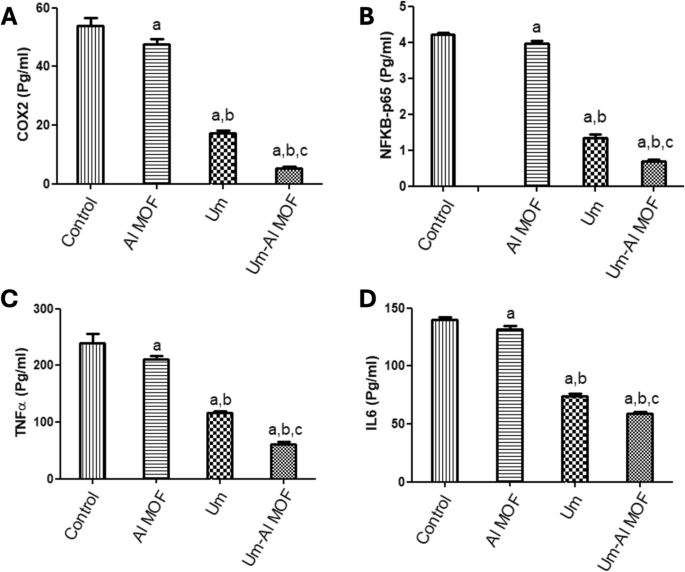
Anti-inflammatory biomarkers expression levels in LPS-stimulated microglial BV2 cells using ELISA. A COX2. B NFkB. C TNFα. D (IL6). The results were presented as a mean and SEM. a significant versus “control”. b significant versus “Al-MOF”, c significant versus “Um” at p < 0.05
In vivowound healing effect of Um-Al MOF in earthworm’s skin model
This study demonstrates significant progress in the wound healing process using Um-Al MOF. Importantly, no worm fatalities were observed during the experiment. On the first day after injury, groups II, III, IV, and V exhibited hemorrhage, edema, redness, and exudation around the wound area. Following treatment, group III showed the fastest coagulation, with complete wound closure occurring within 3 days, compared to 17 days in the untreated group II, nearly 5 days in group IV treated with Um, and over 11 days in group V treated with Al-MOF (Fig. 5). Analysis of data from a representative experiment revealed that on the first day post-wounding, the wound diameters were similar across all groups. However, by day 3 post-wounding, worms treated with Um-Al MOF nanoparticles achieved 100% wound closure (Fig. 6).

Macroscopic observation of the different groups of earthworms (Allolobophora caliginosa) after induction of surgical wounds and examination of wound healing; (A) worms were left untreated to the mercy of natural healing by Vaseline; (B) worms received Um-Al MOF; (C) worms received Um and (D) worms received Al-MOF, cut in the anterior part (circle))

Macroscopic observation of the different groups of earthworms (Allolobophora caliginosa); (A) normal earthworm group I, (B) treated groups II, III, IV and V, (C) Differences among groups regarding wound closure at different experimental periods
Histological observation
When comparing the treated groups with the natural structure of the earthworm (Allolobophora caliginosa); (group I), it appears on the surface that they are composed of the epidermis, among these columnar cells, various gland cells, and beneath them are two muscular layers; the circular muscles, then the longitudinal muscles. It was observed that all groups that received an injury had all the symptoms of inflammation preserved on the first day of the induced injury. Including redness, bleeding, edema, and exudate around the wound area. The skin of earthworms, A. caliginosa on the third day after injury, Masson’s trichrome staining showed in group III, transverse section passing through the body wall showed the normal structure of epidermal, circular, and longitudinal muscles. The transverse section of group II, V of A. caliginosa demonstrated vacuolization, and hypertrophy of epithelial cells, illustrating degeneration of circular with a large amount of inflammatory cell infiltration and longitudinal muscles in addition to vacuolization and hypertrophy of cells. The transverse section of group IV of A. caliginosa inflammatory cells was almost few, the body wall showed the structure of epidermal, circular, and longitudinal muscles. However, there are gaps and disintegration in the installation (Fig. 7). However, from the 3rd to the 17th day post-treatment, a noticeable reduction in collagen deposition was observed in the groups treated with Um and Al MOF, compared to the group treated with Um-Al MOF. The treatment with Um-Al MOF significantly enhanced collagen deposition in the earthworms. Collagen deposition was quantified using ImageJ software, with data collected from three worms in each group. The treatment with Um-Al MOF resulted in collagen levels comparable to those in the control group (Fig. 7, G).

Photomicrographs of the cross section of the different groups of earthworms (Allolobophora caliginosa) after induction of surgical wounds and examination of wound healing; (A) Group I: normal earthworm; (B) worm on the first day of injury, (C) Group II; worms received Vaseline; (D) Group III; worms received Um-loaded Al MOF, (E) Group IV; worms received Um, (F) Group V worms received Al MOF, and (G) Differences among groups regarding % area of collagen deposition at different experimental periods. (Masson’s trichrome stain) The collected data from 10 individual earthworm in each group for quantitative deposition of collagen. + P < 0.05, Control vs. Um-loaded Al MOF, # + P < 0.05 Control vs. Um, # P < 0.05, Control vs. Al MOF group. ((BM); basal membrane, (CM); circular muscle layer, (E); epidermis, (GC); gland cells, (LM); longitudinal muscle layer, (W);Wound)
Electron microscopic observation
Photomicrograph of semithin section of earthworms, A. caliginosa from all groups on the first day displayed a loss of structure, an inclination toward excessive glandular epithelium, and the destruction of the ectodermal layer and cuticular membrane. Additionally, there was a widening of the gaps among longitudinal muscles, likely attributed to the cut’s impact, possibly leading to necrosis. After more than 17 days, group II showed normal architecture and intact nature of circular and longitudinal muscles. Interestingly, group III showed significant wound healing features after three days while group IV took five days and showed less improvement than group III. Semithin section of a group V of A. caliginosa revealed the loss of architecture and showed a tendency to develop an excess of glandular epithelium with the disintegration of the cuticular membrane, ectodermal layer, and expansion of spaces between the longitudinal muscles. The neighboring cells of circular and longitudinal muscles showed proliferation of glandular cells erosion in the ectodermal layer of the body wall and discontinuation of cells (separated by narrow to large gap junctions). It may be due to necrosis depending upon the effect of the cut (Fig. 8).

Photomicrographs of semithin sections of the different groups of earthworms (Allolobophora caliginosa) after induction of surgical wounds and examination of wound healing; (A) Group I: normal earthworm; (B) worm on the first day of injury, (C) Group II; worms received Vaseline; (D) Group III; worms received Um-Al MOF, (E) Group IV; worms received Um, and (F) Group V worms received Al-MOF. (Toluidine blue stain). ((BM); basal membrane, (CM); circular muscle layer, (E); epidermis, (GC); gland cells,, (LM); longitudinal muscle layer,(W);Wound)
The TEM micrographs capturing the skin of A. caliginosa in the control Group I and Group II after 17 days reveal striking details. Surprisingly, the skin of A. caliginosa earthworms treated with Um-Al MOF nanoparticles displayed no significant difference compared to the control group and appeared to Um-Al MOF like tape repair the tissue. The development of capillaries, fibroblasts, and collagen in response to a wound, constituting granulation tissue, was evident. However, clear damage was observed in earthworms from Groups IV and V, with the cuticle initiating degradation, the epidermis showing severe necrosis, and circular muscles undergoing total damage. The intercellular matrix exhibited edema and looseness, facilitating minute vessel extension and the creation of new capillaries. Additionally, the proliferation of fibroblasts was observed in these groups (Fig. 9).
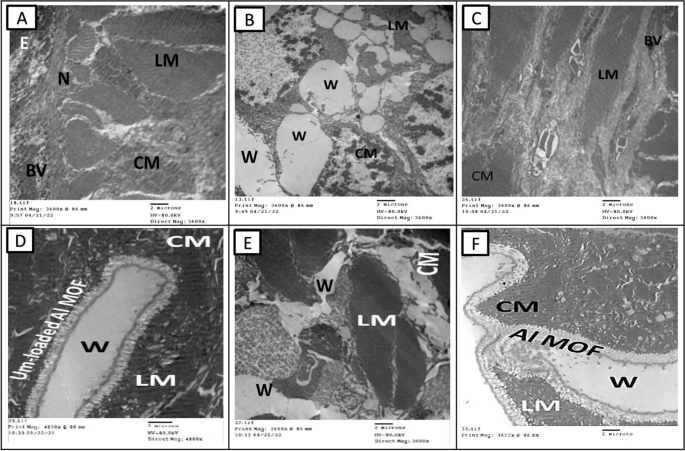
Transmission electron microscopy micrographs of the different groups of earthworms (Allolobophora caliginosa) after induction of surgical wounds and examination of wound healing; (A) Group I: normal earthworm, (B) worm on the first day of injury, (C) Group II; worms received Vaseline; (D) Group III; worms received Um-Al MOF, (E) Group IV; worms received Um, and (F) Group V worms received Al-MOF. ((CM); circular muscle layer, (E); epidermis,, (LM); longitudinal muscle layer,(W);Wound,(BV); Blood vessel, (N); Nucleus)

Add Comment