


Permethrin is brain-penetrant and bioavailable
To confirm the permeability of permethrin through the BBB and characterize its temporal properties after exposure, we conducted pharmacokinetic analysis by evaluating parameters such as time of maximum concentration (Tmax), the maximum drug concentration (Cmax), and area under concentration-time curve (AUC). The time courses of permethrin, comprising a combination of cis- and trans-isomers, along with primary metabolite 3-phenoxybenzoic acid (3-PBA), were assessed in both plasma (Fig. 1A, B and C) and brain (Fig. 1D, E and F) over a 48-hour period following a single injection of 200 mg/kg permethrin. We first observed a “double-peak” phenomenon in both plasma and the brain at 2 h and 24 h (Fig. 1). Notably, the plasma exhibited a distinctly double-peak curve, a characteristic often associated with entero-hepatic recycling (Fig. 1A, B and C). This result indicates an increased elimination half-life, contributing to the extended action of permethrin in plasma and brain. The average plasma concentrations of cis- and trans- permethrin reached their peak at 24 h (Fig. 1A and B). Cis-permethrin displayed a Cmax of 12655.89 ± 2646.10nM (Fig. 1B), and trans-permethrin exhibited a Cmax of 9025.79 ± 3351.66 nM (Fig. 1A) in the plasma. In contrast, the mean brain concentrations of cis- and trans-permethrin peaked at approximately 2 h, indicating penetration of cis- and trans-permethrin into the brain occurs rapidly (Fig. 1D and E). For cis-permethrin, the mean Cmax in the brain was 20637.85 ± 4786.71 nM (Fig. 1E), and for trans-permethrin, it was 20878.55 ± 3137.16 nM (Fig. 1D), both of which were higher than the concentrations observed in plasma. Additionally, we analyzed 3-PBA, the primary metabolite of permethrin, considering its rapid metabolism in the liver. As anticipated, a higher Cmax (Figs. 1C and 68951.01 ± 12672.51 nM) was observed in the plasma. However, in the brain, the Cmax of 3-PBA was found to be significantly lower than in the plasma (Figs. 1F and 668.43 ± 53.35 nM). Notably, we observed a sustained accumulation of 3-PBA in the brain parenchyma extending beyond 48 h. After reaching their peak concentrations, the mean concentration-time profiles of cis-permethrin, trans-permethrin, and 3-PBA indicated a steady decline over a period of 48 h. These findings suggest that both cis- and trans-permethrin rapidly entered the brain from periphery, achieving higher concentrations and indicating a concentrated distribution within the brain.
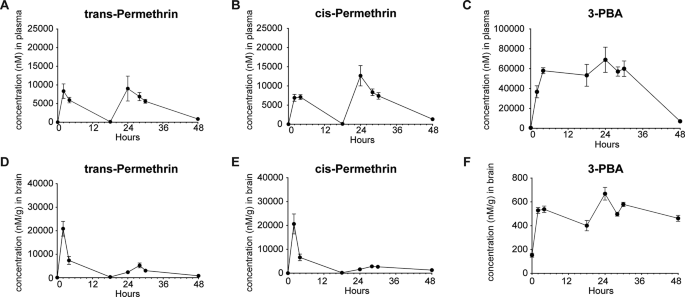
Brain and Plasma Concentrations over time. (A) Plasma levels of trans-Permethrin reached a maximum concentration at 24 h after acute injection (I.P.) of 200 mg/kg of permethrin. (B) Plasma levels of cis-Permethrin also reached a maximum concentration at 24 h. (C) Similarly, plasma levels of the permethrin metabolite 3-PBA reached a maximum concentration 24 h after injection. (D) Brain tissue levels of trans-Permethrin reached a maximum concentration at 2 h after acute injection. (E) Brain tissue levels of cis-Permethrin also reached a maximum concentration at 2 h after acute. (F) Brain tissue levels of the permethrin metabolite 3-PBA reached a maximum concentration at 24 h after acute injection. In each group, there were 5 mice, and for brain tissue, 2 replicates (separate brain hemispheres) were utilized per time point. The data are presented as means ± SEM
Permethrin exposure primes the onset of depression-like behavior under stress through microglia activation
To examine the effects of permethrin exposure as a priming factor, mice were exposed to permethrin (200 mg/kg) or a vehicle control for 14 days (Fig. 2A). Mice were subsequently subjected to either stress or gentle handling (no stress) for 7 days (Fig. 2A). Following our experimental protocol, anxiety-like behaviors and locomotion activity were evaluated using the OFT (Fig. 2B), while depressive-like behavior was assessed through the FST (Fig. 2C and D) to examine neuropsychological responses. There were no significant changes in the distance traveled, which is a measure of locomotion activity, or in the time spent in the center zone, which is indicative of anxiety-like behavior, across all experimental groups (Fig. 2B). In the FST, neither permethrin exposure nor stress exposure alone led to observable behavioral alterations in immobility time when compared to non-stressed mice treated with the vehicle (Fig. 2C). Interestingly, mice subjected to stress and treated with permethrin exhibited a significant increase in the time spent immobile, in comparison to all other experimental groups (Fig. 2C, *p < 0.05, **p < 0.01, ***p < 0.001). This finding suggests that exposure to permethrin acts as a priming factor in the brain, subsequently leading to depression-like behavior in mice under these specific conditions when stress is introduced.

Permethrin primes stress response to induce depressive-like behavior. (A) Experimental scheme. (B–C) Exposure to permethrin followed by stress induced depressive (C) but not anxiety-like (B, right panel) behaviors as measured via forced swim and open field tests respectively. (B, left panel) Bar graphs showed locomotion activity with no alterations among all experimental groups. (D) Cx3Cr1CreeEr/hM4Di-DREADD mice expressing the Gi receptor on microglia were used to demonstrate that microglial inhibition via selective ligand JHU 37,160 is sufficient to prevent behavioral changes resulting from permethrin and stress exposure. Statistical analyses were performed using Two-Way ANOVA (*p < 0.05, **p < 0.01, ***p < 0.001, ****p < 0.001, compared to permethrin exposure followed by stress). In each group, there were13 mice and each dot represents an individual mouse. Data are expressed as the means ± SEM
Next, we utilized Cx3cr1CreER/WT: R26LSL − hM4Di/WT mice to explore the impact of permethrin-induced microglia priming on the observed depression-like behavior. This mouse model is designed to selectively express Gi-inhibitory receptors (Gi-DREADDs) in microglia, controlled by the inducible Cx3cr1 promoter. Mice underwent daily treatment with 0.1 mg/kg of JHU 37160, a novel DREADD agonist known for selectively activating the Gi inhibitory signaling pathway in microglia, throughout the initial 14-day period of permethrin exposure (Fig. 2A). Following this treatment phase, the mice were then subjected to 7 days of stress, and then the FST was performed (Fig. 2A). The observed results were consistent with previous behavioral tests (Fig. 2C), indicating that mice exposed to stress and treated with permethrin displayed a notable increase in the time spent immobile (Fig. 2D, ****p < 0.0001). Notably, treatment with JHU 37160 during permethrin exposure effectively blocked depressive like-behavior in the FST (Fig. 2D, ***p < 0.01). These result indicates that microglia activation is a key mediator of the depressive-like behavior following exposure to permethrin followed by stress.
Permethrin exposure, followed by stress, induces regional differences in the pleomorphic response of microglia cells
Pro-inflammatory microglia have been observed to undergo deramification, a process characterized by the retraction of their processes, diminished microglial complexity, and the release of inflammatory cytokines [28]. In order to further investigate the morphometric changes in microglial cells resulting from exposure to permethrin followed by stress, we conducted a detailed analysis of morphology encompassing parameters such as soma volume, branch length, the number of terminal points, and the number of intersecting segments. Additionally, we conducted a comparative analysis across the hippocampus and PFC to assess regional differences in microglial alterations.
Interestingly, the volume of microglia in hippocampus significantly decreased in mice subjected to both permethrin treatment and stress compared to mice exposed only to permethrin (Fig. 3A and B, **p < 0.01). In addition, the mice subjected to permethrin treatment and stress showed a significant decrease in the branch length of microglial processes (Fig. 3A and C, *p < 0.05, **p < 0.01), accompanied by a noticeable reduction in the number of terminal points in hippocampus (Fig. 3A and D, *p < 0.05). Sholl analysis further revealed that microglia from the group exposed to both permethrin and stress exhibited fewer and less expansive branches compared to other experimental groups (Fig. 3E). Additionally, quantification of the area under the curve further confirmed the significant decrease in microglial branching caused by permethrin and stress (Fig. 3E and F, *p < 0.05, **p < 0.01). However, no discernible morphological alterations were observed in microglia in the PFC, encompassing soma volume (Fig. 3G and H), branch length (Fig. 3G and I), terminal points (Fig. 3G and J), intersection of segments (Fig. 3G and K) and area under cover (Fig. 3G and L).

Alterations in microglial morphology induced by permethrin and stress in brain, specifically in the hippocampus prefrontal cortex. (A) Representative immunofluorescence images of IBA-1+ (red) cells in hippocampus. (B–D) Bar graphs represented soma volume (B), branch length (C) and number of terminal points (D) per microglia in hippocampus. (E–F) Sholl analysis showed that microglia in the group exposed to both permethrin and stress displayed reduced branching complexity compared to other experimental groups. (E) Link graph showed the quantification of the number of intersections at increasing radii, with measurements taken at 5 μm intervals. (F) Bar graph represented the Area Under the Curve (AUC) of the line graphs shown in (E). (G) Representative immunofluorescence images of IBA-1 + cells in prefrontal cortex. (H–J) Sholl analysis showed that microglia in the prefrontal cortex exhibited no apparent morphological changes. Bar graphs represented soma volume (H), branch length (I) and number of terminal points (J) per microglia in prefrontal cortex. (K) Link graph showed the quantification of the number of intersections in the prefrontal cortex. (L) Bar graph represented the AUC of the line graphs. The area outlined with a white box in the top panel is magnified in the middle panel. The bottom panel shows representative images of three-dimensional (3D) reconstructions of microglia from the middle panel Scale bars indicate 50 (top panel) and 5 (middle and bottom panel) um. Statistical analyses were performed using Two-Way ANOVA (*p < 0.05, **p < 0.01, compared to permethrin exposure followed by stress. In each group, there were 4-5mice and each dot represents an individual mouse. Data are expressed as the means ± SEM
These findings underscore the importance of regional specificity in understanding neuroinflammatory responses, particularly in the hippocampus, where permethrin treatment acts as a priming factor, subsequently leading to depression-like behavior in mice under stress conditions.
Single-cell sequencing provides profiling of distinct brain cell populations
To investigate whether the observed microglial morphometric changes in the hippocampus are accompanied by a genetic profile indicative of neuroinflammation, we conducted single-cell RNA sequencing analysis using 21,566 single nuclei collected from the hippocampus of mice (Figs. 4, 5 and 6).

Characterization of GWI-associated brain cell population through single-cell sequencing. (A) UCDSelect was used to project annotations from a reference mouse cortex / hippocampus atlas onto novel dataset. Microglial cluster was confirmed by expression of canonical marker genes, including inpp5d, Tgfbr1, Apbb1ip. (B) Cell density plots for each experimental group depict a uniform distribution of cell density, with increasing intensity of red indicating specificity to the respective condition. (C) Differential expression analysis against predicted clusters to identify conserved markers specific to each putative cell annotation

The microglia population exhibits significant enrichment in pathways linked to axon development, calcium ion transport, and neurotransmission. (A and B) Bubble plots of Gene Ontology (GO) category enrichment results in microglia cell populations for biological process (A) and molecular function (B). The color of the points reflects the − log10 adjust p-value, with more significant p-values appearing as more intensely colored points. The size of each point corresponds to the percentage of gene sets within each GO category, with larger points indicating a higher percentage. (C) Venn diagram showing the number of overlapping significantly differentially expressed genes (DEGs) specifically enriched under different conditions: vehicle exposure followed by stress (green), permethrin exposure followed by no stress (red), and permethrin exposure followed by stress (pupple) (left panel). The middle panel shows the number of overlapping DEGs after sorting by an absolute z-score greater than 8.8 in the permethrin exposure followed by stress condition, and then how many genes are shared across the different experimental conditions. The right panel shows the log2 fold change values of selected DEGs expressed in the permethrin exposure followed by stress and permethrin exposure followed by no stress conditions

CA3 neuronal cell population exhibits significant enrichment in pathways linked to synaptic plasticity. (A) Venn diagram showing the number of overlapping significantly differentially expressed genes (DEGs) in DG, CA1, CA2, and CA3 regions specifically enriched under different conditions: vehicle exposure followed by stress (green), permethrin exposure followed by no stress (red), and permethrin exposure followed by stress (purple) (left panel). (B) Bar graphs represent the number of total genes altered and the proportion of genes represented in the Venn diagram showing the overlapping significantly DEGs within DG, CA1, CA2, and CA3. (C and D) Bubble plots of GO category enrichment results in neuronal cell populations in CA3 for biological process (C) and molecular function (D). The color of the points reflects the − log10 adjust p-value, with more significant p-values appearing as more intensely colored points. The size of each point corresponds to the percentage of gene sets within each GO category, with larger points indicating a higher percentage
UniCell Deconvolve Base (UCDBase) was employed to produce an initial unbiased cell type annotation, assessing cell type fractions across different conditions as previously reported [29]. Subsequently, UniCell Deconvolve Select (UCDSelect) was utilized to transfer annotations from a reference mouse cortex/hippocampus atlas onto the novel dataset (Fig. 4A) We then compared the density distribution of cell types by sample, highlighting condition-specific differences in cell type fractions post-batch correction among all experimental groups. It revealed that all experimental groups exhibited a similar density distribution, indicating a consistent profiling of distinct brain cell populations across all groups (Fig. 4B). The identity of the microglial cluster was confirmed by the expression of canonical microglia marker genes, including inpp5d, Tgfbr1, Apbb1ip. Additionally, the identity of neuronal cells was confirmed by the expression of canonical neuronal marker genes such as Dsp, Olfr538, Cpne4m for DG, Galntl6, Gm2164, Gm2115 for CA1, Tafa1,m zfp804a for CA2, Cce1, Mndal, Slc9a4 for CA3 (Fig. 4C). These results confirm the identity of the identified clusters as microglia and neuronal cells, supported by the expression of canonical marker genes characteristic of each cell type using UCDBase analysis, thereby supporting the accuracy of cell type annotation.
Transcriptome analysis reveals alterations in gene expression specific to microglia following exposure to permethrin, followed by stress
To elucidate the transcriptional networks impacted within microglia populations associated with depression-like behavior in mice exposed to permethrin and/or stress, we conducted a functional enrichment analysis, encompassing biological process (Fig. 5A) and molecular function (Fig. 5B). In Fig. 5A, we compared the biological processes selected based on adjusted p-values of < 0.05. While minimal changes were evident in the stress group, both permethrin exposure alone and in combination with stress showed similar alterations in biological processes. Notably, the permethrin with stress condition exhibited heightened significance and involvement of a greater number of gene sets in the same biological processes compared to permethrin-only group. Specifically, microglia cell population in permethrin with stress group displayed enriched biological processes associated with neuronal development (axon development, axon guidance, and the ephrin receptor signaling pathway), neuronal communication (calcium signaling, synaptic transmission, and glutamate receptor activity), as well as neuronal morphogenesis. In the assessment of molecular functions (Fig. 5B), a consistent trend emerged where minimal alterations were observed in the stress group, whereas both the permethrin-only and permethrin combined with stress groups exhibited similar patterns. Notably, within the permethrin with stress group, distinct molecular activities were noted, including ionotropic glutamate receptor activity and ligand- or voltage-gated calcium channel activity. These findings underscore parallels in biological processes concerning neuronal signaling, ion channel modulation, and synaptic transmission.
Subsequently, we investigated differentially expressed genes (DEGs) to discern variations between permethrin treatment alone and permethrin treatment with stress. In Fig. 5C, notable modifications in gene expression were observed, with 2,949 genes in the permethrin and stress group and 2,354 genes in the permethrin-only group exhibiting significant alterations compared to the vehicle group without stress (adjusted p-value < 0.05, Fig. 5C, left). Moreover, 232 genes were exclusively altered in the permethrin-only group, while 845 genes uniquely changed in the permethrin and stress group, suggesting that the permethrin with stress group exhibited more significant gene alterations. Following, utilizing the absolute Z score, we identified the top 100 genes in the permethrin with stress group (Fig. 5C, middle). It was observed that only 5 genes such as Dlgap1, Trank1, Tafa5, Calr, Rtn1 were exclusively expressed in the permethrin with stress group (Fig. 5C, right). Additionally, 87 genes showed differential expression in both groups, with the permethrin with stress group exhibiting a significantly more pronounced increase or decrease in expression compared to the permethrin-only group. Notably, 6 genes such as Epha6, Lyn, Egfem1, Faah, Klhl3 and Fat2 displayed the most substantial changes, with their expression levels in the permethrin with stress group being 1.4-fold higher or lower than those observed in the permethrin-only group (Fig. 5C, right). Overall, the results highlight the potential synergistic impact of permethrin and stress on microglia gene expression, which could contribute to the underlying mechanisms involved in depression-like behavior observed in the animal model (Fig. 2).
Permethrin exposure followed by stress induces a significant alteration in gene expression patterns across regionally distinct neuronal populations
To investigate how permethrin exposure followed by stress impacts transcriptional networks in neuronal cells, which functions are potentially mediated by microglia, in hippocampal regions including CA1, CA2, CA3, and DG, we first compared the number of DEGs across groups: permethrin exposure followed by no stress, permethrin exposure followed by stress, and vehicle exposure followed by stress (Fig. 6A and B). Adjust p-value threshold of 0.05 was used to identify DEGs in CA1, CA2, CA3, and DG of the hippocampus in mice from each group. Interestingly, permethrin exposure followed by stress displayed a significantly higher number of DEGs compared to the other groups in all hippocampal regions (Fig. 6A). Analysis of hippocampal regions CA1, CA2, CA3, and DG following permethrin exposure and subsequent stress revealed a prominent increase of DEGs, with CA1 exhibiting the most notable rise compared to other regions, followed by CA3. (Fig. 6A). Given the observed differences in microglial alterations between the permethrin-exposed groups with and without stress (Fig. 5), we specifically compared gene expression in these groups. Among hippocampal regions, only CA3 region exhibited a high percentage of unique expression in DEGs in the permethrin exposure followed by stress group. 62.87% were unique to the permethrin with stress group, while 29.89% were common to both permethrin exposed groups (with or without stress), and only 7% were specific to the permethrin without stress group (Fig. 6B).
To further explore the functional implications of the observed gene expression alterations in CA3 region, we conducted Gene Ontology (GO) enrichment analysis, specifically comparing the permethrin exposure followed by no stress and permethrin exposure followed by stress groups (p < 0.05, Fig. 6C and D). Compared to the permethrin exposure followed by no stress group, the permethrin exposure followed by stress group in CA3 region showed significantly enriched GO terms (Fig. 6C) related to signal transduction, including modulation of chemical synaptic transmission, regulation of neurotransmitter receptors, and regulation of postsynaptic neurotransmitter receptor activity. Notably, even for shared biological processes, permethrin with stress group displayed a greater number of genes and a more significant level of enrichment. We then focused on the molecular function of DEGs using GO enrichment analysis (p < 0.05, Fig. 6D). GO enrichment analysis of DEGs revealed a significant enrichment for molecular function terms (p < 0.05, Fig. 6D). The permethrin exposure followed by stress group exhibited a notably greater abundance of enriched terms compared to the permethrin exposure followed by no stress group, including synaptotagmin-1 binding, amino acid sodium symporter activity, and volume-sensitive anion channel activity. (Fig. 6D). Overall, this results indicate that permethrin exposure followed by stress triggered a prominent rise in differentially expressed genes, particularly in CA1 and CA3, with CA3 region exhibiting distinct patterns suggestive of disrupted neuronal communication.
Exposure to permethrin followed by stress altered protein expression associated with neuroinflammation and synaptic plasticity
To investigate the proteomic alterations in mice subjected to permethrin exposure followed by stress, we examined the abundance of a specific set of 92 proteins associated with essential biological functions using proximity extension assay-based Olink technology. We identified significant alterations in the levels of six proteins specifically within the hippocampi of mice exposed to permethrin followed by stress (Fig. 7).

Olink proteomic analysis in the GWI mouse model. (A–F) Box graphs represented significant changes in protein expression levels of TGFα (A), Ahr (B), IL-1β (C), RGMa (D), Snap29 (E), and Ddah1 (F) in the hippocampus across all experimental groups. Statistical analyses were performed using Two-Way ANOVA (*p < 0.05; **p < 0.01, ***p < 0.001; ****p < 0.0001; compared to the permethrin followed by stress group, n = 7–9 mice for each group). Data are expressed as the means ± SEM
Specifically, there was a notable increase in Transforming growth factor alpha (TGF-α) in mice exposed to permethrin followed by stress compared to other experimental groups (*p < 0.05, Fig. 7A). Additionally, Aryl hydrocarbon receptor (Ahr), known for its involvement in regulating microglial activation and neuroinflammation, showed elevated levels in the same mice (****p < 0.0001, ***p < 0.001, **p < 0.01, Fig. 7B). Concurrently, there was a decrease in the expression of Interleukin-1beta (IL-1β) (*p < 0.05, Fig. 7C).
Repulsive guidance molecule A (RGMa), renowned for its capacity to inhibit neurite growth and newborn neuron survival in the adult dentate gyrus, demonstrated notable upregulation in the permethrin followed by stress group compared to the other experimental groups (**p < 0.01, Fig. 7D). Additionally, Synaptosomal-associated protein 29 (Snap-29), responsible for impeding SNARE complex disassembly and thereby diminishing synaptic transmission, exhibited heightened expression in the permethrin followed by stress group relative to both the no stress and stress alone groups (**p < 0.01, *p < 0.05, Fig. 7E). Conversely, N(G), N(G)-dimethylarginine dimethylaminohydrolase 1(Ddah1), a hydrolase responsible for regulating genes associated with the synthesis and transportation of acetylcholine, exhibited significant decrease in expression in the permethrin followed by stress group (**p < 0.01, Fig. 7F). These findings highlight the multifaceted effects of permethrin exposure followed by stress on both inflammatory responses and synaptic plasticity within the hippocampi of mice, underscoring the complex interplay between microglia activation and neuronal function.
Add Comment