Microbial community composition
We retrieved 4782 ASVs, covering 65 microbial phyla, 147 classes, 203 orders, 232 families and 247 genera (Table S2). The most abundant phylum, across all the samples, was Nanoarchaeota, followed by Campylobacterota, Pseudomonadota, Bacteroidota, Verrucomicrobiota and Crenarchaeota (total abundance > 5000 reads) (Table S2). Regarding the genera, Sulfurimonas had the highest abundance, followed by Candidatus Omnitrophus, Sulfurovum and Nitrosarchaeum (each one with a total abundance > 4000 reads; with 99,660 ASVs not identified at genus level) (Table S2). Richness of microbial community showed a growing trend, and it was significantly higher with the increase of salinity (NB-GLM: p = 8.26 × 10⁻⁵) (Fig. S2A). The salinity was also a relevant driver in shaping the microbial community composition and explained 49.6% of sample variance (PERMANOVA: p = 0.0028). Indeed, in the tree depicting sample composition, SC1 isolated in a branch (Fig. S2B). Then, SC2 separated from the other samples, with SC3 clustered with SC4 and SC5 with SC6 (Fig. S2B).
Resistome composition
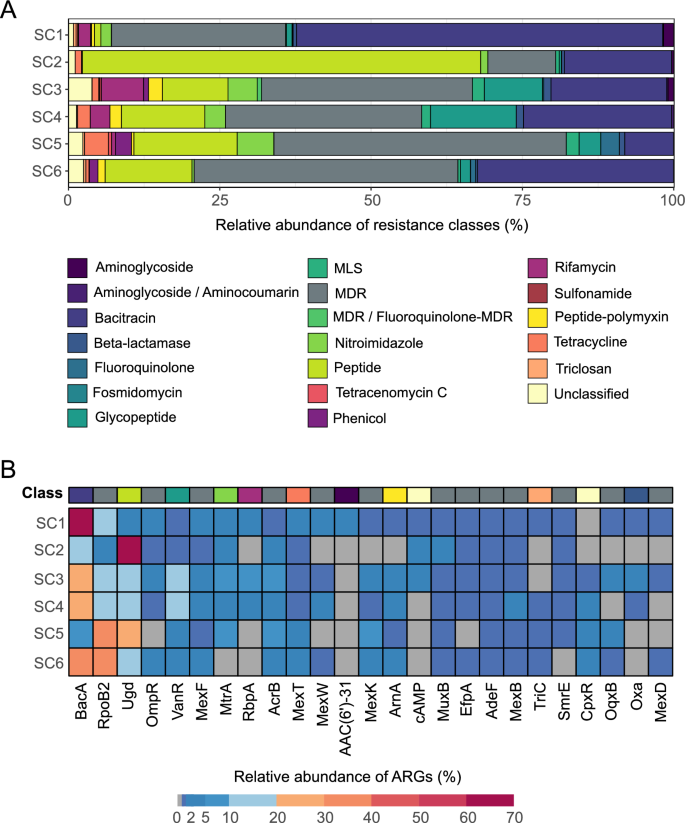
ARGs were annotated in all samples. We identified 130 ARGs, belonging to 20 different resistance classes (Fig. 2A, Table S3). The resistance against the bacitracin was the most represented resistance class, across all the samples, followed by multidrug, peptide, glycopeptide, and rifamycin resistance (Fig. 2A, Table S3). Considering the single genes, bacA (encoding resistance against bacitracin) had the highest abundance, followed by rpoB2 (a multidrug resistance, MDR, gene), ugd (encoding resistance against peptides), ompR (an MDR gene) and vanR (encoding resistance against glycopeptides) (Fig. 2B, Table S3). Only the aminoglycoside resistance genes significantly varied according to the salinity gradient, decreasing at high salt concentrations (LM: p = 0.0386). No significant patterns were observed for the other resistance classes (LM: p ≥ 0.0606). Total ARG abundances were significantly lower for higher salinities (LM: p = 0.03205). Richness of the resistome did not significantly differ along the salinity gradient (NB-GLM: p = 0.113), even if a decreasing trend was observed (Fig. S3A). However, when looking at the beta-diversity, the salinity, as factor, explained 42.6% of the resistome composition (PERMANOVA: p = 0.0028). Again, in the compositional tree, samples clustered based on the salinity (Fig. S3B). The resistome composition resulted significantly and strongly correlated with the microbial community structure (MANTEL TEST: r = 0.88; p = 0.0028).
Relative abundances of antimicrobial resistance classes and genes per sample based on the reads analysis. The composition of samples according to A antimicrobial resistance classes and B top 25 most abundant ARGs. The top 25 most abundant ARG were filtered out, and based on their total sum, their relative abundance per depth was calculated
Community stratification of ARG-carrying MAGs in the anchialine environment
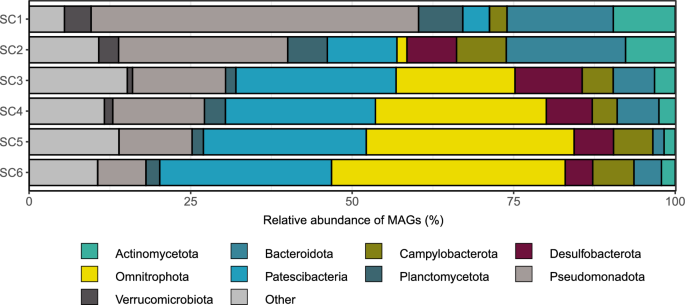
In the Sarcophagus Cave’s anchialine system 418 MAGs (CheckM completeness ≥ 50%, contamination ≤ 10%) spanning 35 different phyla were identified (Fig. 3). We observed a shift in the community structure at the second sampling layer (SC2) in the cave, coinciding with the halocline and oxycline (Table S1). This resulted in strong community stratification, with anoxic layers dominated by MAGs attributed to Archaea, Patescibacteria, and Omnitrophota (Fig. S3).
In this study, we aimed to explore the potential presence of antibiotic resistance genes (ARGs) in this unique ecosystem. Our initial screening for ARG presence across the 418 MAGs obtained from the depth profile was performed with 3 diverse tools, based on their distinct modes of search for ARG sequences. All strict CARD hits (290) were kept for further analysis, while from the loose hits only those confirmed with DeepARG and/or farGene were selected. This yielded 578 potential ARG sequences from 230 MAGs in the anchialine cave (Table S4). Compared to the overall MAG community, certain exceptions were observed, such as the phylum Aenigmatarchaeota, which lacked any representative carrying ARGs, and Iainiarchaoeta and Nanoarchaeota, with only one detected ARG each (Fig. S4). Interestingly, Campylobacterota was frequently annotated among the retrieved MAGs at all depths (except at SC1) and in MAGs harboring ARGs (Fig. S4). Furthermore, as depth increased, the proportion of ARG-containing MAGs with Pseudomonadota (synonym Proteobacteria), Bacteroidota and Actinomycetota (synonym Actinobacteriota) decreased (Fig. 3). On the other hand, the proportion of Patescibacteria and Omnitrophota increased at depths SC3–SC6 compared to SC1-SC2.
Among the ARG carriers, 26 phyla were identified, including three from the Archaea domain (Iainarchaeota, Nanoarchaeota, and Thermoplasmatota) (Fig. S5A). Patescibacteria (21.7%), Omnitrophota (20.4%), Pseudomonadota (19.6%), Bacteroidota (8.3%), Desulfobacterota (6.5%), Campylobacterota (3.9%), altogether accounted for 80% of total ARG-carrying MAGs. Particularly rich in ARGs were Desulfobacterota and Pseudomonadota (> 90% of their MAGs contained at least 1 ARG sequence). Most of the ARG-carrying MAGs (82%) were classified up to the family level, while 50% remained unclassified at the genus level (Table S4).
In terms of classes, ARG-carrying MAGs were assigned to a total of 61 classes. Bacterial classes such as Koll11 (Omnitrophota), Gammaproteobacteria (Pseudomonadota), ABY1 (Patescibacteria), Bacteroidia (Bacteroidota), Alphaproteobacteria (Pseudomonadota), and Paceibacteria (Patescibacteria) collectively carried 61% of all ARG-carrying MAGs in the anchialine environment (Fig. S5B).
Mechanisms and classes of antibiotic resistance in diverse phyla
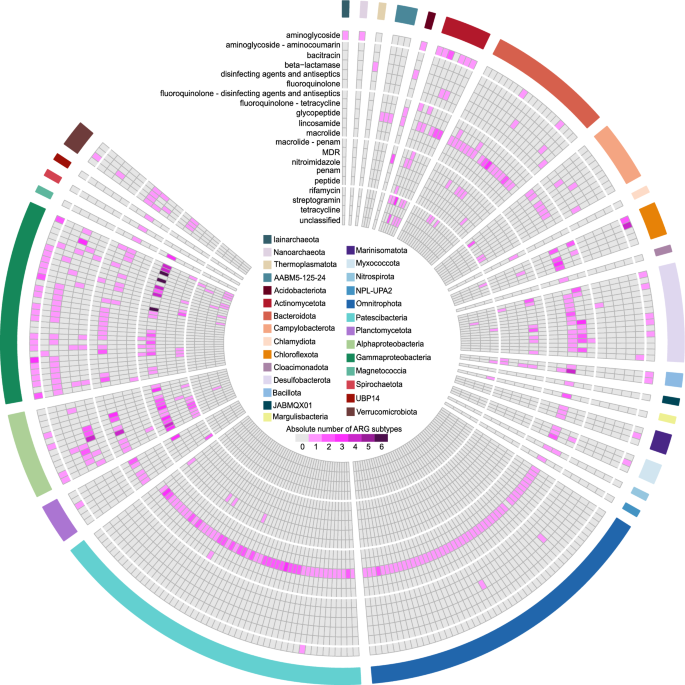
Our analysis revealed a wide range of resistance classes carried by different phyla. Pseudomonadota (Alphaproteobacteria and Gammaproteobacteria) were found to carry genes encoding for the resistance against multidrug, fluoroquinolone, tetracycline, aminoglycoside, bacitracin, β-lactam, and macrolide-licosamide-streptogramin (MLS). In contrast, Patescibacteria and Omnitrophota had a nearly exclusive prevalence of the glycopeptide resistance class. Indeed, resistance against glycopeptide was the most dominant class (70% of ARG-carrying MAGs), followed by MDR (24% of ARG-carrying MAGs), aminoglycoside (21.7%), and fluoroquinolone/tetracycline (20.9% MAGs) resistance classes (Fig. 4).
The association between antibiotic resistance gene (ARG) resistance classes (according to CARD terminology) and taxonomic composition of the microbial community at the phylum level based on the ARG-carrying MAGs. Phyla of MAGs are displayed on the outer circos layer. Pseudomonadota are presented as classes (Gammaproteobacteria, Alphaproteobacteria and Magnetococcia). Archaea are presented as phyla Iainarchaeota, Nanoarchaeota, and Thermoplasmatota. MDR multidrug–resistance; confers resistance to at least three different drug classes)
Multiple antibiotic resistance mechanisms were found with all detected ARGs falling into the following categories based on CARD terminology: antibiotic target alteration (246), antibiotic efflux (201), antibiotic inactivation (91), reduced permeability to antibiotic (18), antibiotic target protection (2), and a combination of these mechanisms (Table S5).
Diversity, distribution, and environmental drivers of ARGs
We obtained 578 potential ARGs which were manually checked for conserved domains (Table S6). Of the 578 ARGs identified, the majority (232 ARGs; 40%) were found in Pseudomonadota. These were split between Gammaproteobacteria (27%) and Alphaproteobacteria (13%). Patescibacteria accounted for 77 ARGs (13%), Omnitrophota for 49 ARGs (8.5%), and Desulfobacterota for 45 ARGs (7.8%). All other detected phyla represented less than 7% of the total number of ARG-carrying contigs (Table S4).
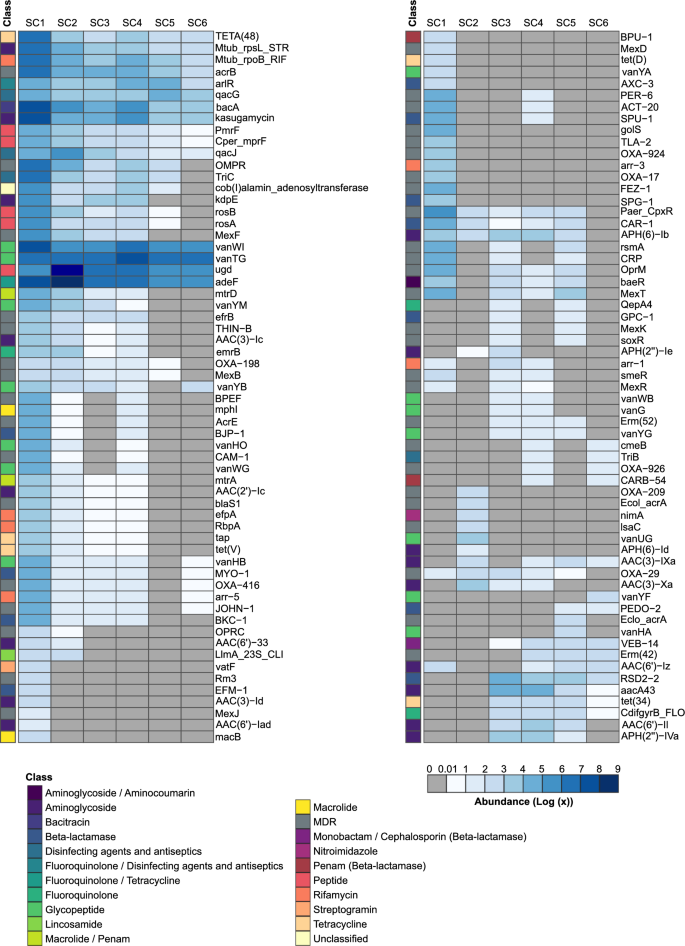
The top three most abundant ARGs present at all sampling depths were those from the vancomycin resistance gene cluster (vanTG and vanWI) and the efflux pump gene adeF (Table S4, Figs. 5, S6A). Overall, fourteen vancomycin resistance gene sequences were detected (they are part of the vancomycin resistance gene clusters).
Heatmap of antibiotic resistance genes (ARGs) for six sampling sites (SC1-SC6). The abundance of ARGs was quantified and normalized based on the abundance of a particular ARG-containing MAG at a specific sampling depth. Rows were clustered using the “complete” method with the pheatmap function (presented in Fig. S6A)
The shallowest sampling depth (SC1) with surface freshwater, contains most ARGs and, in contrast to other depths, the most dominant resistance classes were aminoglycoside and MDR genes. At the second sampling depth, SC2, still above the halocline, resistances to peptide and fluoroquinolone/tetracycline were the dominant classes, while the other four sampling depths (under the halocline) were populated with glycopeptide, fluoroquinolone/tetracycline, and peptide resistance classes (Fig. 5). The diversity of ARGs also changes between different sampling depths, with SC1 having the most diverse ARG composition (with 19 unique ARGs) and SC6 the lowest (1 unique). Fifteen ARGs are shared across depths, representing a core anchialine resistome (Fig. S6B).
We used Pearson’s correlation analysis to investigate the relationship between salinity and ARGs across sampling depths. The analysis revealed a strong negative correlation between salinity and the relative abundance of ARGs in water layers, suggesting that the abundance of ARGs decreased as salinity levels increased (Pearson’s correlation; R = − 0.95, p = 0.004, Fig. S7A). Moreover, there was a negative correlation between the relative abundance of ARGs and the richness of MAGs at the family level (Pearson’s correlation; R = − 0.84, p = 0.037, Fig. S7B), while no correlation was observed at the genus level. Finally, we conducted VPA to quantify the relative contribution of salinity to the microbial community with ARGs (Fig. S8). VPA analysis revealed that the dissimilarity in the microbial community with ARGs along the depth was strongly related to salinity (43.2%).
The potential of MGEs in the dissemination of cave ARGs
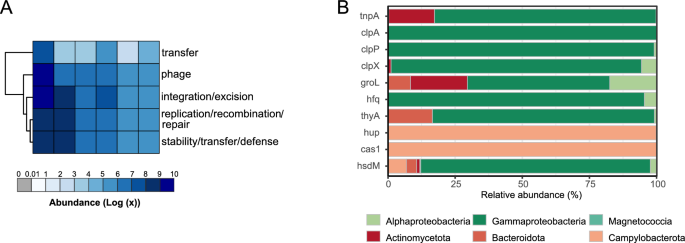
In our initial analysis, we employed PlasFlow, Integron finder, and ISEScan to search for MGEs associated with ARG-carrying contigs. We found that a limited number of MGEs were detected, with 21 ARG-carrying contigs identified as of plasmid origin (3.9% of total contig count), 412 were of chromosomal origin and 105 were unclassified. The plasmid-associated ARGs were primarily attributed to Pseudomonadota and Bacillota (synonym Firmicutes) and primarily involved the antibiotic efflux resistance mechanism. We also identified a small number of CALIN elements (n = 4) lacking integrin—integrases (2–7 attc sites) associated with ARG-carrying sequences. Only in one case the detected CALIN element was located within the proposed 12 kb ARG flankings [40]. Complete integrons were not detected in ARG—carrying contigs. Insertion sequences (ISs) were found in 54 ARG—carrying contigs. In total, we classified 6 ARG (2 vanTG, 2 adeF, 1 vanWI, and 1 ugd) as IS-associated (11% of all detected ISs). To further explore the potential mobility of ARGs, we conducted an extended analysis using BLASTp against the mobileOG-db, a curated database of bacterial mobile genetic elements. Despite employing quite stringent e-value (1e-10), query coverage (80%), and identity (80%) thresholds, this approach revealed a much more comprehensive picture of MGEs within the ARG-carrying microbial community. We obtained 567 MGE-related protein sequences which were categorized into five main MGE categories: phage specific biological processes (175), integration and excision from one genetic locus to another (145), replication, recombination, or nucleic acid repair (98), element stability, transfer, or defense (77), and interorganism transfer (72) (Fig. 6A). There were 153 unique MGE-related proteins found in 37% of ARG-carrying MAGs (Fig. S9). The top 10 MGE-related proteins were hup, cas1, tnpA, groL, clpX, hsdM, hfq, clpA, thyA, with the unclassified (category integration/excision) being the most abundant (Table S7). They mostly belonged to Pseudomonadota (Gammaproteobacteria) and Campylobacterota (Fig. 6B). As in the case of ARGs, Pearson’s correlation analysis revealed a strong negative correlation between salinity and relative abundance of MGEs in water layers, suggesting that their abundance decreased as salinity levels increased (Pearson’s correlation; R = − 0.89, p = 0.0016, Fig. S7C). Moreover, the absolute number of ARGs positively correlated with the presence or absence of a particular MGE type in a specific layer (Fig. S7D).
Distribution and taxonomic composition of mobile genetic elements (MGEs) in the anchialine cave. A Heatmap of MGE categories for six sampling sites (SC1–SC6). The abundance of MGE categories was quantified and normalized based on their abundance in a particular MAG at a specific sampling depth. Rows were clustered using the “complete” method with the pheatmap function. B The bar plots represent the relative abundance of bacterial phyla corresponding to the top 10 most abundant MGEs
Potential novel β-lactamases and their relationship with host
Since β-lactamases are perceived as one of the most important antibiotic resistance genes considering human health risk, we analyzed the anchialine MAGs for their presence. We used farGene since it was shown to outcompete other similar programs for β-lactamase prediction. All farGene β-lactamase candidate sequences were confirmed in CARD hits. In total, 42 β-lactamases which belonged to 28 MAGs were found in the anchialine cave.
The β-lactamase–carrying MAGs belonged to 9 different phyla (Pseudomonadota, Bacteroidota, Acidobacteriota, Omnitrophota, Actinomycetota, Campylobacterota, Chlamydiota, Thermoplasmatota–Archaea, Verrucomicrobiota). Gammaproteobacteria (33%), Alphaproteobacteria (28,5%) and Bacteroidia (16,6%) were the most dominant classes. Approximately one-half (20/42) of β-lactamase-carrying MAGs were identified at the genus level and only one was annotated at the species level (A. xenomutans).
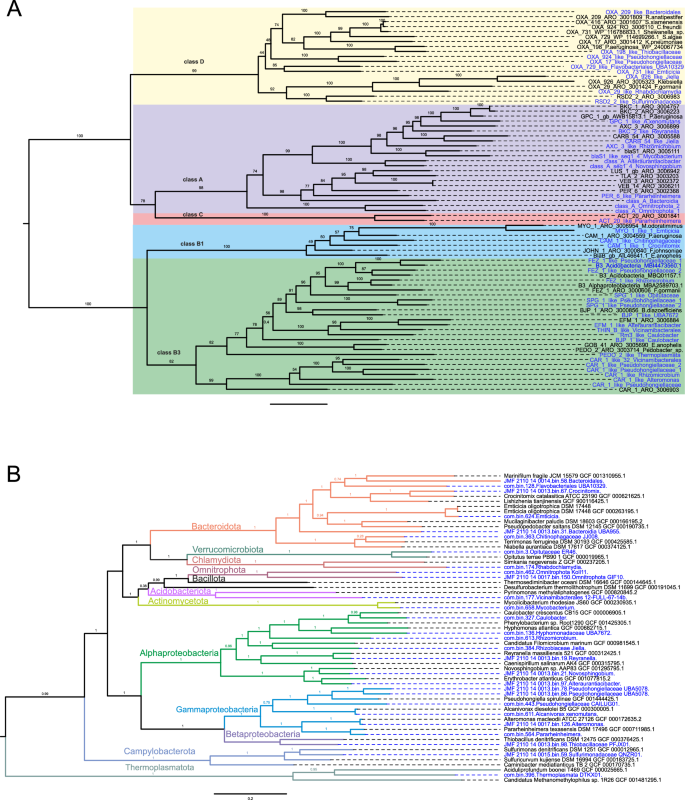
Among the detected β-lactamases 11, 21, 1, and 9 were classified into class A, B, C, and D, respectively (based on molecular Ambler’s classification system). A phylogenetic tree with β-lactamase representatives (reference sequences from the KEGG database) confirmed their position within the annotated classes (Fig. S10). Most β-lactamases belonged to the subclass B3 (18/42), with sequences similar to CAR-1, BJP-1, FEZ-1 and SPG-1 being the most frequent and present within Opitutaceae, Hyphomonadaceae_UBA7672, Vicinamibacterales, Caulobacter, Pseudohongiellaceae, Rhizomicrobium, and Alteromonas. Eleven β-lactamases were labeled as class A, among them one blaS1-like (64.6% sequence similarity with CARD ARO:3,005,111), a predominant β-lactamase in the species Mycobacterium smegmatis, was found in a Mycobaterium (Fig. 7). Class C β-lactamases were represented with only one sequence detected in Pararheinheimera (Enterobacterales), similar to ACT-20 from Enterobacter hormaechei (ARO:3,001,841). In total, three β-lactamases resistant to carbapenems (CAR-1, B3 class—30.1% identity with ARO:3,006,903; PER-6, class A class—44.4% identity with ARO: 3,002,368; and ACT-20, class C—54.5% identity with ARO: 3,001,841) were found in Enterobacterales, which are listed by WHO as critical priority for the development of new antimicrobials. Oxacillinases were the most dominant ARGs in class D β-lactamases and were found in Bacteroidales, Emticicia, Flavobacteriales_UBA10329, Jiella, Pseudohongiellaceae, Rhabdochlamydia, Sulfurimonadaceae, and Thiobacillaceae.
β-lactamases and MAGs phylogenetic trees. A β-lactamases phylogenetic tree based on maximum–likelihood (1000 ultrafast bootstrap approximation replicates) contains novel anchialine β-lactamase sequences and representative sequences from the Comprehensive Antibiotic Resistance Database (CARD). B Metagenome—assembled genomes from this study were aligned with the representative genomes and a phylogenetic tree was constructed using the Genome Taxonomy Database Toolkit (GTDB-Tk). β-lactamase sequences and MAGs detected in this study are coloured in blue
Our comparison using CARD reference genes revealed that all identified β-lactamase sequences exhibited less than 70% pairwise identity with representative CARD β-lactamases (Table 1).
When we searched for similarities using BLASTp and the NCBI database (Table S8), only two sequences from class A, namely Pararheinheimera and A. xenomutans, showed high pairwise identity (~ 99%) with two NCBI entries, MBN8446110.1 (Gammaproteobacteria bacterium) and WP_026948658.1 (Alcanivorax), respectively. Interestingly, almost half (19/42) of the β-lactamase sequences showed less than 70% of the identity to NCBI best hits. These diverse sequences were distributed across Pseudomonadota (12), Omnitrophota (2), Actinobacteriota (1), Bacteroidota (3), and Campylobacterota (1), as illustrated in Fig. 7.
Special attention should be given to β-lactamase sequences carried by MGEs [56]. The majority of the β-lactamase sequences in the anchialine cave were identified in MAGs containing MGE-related proteins. For example, the genera: Jiella, Mycobacterium, Alteromonas, PFJX01 (family Thiobacillaceae), Emticicia, and Pararheinheimera contained ten or more MGE-related proteins. Interestingly, a β-lactamase sequence similar to the OXA-198 (69% sequence identity with ARO:3,001,805) from the WHO-listed pathogen P. aeruginosa, was detected in a MAG belonging to Thiobacillaceae (g__PFJX01). In addition to the OXA-198, this particular MAG contained 13 different MGE-related proteins (belonging to categories: integration/excision, phage, replication/recombination/repair, and stability/transfer/defence) (Fig. 6A). Altogether, these results might suggest a potential for HGT of β-lactamase sequences within the cave environment.


Add Comment