Animal model
This study was approved by the Clinical Medicine Research Ethics Committee of the First Affiliated Hospital of Anhui Medical University, China, and complies with the National Guidelines for Animal Care and Use in China. Ethics approval number: 5101114.Ninety male SD rats (initial weight: 140-170g) were selected. Choosing male SD rats was to avoid hormonal fluctuations, as female rats undergo hormonal fluctuations during their estrous cycles, which could potentially affect experimental outcomes.After a three-day adaptation period and numbering, the rats were randomly divided into two groups: a normal control group consisting of 30 rats fed a standard diet and a high-fat group consisting of 60 rats fed a high-fat diet.The high-fat diet with the following nutritional composition: 20% protein, 20% carbohydrates, and 60% fat.The high-fat group was administered a mixture of CCl4 in oil (1:4) from the 8th week until the 14th week (0.2 mL/kg; twice a week; intraperitoneally).In the normal control group, 10 rats were randomly selected at the 4th, 10th, and 14th weeks for imaging examination. In the high-fat group, 10 rats were randomly selected at the 4th, 6th, 8th, 10th, 12th, and 14th weeks after anesthesia for imaging examination. Subsequently, blood samples were collected from the abdominal aorta, and finally, under anesthesia, the rats were euthanized by cervical dislocation, and liver tissue was obtained.
Ultrasound data acquisition
Examination is performed using the ACUSON Sequoia real-time shear wave elastography ultrasound diagnostic system (Brand: Siemens, Origin: USA), equipped with a standard linear array 10L4 transducer (4-10MHz), and an animal experiment-specific V6 ultrasound diagnostic system (Brand: FiNo, Origin: China), equipped with an X4-12L transducer (4-12MHz).Before the examination, all rats had a one-day period of fasting. Anesthesia was initiated by administering pentobarbital sodium by an intraperitoneal injection, using a solution of 3% saline at a dosage of 40mg/kg. Subsequent to undergoing ultrasonic scanning, once anesthetized, the rats’ abdominal fur was surgically extracted while they remained immobile on the operating table. The evaluation began with a conventional B-mode ultrasound scan. Following the standard scan, the liver lobes were consistently recorded as bigger two-dimensional images. Afterward, the mode was changed to 2D-SWE and P-SWE in order to get liver lobe elastography data. Utilizing the 2D-SWE mode, the elasticity values of adjacent liver and kidney tissue were ascertained. These results were then used to determine the liver-to-kidney elasticity ratio. The grayscale ultrasonography and SWE findings were stored as duplex pictures in Digital Imaging and Communications in Medicine (DICOM) format for further radiomics investigation.
Blood and tissue sampling
Following the completion of the ultrasound scans, the rats’ body weights were measured. Subsequently, blood samples were collected through abdominal aorta puncture, and the rats were euthanized. Blood was collected into anticoagulant tubes, centrifuged at 4000rpm for 15 min, and the serum was stored at -80 °C for later use. Simultaneously, the liver was quickly separated, rinsed with physiological saline, and the central lobe of the liver was fixed in 10% neutral formalin for further processing.
Serum and histopathological analysis
The collected serum samples were labeled and sent to the laboratory at our Hospital for analysis. The serum samples were tested for the following parameters: alanine transaminase (ALT), aspartate transaminase (AST), AST/ALT ratio, gamma-glutamyl transferase (GGT), total cholesterol (CHOL), triglycerides (TG), high-density lipoprotein cholesterol (HDL-C), and low-density lipoprotein cholesterol (LDL-C).
The liver tissue was preserved in a solution of 10% neutral formalin for 24 h and then underwent standard tissue processing. Subsequently, the specimen was treated with hematoxylin and eosin (H&E) to facilitate histological examination. The SAF score system was employed to diagnose NAFLD pathologically. NASH is diagnosed when there is a concurrent presence of ballooning degeneration, hepatic steatosis, and lobular inflammation, with each component scoring 1 point and the total score being ≥ 3 points. Significant fibrosis is characterized by a fibrosis score of F2 or above. Fibrosis scores range from F0 (no fibrosis) to F4 (cirrhosis), with F2 indicating the presence of both peri-sinusoidal and portal/periportal fibrosis, while F3 manifests bridging fibrosis.
Radiomic feature extraction and selection
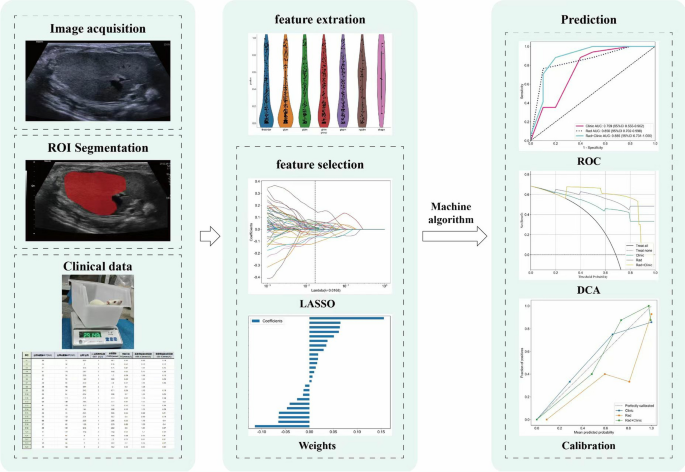
The ultrasound images were exported from our imaging system.Then, ITK-SNAP 3.8.0 (www.itksnap.org/) was used to delineate the contours of the Region of Interest (ROI) for radiomic feature extraction, model building, and evaluation. Radiomic features were automatically extracted from each image using the “pyradiomics” toolkit.To select radiomic features with good reproducibility and low redundancy, the following steps were taken:①Independent sample t-tests were performed on all extracted features, and features with p > 0.05 were removed.②For highly repetitive features, the Pearson correlation coefficient was calculated to express the relationship between features, and only one of any pair of features with a correlation coefficient > 0.9 was retained.③The Least Absolute Shrinkage and Selection Operator (LASSO) algorithm was applied, and ten-fold cross-validation was used to determine the optimal λ value. Based on the model corresponding to the best λ value, non-zero coefficient radiomic features were selected.④All selected features were standardized using the Z-score method.⑤Finally, radiomic features and their corresponding coefficients were selected based on the LASSO algorithm.
Establishment of clinical models, radiomic models, and clinical radiomic models
After feature selection, various machine learning (ML) classification algorithms were used to establish clinical models, radiomic models, and clinical radiomic models. These algorithms included Logistic Regression (LR), Support Vector Machine (SVM), K Nearest Neighbor (KNN), Random Forest (RF), Extremely Randomized Trees (ExtraTree), eXtreme Gradient Boosting (XGBoost), Light Gradient Boosting Machine (LightGBM), and Multi-Layer Perceptron (MLP).Fig. 1 in the analysis pipeline illustrates the workflow for establishing the clinical radiomic model.
Model evaluation
ROC, AUC and DCA were used to evaluate the performance and clinical utility of the radiomic model, clinical model, and clinical radiomic model in both the training and validation sets. Additionally, accuracy, sensitivity, specificity, PPV, and NPV were also assessed.
Statistical analysis
Statistical analysis was conducted using R software (version 4.3.2) and Python (version 3.7.2).Continuous data were evaluated for consistency between the training and validation sets using independent sample t-tests. The performance of the models was evaluated using ROC curves, and the AUC of each prediction model was compared using the DeLong test. The clinical value of various prediction models was compared using DCA. Model fitting was assessed using calibration curves. The calculations for DCA mainly utilized the “rms” and “rmda” packages in R. Statistical significance for all two-tailed tests was set at P < 0.05.


Add Comment