


Overview
Three-point bending experiments were performed on maize and wheat at multiple displacement rates to understand the effect of rate on flexural stiffness and bending strength measurements. Wheat samples were tested both with and without the leaf sheath as the leaf sheath has a significant effect on the biomechanical response of wheat stems [42]. Rind puncture experiments were performed on maize stalks at multiple displacement rates to understand the effect of displacement rate on puncture force and integrated puncture score measurements [35].
The displacement rates for each experiment were chosen based on practical limitations of standard laboratory equipment while simultaneously seeking to maintain data integrity by limiting experimental noise. Previous experimental studies [13, 17, 34, 35, 42] also informed rate selection. As it is common to have high samples sizes within plant-based experiments, very low displacement rates were excluded as these tests significantly lower throughput and can introduce viscoelastic effects (creep and stress relaxation). Additionally, very fast displacement rates were excluded to limit substantial inertial effects. It is also very difficult to maintain specimen orientation at higher displacement rates. Relatively slower displacement rates were used when testing wheat stems than maize stalks as wheat stems have smaller span lengths. Consequently, if tested at the same displacement rates as maize the strain rates would be much higher (see limitations section for a more in-depth discussion of strain rate).
Plant materials
Maize stalks were collected from the University of Kentucky Spindletop Research Farm. All stalks were sourced from a single bag of Pioneer P1464AML seeds (mid-season, 114 days to mature). At harvest time (118 days after planting) stalk samples were collected by cutting each sample at the base and just above the primary ear bearing node. Leaves, ears and leaf sheaths were removed, and the stalks were spread in a single layer on wire rack benchtops in a greenhouse set to 36 °C with adequate air circulation to deter mold growth. Stalks remained in the greenhouse for one month after which they were transported to an airconditioned laboratory with a relative humidity that varies from 15 − 34% and an average temperature of 20 °C. Placing the stalks in the greenhouse and then in the lab allows long term storage of the stalks without degrading mechanical properties and closely resembles the condition of stalks in the field just prior to harvest [13, 16, 38, 43].
Wheat specimens were grown in Moscow, ID at University of Idaho Parker Farm. All samples were taken from the same plot of spring wheat. The stems were allowed to reach full maturity and remained in the field until harvest. The samples were cut at ground level and the most basal 30 centimeters of the plant was collected for testing. All samples were selected from the center of the plot to minimize border effects on stem growth [44]. Only samples that were found to be free of disease and in good mechanical condition were included in the study. All samples were stored in a laboratory space that is maintained at standard room temperature and humidity after collection (~ 20 °C and ~ 15-30% relative humidity). The wheat did not need to be stored in the greenhouse prior to being placed in the lab to prevent fungal growth. In addition, the leaf sheaths were not removed from the wheat plants prior to storing them in the laboratory as the leaf sheath significantly influences the bending stiffness and bending strength of wheat stems [42].
It is known among the biomechanics community that biological materials are generally rate dependent [40, 41]. One reason these materials display rate dependent properties is that they contain viscous fluids (e.g., water) which resist deformation and add material damping. As such, fully hydrated plant stems are expected to exhibit stronger rate dependent effects than dry plant samples. A deliberate choice was made to use fully mature and dry plant materials in this study because late season stalk lodging typically occurs near harvest time when the plants have senesced and dried down. Previous studies investigating late season stalk lodging have performed rind puncture and three-point bending tests of plant samples that were prepared in the same manner as those in this study. We were therefore also interested in what the effect of testing rate would be on stalks that had been prepared in this particular manner.
Three-point bending tests of maize stalks
Long span three-point bending tests were performed on a total of 110 maize stalk samples using a custom fixture that was mounted to a universal testing system. The base of the fixture was a 10.16-centimeters x 10.16-centimeters x 121.92-centimeters (4-inches x 4-inches x 48-inches) aluminum extrusion that had two L-shaped brackets approximately 15.24 centimeters (6 inches) tall affixed with 7.62-centimeter (3-inch) cylinders that supported the maize stalk samples during the test (Fig. 1). The loading anvil had an inverted “V” shape with rounded edges to prevent stress concentrations and premature collapse of the stalk cross-section that can occur when using a flat loading anvil [38]. A span length of 60 centimeters was used for all 110 maize stalk samples. Stalks were loaded at the center most node (halfway between the ear bearing node and the most basal node) as shown in Fig. 2. Stalks were loaded at the central most node as opposed to the center of an internode as this prevents crushing of the cross section and produces failure patterns similar to those observed for naturally lodged stalks [17, 45]. Maize stalks possess an elliptical cross-section; therefore, all stalks were loaded in the direction of the minor axis of the cross-section [14, 19, 35].

Custom long span three-point bending fixture [14]
Flexural stiffness calculations for maize stalks
A subset of 30 maize stalks were subjected to repeated, nondestructive three-point bending tests. Each stalk was tested at the seven displacement rates shown in Table 1. During each test the sample was preconditioned by displacing the stalk to 6 millimeters two times. The stalk was then displaced a third time to 6 millimeters and data from the last cycle of displacement was used to calculate stalk flexural stiffness (EI) using Eq. 1. Preconditioning is common best practice when testing biological specimens and is necessary to obtain repeatable force displacement responses [41]. For many biological specimens more than two cycles of preconditioning are required, however, preliminary testing of maize stalks in our lab revealed the force-displacement response of the stalk was repeatable after 2 cycles. All stalks were still within the elastic range after being displaced by 6 millimeters. In other words the stalks were not damaged or permanently deformed during any of these tests [16]. Thus, each stalk was able to be subjected to flexural test at each of the rates shown in Table 1, thereby enabling a paired statistical analysis of the results.
Stalk flexural stiffness, EI, was calculated as follows [46]:
$$\:EI\:=\:\frac{\phi\:{L}^{3}}{48}$$
(1)
where ∅ is the slope of the force-displacement curve, acquired by flexing the stalk in three-point bending without plastically deforming the stalk and L is total the distance between the supports.
Bending strength calculations of maize stalks
Characterizing the effect of displacement rate on stalk bending strength presents several challenges. Bending strength is a destructive measurement so each stalk can only be tested at a single rate, making repeated measurements of the same stalk at different rates impossible. Further compounding the issue is that no two maize stalks are exactly alike. Differences in stalk geometry among test specimens has a large effect on bending strength measurements and would likely obscure any differences in bending strength between groups tested at different displacement rates. However, it has been shown that flexural stiffness, which is a nondestructive measurement, is a very strong predictor of stalk bending strength. The R2 value between flexural stiffness and bending strength is frequently greater than 0.8 [16]. The authors utilized this correlation to investigate the effect of displacement rate on bending strength as explained below.
First each stalk was subjected to a nondestructive three-point bending test at a displacement rate of 100 mm/min following the flexural stiffness protocol outlined above. Data from this test was then utilized to calculate stalk flexural stiffness (at a rate of 100 mm/min). The strong linear correlation between stalk flexural stiffness and stalk bending strength was then utilized to predict the bending strength of the stalk (at a rate of 100 mm/min). After the nondestructive flexural stiffness test was complete, each stalk was subsequently tested to failure at either 2.5 mm/min, 25 mm/min, 100 mm/min or 360 mm/min. The actual bending strength at the tested rate was then compared to the predicted bending strength at a rate of 100 mm/min. A total of twenty stalks were tested to failure at each rate.
Bending strength was calculated using Eq. 2 [46]
$$\:{M}_{max}=\frac{FL}{4}$$
(2)
where F is the applied load and L is the distance between supports.

Three-point bending tests of wheat stems
Three-point bending tests of wheat stems were conducted using an Instron 5kN flexure fixture (Part # 2810 − 400) with a span width of 8 centimeters (Fig. 3). The same general testing protocol for determining flexural stiffness of maize stalks was used for wheat stems. In particular, each stem was preconditioned by flexing it 2 times to a displacement of 1 mm. All stems remained within the elastic range after being displaced by 1 mm. Data from a third cycle of displacement was then used for flexural stiffness and bending strength calculations. Stems were tested at each of the rates seen in Table 2.

Three-point bending fixture for wheat stems
Flexural stiffness calculations for wheat stems
Flexural stiffness was calculated using Eq. 1. The leaf sheath of wheat stems has been shown to be an important structural feature of the plant [42]. Therefore, a total of 30 stems with the leaf sheath intact were tested at each of the rates shown in Table 2 to obtain flexural stiffness measurements. A second set of 30 stems that had the leaf sheath carefully removed prior to testing were also tested at each of the rates shown in Table 2. As flexural stiffness tests are nondestructive each of the stems were tested at each of the displacement rates displayed in Table 2, thereby enabling a paired statistical analysis of results.
Bending strength calculations for wheat stems
To determine the effect of displacement rate on wheat stem bending strength the same general testing protocol used for maize was employed. In particular, each stem was first subjected to a nondestructive test at 40 mm/min to determine flexural stiffness. The flexural stiffness was then used to predict the bending strength of the stem at a rate of 40 mm/min. After the nondestructive flexural test each stem was subsequently tested to failure at either 1 mm/min, 40 mm/min or 144 mm/min. A total of 10 stems with the leaf sheath and 10 stems without a leaf sheath were displaced to failure at each rate. The bending strength of each stem at the tested rate was then compared to the predicted bending strength of that same stem at a rate of 40 mm/min.
Rind puncture measurements of maize stalks
Rind puncture tests were conducted using a Universal Testing machine equipped with a 2kN load cell. A custom aluminum platform was utilized that measures 4.445-centimeters x 10.16-centimeters x 10.16-centimeters (1.75-inches x 4-inches x 4-inches) with a 0.9525-centimeter (0.375-inch) hole in its center that allows for a chamfered puncture probe to pass completely through the stalk without impacting the platform. The chamfered puncture probe was 6.25 centimeters long, 2 millimeters in diameter with a 45-degree chamfer that reduced the diameter at the tip of the probe to 1 mm [34]. The test set up can be seen in Fig. 4a. Time, force and displacement data were collected at a rate of 1000 Hz. Maize stalks have an elliptical cross-section with the major axis of the ellipse typically being aligned with the ear groove. All stalks were punctured through the minor axis (see Fig. 4b) as this is standard practice and puncturing through ear groove can add experimental noise to measurements.

(a) Rind puncture experimental setup [14]. (b) Puncture diagram
Determining the effect of displacement rate on rind puncture
Like bending strength, rind puncture is a destructive measurement. Therefore, the same location on a stalk cannot be punctured at multiple different displacement rates. However, preliminary testing revealed that puncture tests occurring within a single internode produce nearly identical results. In particular, we punctured 12 maize internodes 4–5 times each at a rate of 25 mm/s. Each puncture test within a single internode occurred a minimum of 2.54 centimeters (1 inch) away from the site of any previous puncture tests and 2.54 centimeters (1 inch) away from the nodes. This preliminary data as well as previous studies [34] revealed that as long as puncture tests occurred within a single internode and were 2.54 centimeters (1 inch) apart and away from meristematic tissue near the nodes, they produced very similar responses.
The preliminary puncture testing described above indicated that each internode could be tested multiple times at different rates. Therefore, a total of 30 maize stalk internodes were subjected to repeated puncture testing at rates of 10 mm/s, 25 mm/s and 40 mm/s. In other words, each internode was punctured three times (once at each rate). The specific puncture location within the internode was randomized according to puncture rate and only the centermost 10.16 centimeters (4 inches) of the internode were punctured. The force-displacement data from each test was processed using a custom MATLAB script as described in [35]. The MATLAB script calculated the integrative puncture score (IPS) [35], maximum force and minor diameter of the stalk at each puncture location. Figure 5 gives a brief visual example of how these values are calculated from the force-displacement data obtained from each puncture test. A more in-depth discussion is provided in [19].
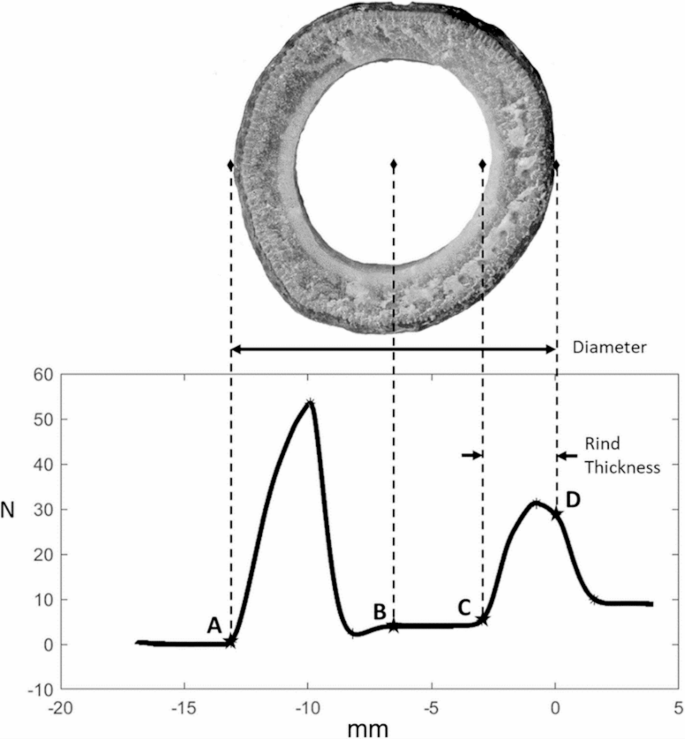
Key points of the load–extension curve from a puncture test showing how each point relates to the physical features of the stalk cross section. Labeled points are: A—Point of initial contact, B—Midpoint, C—Point of reengagement, D—Exit (zero) plane. Diameter is calculated as the distance between points A and D whereas the rind thickness is calculated as the distance between points C and D [19]
Add Comment