High IL1RAP expression on AML cell lines and patients’ blasts
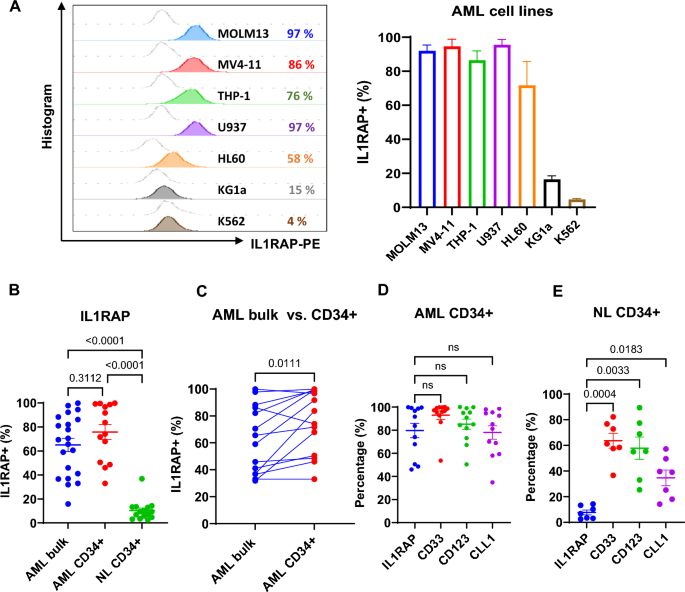
We assessed IL1RAP expression levels on representative AML cell lines (MOLM13, MV4-11, THP-1, U937, HL60, KG1a), primary AML bulk blasts and CD34+ blasts, and normal CD34+ BM cells by flow cytometry (FCM). AML cell lines showed high expression of IL1RAP (IL1RAPhigh; i.e., > 50% IL1RAP + cells), except for KG1a (IL1RAPmedium; 16%) and K562 (IL1RAPlow/neg; 5%) (Fig. 1A). Primary AML bulk blasts (IL1RAPhigh; 65% ± 5%; n = 21) and CD34+ blasts (IL1RAPhigh;76 ± 6%, n = 14) also expressed significantly higher levels of IL1RAP than normal CD34+ BM cells (IL1RAPlow/neg;10 ± 2%; n = 15; p < 0.0001; Fig. 1B). Notably, in the same patient, the frequency of IL1RAP + cells were higher in LSC-enriched CD34+ population than in bulk blasts (n = 14, p = 0.011; Fig. 1C). Compared with other AML surface antigens that are currently being pursued as therapeutic targets in the clinic [i.e., CD33 (93 ± 4%), CD123 (85 ± 4%) or CLL-1(78 ± 6%)], IL1RAP expression (80 ± 6%) was similar in CD34+ blasts (Fig. 1D), but significantly lower in normal CD34+ cells from healthy donors (IL1RAP+: 8 ± 2%; CD33+: 64 ± 6%; CD123+: 58 ± 9%, CLL-1+: 35 ± 6%; Fig. 1E).
IL1RAP expression on the cell surface of AML cell lines and primary AML blasts. A Representative histogram plots (left) and combined results (right, n = 3 independent experiments) of IL1RAP expression on AML cell lines analyzed by FCM. B IL1RAP expression on primary AML bulk blasts (n = 21) and AML CD34+ cells (n = 14), and normal (NL) CD34+ cells (n = 15), analyzed by FCM. C Paired comparison of IL1RAP expression on bulk and CD34+ blasts in individual AML patients (n = 14) by FCM. D Percentages of IL1RAP + , CD33 + , CD123 + , and CLL-1 + cells in AML CD34+ blasts by FCM (n = 12). E Percentages of cells expressing IL1RAP, CD33, CD123, and CLL-1 relative to the control cells stained with isotype control antibody, in normal healthy donor CD34+ hematopoietic stem cells (HSCs) analyzed by FCM (n = 7). B, and D–E were analyzed by one-way ANOVA with Tukey or Dunnett multiple comparisons tests respectively, and C was analyzed by paired Student’s t-test. NL, normal; NS, not significant
Development and characterization of the novel anti-IL1RAP/CD3 T cell engager (TCE) BIF002
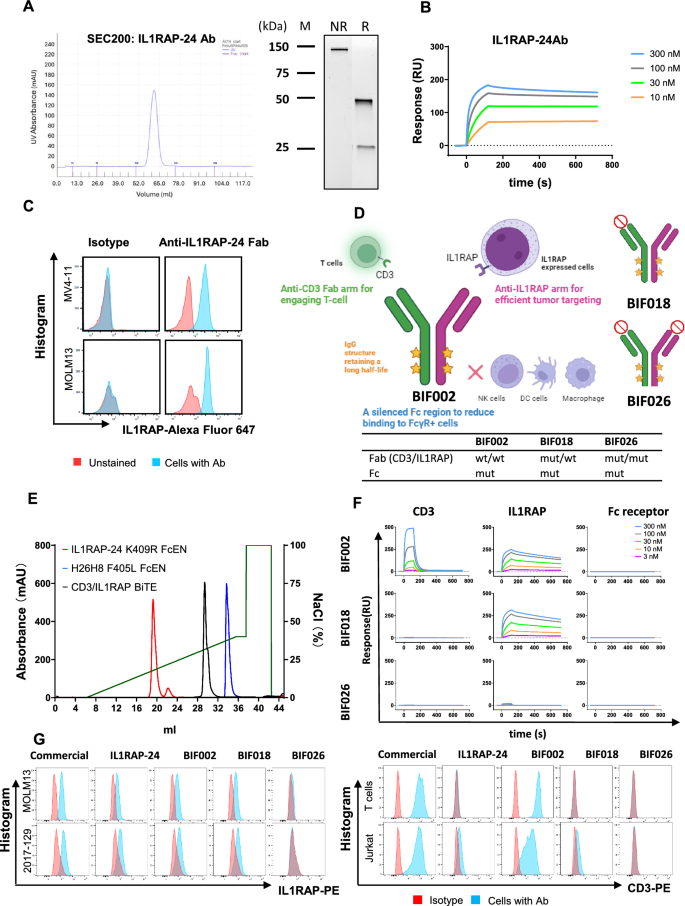
To target IL1RAP + AML blasts, next, we developed an anti-hIL1RAP antibody. Briefly, Balb/c mice were immunized with the recombinant ECD of hIL1RAP (S21-E359). Plasma B cells from the spleens of the immunized mice were screened for IL1RAP antibody production, cells secreting anti-hIL1RAP antibodies identified and their variable heavy (VH) and light (VL) chain sequences determined. Out of 108 positive hits from single B cells, we successfully recovered 34 sets of VH/VL sequences, from which we selected twelve mAb candidates based on the sequence diversity of the CDRs. The twelve VH/VL sequences were then cloned into a vector containing human constant domains to create murine-human chimeric anti-IL1RAP antibodies. Using size exclusion chromatography (SEC; Supplementary Fig. 1A), a target affinity assay determined by SPR (Supplementary Fig. 1B), differential scanning fluorimetry (DSF) to measure antibody thermal stability (Tm; not shown), and ADCC and IFN-γ release studies conducted on MV4-11 cells (not shown), we selected six candidates with the highest affinity, ADCC activity and IFN-γ release and produced their respective Fabs (Supplementary Fig. 2A–C). Among the six candidates, clone #24 (IL1RAP-24) showed the highest activity with a monovalent affinity of 2.2 nM and a TM of 77 °C (Supplementary Fig. 2A–C) and was therefore selected as the lead candidate (Fig. 2A–C). Crystallographic data and refinement for IL1RAP-24 Fab are shown in Supplementary Table 3. Of note, IL1RAP-24 Ab showed no cross-reactivity with normal human tissues, i.e., liver, lung, and brain, by immunohistochemical (IHC) staining (Supplementary Fig. 3).
Characterization of anti-IL1RAP-24 monoclonal antibody (mAb) and production of anti-IL1RAP/CD3 bispecific T cell engager (TCE). A Size exclusion chromatography (SEC, left) and SDS-PAGE (right) of anti-IL1RAP-24 mAb. B Target affinity assay of anti-IL1RAP-24 mAb binding to IL1RAP by surface plasmon resonance (SPR). C Flow cytometry (FCM) analysis of binding capacity of anti-IL1RAP-24 Fab vs. isotype control antibody to IL1RAPpos MV4-11 and MOLM13. D Schematic description of anti-IL1RAP/CD3 bispecific TCEs including BIF002, BIF018 and BIF026, created by Biorender.com. E Ion exchange chromatography (IEC) of anti-IL1RAP/CD3 bispecific TCE (BIF002) along with parental antibodies. F SPR sensorgrams of TCEs, i.e., BIF002, BIF018 and BIF026, binding to CD3, IL1RAP and Fc receptor (CD16a), respectively. G FCM analysis of binding capacity of anti-IL1RAP or anti-CD3 commercial mAbs, anti-IL1RAP-24 mAb, and TCEs including BIF002, BIF018 and BIF026, to IL1RAPhigh AML cells and CD3+ T and Jurkat cells
Next, we used the IL1RAP-24 clone and FAE to produce anti-IL1RAPxCD3 TCEs (Fig. 2D; see methods for details). Using IEC to distinguish the anti-IL1RAPxCD3 TCEs from the parental antibodies (Fig. 2E), SPR to measure the binding of the TCEs to the cognate targets (i.e., CD3 and IL1RAP; Fig. 2F), and FCM analysis to measure the binding of the TCEs to IL1RAP+ AML cells and CD3+ T cells (Fig. 2G), we selected the anti-IL1RAP/CD3 TCE BIF002, a full-length IgG1 with Fc mutations, as lead candidate and evaluated it’s in vitro and in vivo activity.
To obtain mutated controls and address binding specificity, we introduced point mutations into the CDR of each arm based on the crystal structures of IL1RAP-24 Fab (Fig. 2D; Supplementary Fig. 4A–E) and H26H8 (Fig. 2D). BiF018 consisted of anti-hIL1RAP partnered with a mutated anti-hCD3 arm and incorporates a mutant Fc abrogating binding to Fc binding receptors. BiF026 included two point-mutations in the anti-hIL1RAP arm to abrogate IL1RAP binding (i.e., I30S and Q99E; Supplementary Fig. 4D) and was paired with the aforementioned mutated anti-hCD3 arm and Fc. BiF018 and BiF026 served as control constructs (Fig. 2D). As expected, while BIF018 bound to IL1RAP, and not to CD3, BIF026 did not bind to either target (Fig. 2F-G).
Next, we tested if BIF002 inhibited IL-1 signaling in target cells. First, we compared the response of HEK-Blue™ IL-1β cells (InvivoGen) to IL-1α/IL-1β in the presence of BIF002 or the commercial anti-IL1RAP Ab nidanilimab (ThermoFisher, #MA5-42,255). Dose-dependent inhibition of IL-1 signaling in HEK-Blue™ IL-1β cells was observed in the presence of nidanilimab when cells are treated with IL-1α or IL-1β, but not at the concentrations of BIF002 needed to eliminate the target (Supplemental Fig. 5A, B). We also treated MOLM13 cells with our IL1RAP-24 Ab (20 μg/ml; 133 nM) or BIF002 (5 μg/ml; 33 nM) or the commercial anti-IL1RAP Ab nidanilimab. Western blot analysis showed a reduction of phospho-IRAK1 and phospho-p38 levels in nidanilimab-treated cells, but not in IL1RAP-24 Ab-treated or BIF002-treated cells (Supplemental Fig. 5C, D). Taken altogether, these findings support that IL1RAP-24 Ab and BIF002 do not have an IL1RAP-signal blocking activity.
BiF002 activity on AML cells
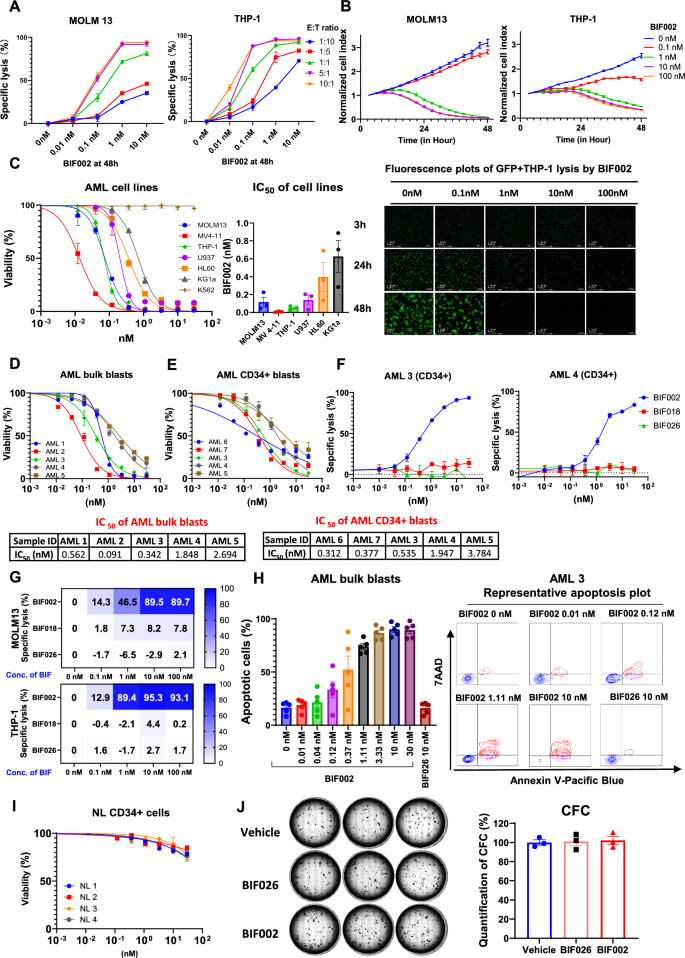
To test the antileukemic activity of BIF002, we co-cultured healthy donor T cells with AML cell lines MOLM13 or THP-1 cells at different E:T ratios (range: 1:10 to 10:1) and serial concentrations of BIF002 (range: 0.01–10 nM) for 48 h. We observed a dose- and E:T ratio- dependent cell lysis (Fig. 3A). At 48 h, a near 100% target AML cell lysis was observed at E:T ratio ≥ 5:1 and BIF002 ≥ 1 nM.
Dose-and effector-to-target (E:T) ratio-dependent activity of BIF002. A Cell lysis of MOLM13 and THP-1 at different E:T ratios and various concentrations of BIF002 at 48 h (normalized to no Ab ctrl at same E:T ratio; n = 3). The experiment was repeated with another T cell donor, and similar results were obtained. B Real-time counts of GFP + target AML cells from co-cultures with BIF002 (0.1—100 nM) and T cells (E:T ratio 5:1) (upper), and representative real time fluorescence plots of GFP + THP-1 lysis by BIF002 at E:T ratio 5:1 (lower), recorded by Agilent xCELLigence (technical duplicate). The experiment was repeated with another T cell donor, and similar results were obtained. Cell index was normalized to GFP + cell counts at 3 h of the same well. C Viability changes (left; n = 3) and combined IC50 results (right; n = 3 independent T cell donors) of AML cell lines treated with BIF002 and T cells at E:T ratio 5:1 at 48 h. The experiment was repeated with two other T cell donors, and similar results were obtained. D–E Viability changes of primary AML bulk blasts (D; n = 3) and AML CD34+ blasts (E; n = 3) treated with BIF002 and T cells at E:T ratio 5:1 at 48 h. F Cell lysis of AML CD34+ blasts (n = 3) treated with healthy donor T cells and BIF002, or BIF016, or BIF026 at E:T ratio 5:1 at 48 h. G Cell lysis of AML cell lines treated with healthy donor PBMC and BIF002, or BIF016, or BIF026 at E:T ratio 5:1 at 48 h (n = 3). The experiment was repeated with another T cell donor, and similar results were obtained. H Combined results (left; n = 5 samples) and representative plots (right) of apoptotic cells in primary AML blasts treated with healthy donor T cells and BIF002 or BIF026 control at E:T ratio of 5:1 at 48 h. I Viability of normal (NL) CD34+ bone marrow cells treated with healthy donor T cells and BIF002 at E:T ratio 5:1 at 48 h (n = 3). J Normal CD34+ cells were treated with T cells and BIF002 or BIF026 (30 nM) or vehicle at E:T ratio 5:1 for 24 h and then cultured for colony-forming cell (CFC) assay. Representative colonies (left) and quantification (right; n = 3) of CFCs on Day 14 normalized to vehicle were shown. The experiment was repeated with another T cell donor, and similar results were obtained. Except for a various E:T ratio in A and the use of PBMC as effector cells in G, the effector cells for the others are healthy donor T cells with an E:T ratio of 5:1. Cell death was evaluated by 7-amino actinomycin D (7-AAD+) labeling. Apoptotic cells were evaluated by 7-amino actinomycin D (7-AAD+) or Annexin V (+) labeling. AML lysis was determined by the following formula: % Lysis = 100 − (viable cells of treatment group × 100/viable cells of untreated control group)
The BIF002-dependent AML cell lysis was documented in real time using MOLM13Luci/GFP and THP-1Luci/GFP cells treated with BIF002 (range 0.1–100 nM) and T cells, and imaging with xCELLigence RTCA eSight platform that recorded the dynamic changes of the GFP+ AML signals over time. At E:T ratio of 5:1, in the absence of the BIF002, T cells displayed no AML cytolytic activity, while starting at 0.1 nM BIF002 concentration, the T cell cytolytic activity increased in a dose- and time-dependent manner (Fig. 3B). Of note, at E:T ratio 5:1, 10 nM BIF002 produced a significant T cell proliferation and IL1RAP+ MOLM13 and THP-1 lysis (Supplementary Video 1. MOLM13 and Video 2.THP-1).
After 48 h exposure, starting with resting T cells and an E:T ratio of 5:1, the BIF002 IC50 was found to be within a subnanomolar range (Fig. 3C), and seems to correlate inversely with IL1RAP expression levels (Fig. 1A). In fact, while IL1RAP+ AML cells were killed in the presence of BIF002, IL1RAPlow/neg K562 cells remained viable. The median IC50s for IL1RAPpos AML bulk and CD34+ blasts were also in subnanomolar ranges [0.56 nM (range 0.09–2.69 nM, n = 5, Fig. 3D) and 0.53 nM (range: 0.31–3.78 nM, n = 5, Fig. 3E), respectively]. Comparing the cytotoxic effects of BIF002 on bulk and CD34+ blasts from primary AML3, AML4, and AML5 samples, we observed similar BIF002 cytotoxic effects on both AML bulk and CD34+ blasts (Supplementary Fig. 6).
Next, we tested the specificity of BIF002 using BIF018 and BIF026 as controls. After 48 h co-culture of the AML CD34+ blasts with FLT3-ITD mutations (AML-3 and AML-4), at E:T ratio of 5:1, while BIF002 exposure increased AML cell lysis, neither BIF018 nor BIF026 killed the cells (Fig. 3F). Similar results were observed using PBMC (E: T at 5:1) as the source of T effector cells (Fig. 3G). We also observed an increase in apoptosis of IL1RAPpos primary AML blasts (n = 5) after treatment with BIF002, and not with BIF026 (Fig. 3H). Of note, no cell killing was observed when either AML or T cells alone were treated with BIF002 or BIF026 (Supplementary Fig. 7A-C). Importantly, no significant changes in the viability of normal CD34+ BM cells (n = 4) were observed when they were co-cultured with T cells and BIF002 (Fig. 3I). Furthermore, no difference on CFCs was observed in normal CD34+ BM cells co-cultured with BIF002 and T cells compared with those co-cultured with T cells alone or with BIF026 and T cells (Fig. 3J), supporting that BIF002 cytotoxicity spared normal HSCs.
BIF002 induces dose-dependent T cell activation, cytokine release and proliferation
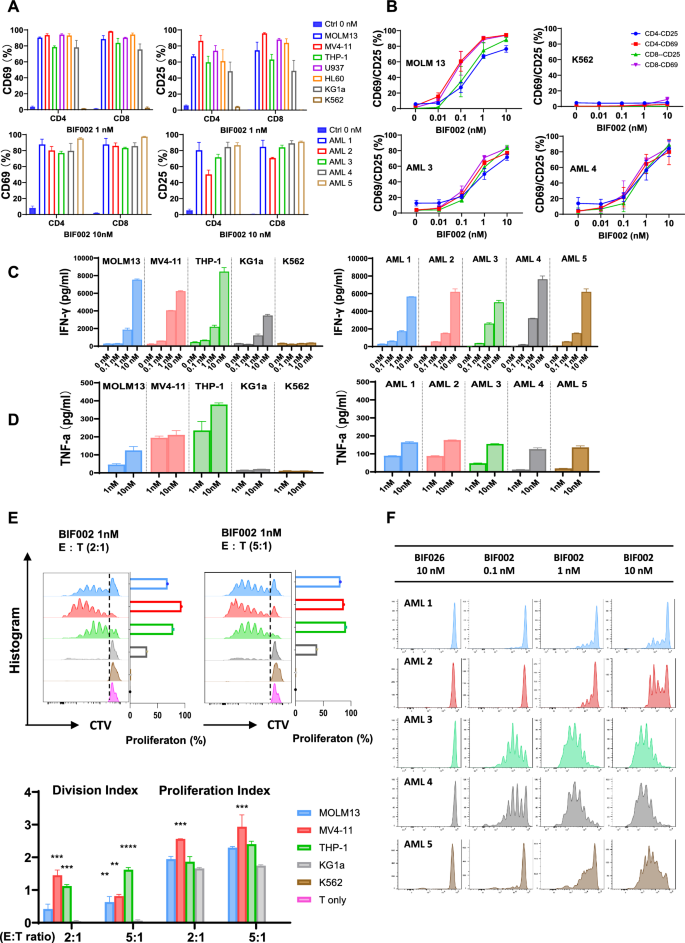
To test BIF002-induced T cells activation, AML cell lines or primary blasts were incubated with BIF002 (range 0.01–10 nM) and T cells at E:T ratio 5:1 for 48 h. T cells co-cultured with IL1RAPpos AML cells and BIF002 had a dose-dependent increase in the levels of activation marker CD25 and CD69 on both CD4+ and CD8+ subpopulations (Fig. 4A, B), and a dose-dependent increase in IFN-γ (BIF002 0.1 to 10 nM) and TNF-α (BIF002 1 to 10 nM) production as measured by ELISA (Fig. 4C, D), compared to untreated control cells. We confirmed these results with intracellular FCM, showing that BIF002 (0.1–10 nM) induced a dose-dependent IFN-γ production in T cells when incubated with AML cells for 48 h (Supplementary Fig. 8).
BIF002 induces IL1RAP dose-dependent T cell activation, cytokine release and T cell proliferation. A T cell activation, assessed by CD69 and CD25 expression levels analyzed by FCM, after co-culture with AML cell lines (top; vehicle-treated MOLM13 as control; n = 3 independent T cell donors) or primary AML blasts with different IL1RAP expression levels (bottom; vehicle-treated AML-2 as control; n = 3) at E:T ratio 5:1 for 48 h assessed by CD69 and CD25 expression levels. B BIF002 dose-dependent T cell activation after co-culture with AML cell lines (top; n = 3 independent T cell donors) or primary AML blasts with different IL1RAP expression levels (bottom; n = 3) at E:T ratio 5:1 for 48 h, assessed by CD69 and CD25 expression levels analyzed by FCM. IFN- γ (C) and TNF-α (D) release test in T cells co-cultured with AML cell lines and blasts and treated with BIF002 for 48 h, analyzed by ELISA (technical duplicate). The experiment was repeated with another donor, and similar results were obtained. E T cells were stained with CellTrace violet prior to co-culture with AML cell lines and BIF002 1 nM at E:T ratio 2:1 or 5:1 for 5 days. Representative plots of violet peaks representing successive generations of T cells (upper), and proliferation indexes (lower) of T cells after 5 days of co-culture (technical duplicate). Each successively dimer peak represents one cell division. Division Index is the average number of cell divisions by the original population that includes the undivided peak. Proliferation Index is the total number of divisions divided by the number of cells that went into division. All calculated by Flowjo. The data were analyzed by one-way ANOVA. AML cell lines were compared to KG1a which causes low T cell proliferation in the co-culture system. Additionally, no T cell proliferation was observed when co-cultured with K562, indicating a clear difference compared to other AML cell lines. F T cells were stained with CellTrace violet prior to co-culture with AML blasts and BIF002 at E:T ratio 2:1 for 5 days. Representative plots of violet peaks representing successive generations of T cells. Significance values: **p < 0.01; ***p < 0.001; ****p < 0.0001
To assess BIF002-induced T cell proliferation, we labeled T cells with cell trace ™ violet (CTV, Invitrogen) and incubated them with AML cell lines or primary blasts at E:T ratio of 2:1 or 5:1 in the presence of BIF002. On day 5, T cells’ proliferation was significantly increased, as indicated by multipeaked CTV signal and increased division and proliferation indexes (Fig. 4E, F). This effect was observed for both CD4+ and CD8+ T cell subpopulations (Supplementary Fig. 9A, B). T cell activation was not observed in co-cultures with IL1RAPlow/neg cells (i.e., K562) in the presence of BIF002 or with IL1RAPpos AML cells (i.e., MOLM13, MV4-11, THP-1, U937, HL60, KG1a and blast) in the absence of BIF002 (Fig. 4 A-C, E and F), suggesting that specific binding of BIF002 to both IL1RAP and CD3 antigens respectively on AML and T cells, was required for T cell activation and proliferation.
In vivo activity of BIF002
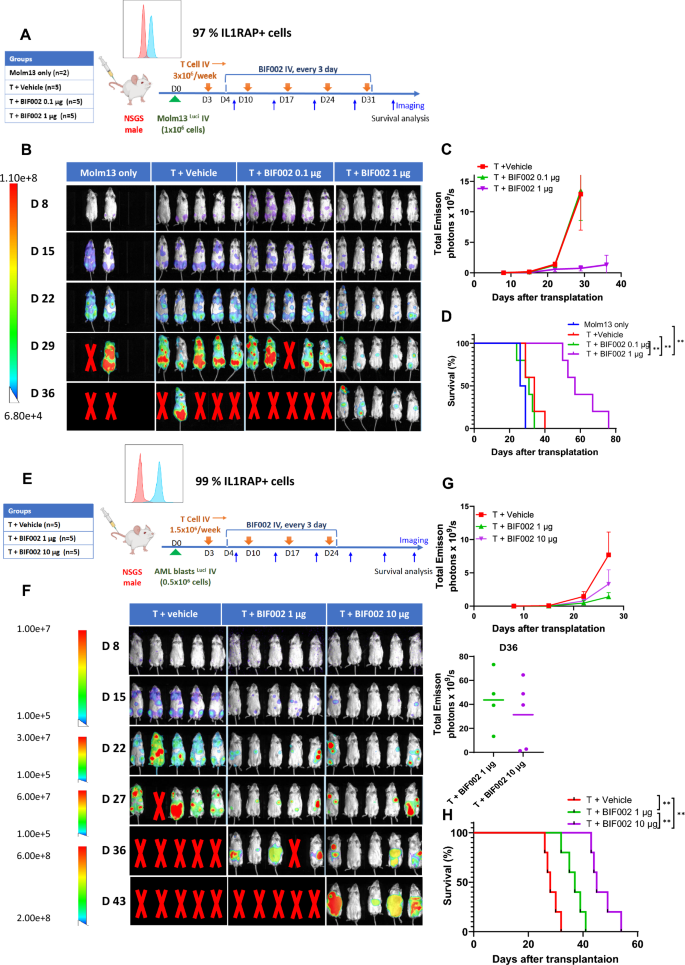
To investigate the in vivo activity of BIF002, we first generated MOLM13Luci xenograft by transplanting MOLM13Luci cells into NSGS mice and divided the mice randomly into 4 groups which were treated with 0.1 or 1 µg BIF002 q3d and in vitro Dynabead expanded healthy donor T cells, or T cells alone (n = 5) or vehicle (n = 2) (Fig. 5A). Mice treated with T cells + 1 µg of BIF002 had significantly lower tumor burden compared to the mice treated with T cells + 0.1 µg of BIF002 (p = 0.0014) or T cells alone (p = 0.0186) as measured by bioluminescence imaging (Fig. 5B, C) and survived significantly longer (median survival: 57 days) than the mice treated with T cells + 0.1 µg of BIF002 (31 days, p = 0.0018), T cells alone (34 days, p = 0.0019) or vehicle (27.5 days, p = 0.0082) (Fig. 5D).
In vivo efficacy and dose finding of BIF002 in AML mice models. A Schematic experimental design. Luciferase-expressing MOLM13 were transplanted into NSGS mice that were treated with: vehicle alone (n = 2) or T cells alone or with 0.1 µg or 1 µg BIF002 (n = 5 mice per group). B Tumor burden assessed using bioluminescent imaging of MOLM13-engrafted mice. C Quantitation of total bioluminescent signal (Total Emission) in each group at indicated times post-injection for MOLM13 model. D Log-rank (Mantel-Cox) test of cumulative survival rates for MOLM13-engrafted mice. E Schematic experimental design. Luciferase-expressing AML patient cells were transplanted into NSGS mice (PDX model). These mice were treated with: T cells alone or with 1 µg or 10 µg BIF002 (n = 5 mice per group). F Tumor burden assessed using bioluminescent imaging of PDX mice. G Quantitation of total bioluminescent signal of PDX mice. H Log-rank (Mantel-Cox) test of cumulative survival rates for PDX model. C and H were analyzed by two-way ANOVA with Tukey multiple comparisons tests. Significance values: *p < 0.05; **p < 0.01; ***p < 0.001; ****p < 0.0001
Based on these dose-finding results and on the higher IC50 we observed in primary blasts vs Molm13 cells, we then generated a PDX model by transplanting luciferase-expressing blasts (IL1RAP + cells 99%) from a complex karyotype R/R AML patient into NSGS mice and treated these mice with either 1 or 10 µg of BIF002 q3d and healthy donor T cells, or vehicle plus T cells (n = 5; Fig. 5E). Starting from Day 15, mice treated with T cells plus 1 µg (p = 0.0017) or 10 µg (p = 0.0008) of BIF002 exhibited a reduction in leukemia burden compared to the T cells + vehicle-treated mice measured by luminescence signals (Fig. 5F-G). Treatment with 10 µg BIF002+T cells resulted in a significantly longer survival (median: 45 days) than treatment with 1 µg BIF002+T cells (37 days, p = 0.0018) or vehicle + T cells (28 days, p = 0.0018) (Fig. 5H).
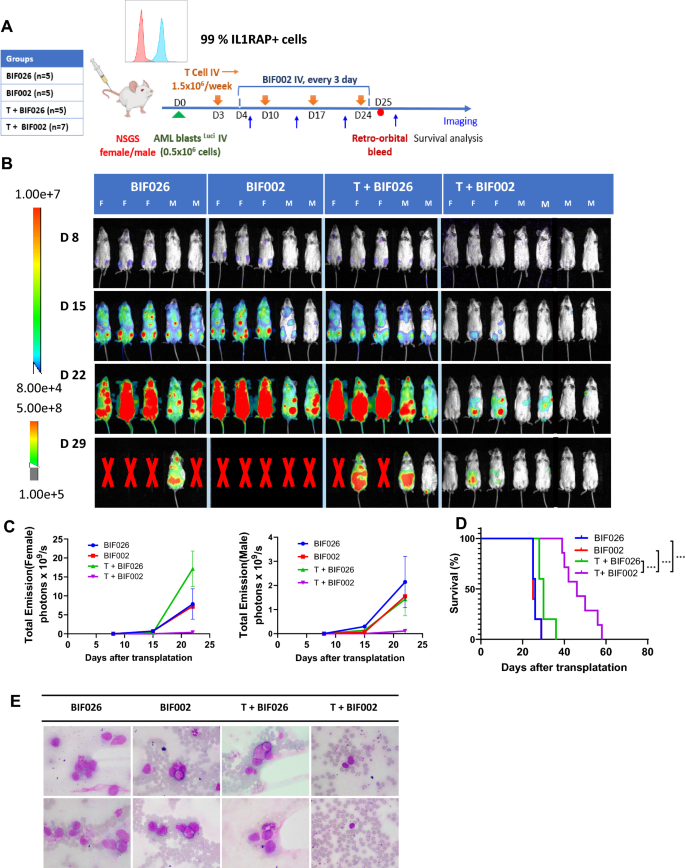
To confirm these results, we repeated this experiment by treating the luciferase-expressing PDX mice with 10 µg BIF002 or the mutated control antibody BIF026 to confirm the specificity of BIF002, q3d for 3 weeks (Fig. 6A). Mice treated with T cells + BIF002 had 20 to 70-fold reduction in disease burden measured by luminescence signals and fewer circulating blasts and eventually survived longer than the mice treated with control antibody BIF026, BIF002 alone, or T cells + BIF026 (median survival: 46 vs 26, 25 or 30 days, respectively, p = 0.0003 for each group compared to T cells + BIF002) (Fig. 6B–E). All the mice eventually died of leukemia after the treatment was stopped.
In vivo efficacy of BIF002 in the luciferase-expressing AML PDX Model. A Schematic experimental design. Luciferase-expressing AML patient cells were transplanted into NSGS mice that were then treated with: 10 µg control Ab BIF026, 10 µg BIF002, T cells + 10 µg BIF026, or T cells + 10 µg BIF002 (n = 5–7 mice per group). B Tumor burden assessed using bioluminescent imaging. C Quantitation of total bioluminescent signal (Total Emission) in each group at indicated times post-injection. D Log-rank (Mantel-Cox) test of cumulative survival rates. E Representative Wright-Giemsa stain of peripheral blood by microscope (n = 2, 1000X magnification). Significance values: *p < 0.05; **p < 0.01; ***p < 0.001; ****p < 0.0001
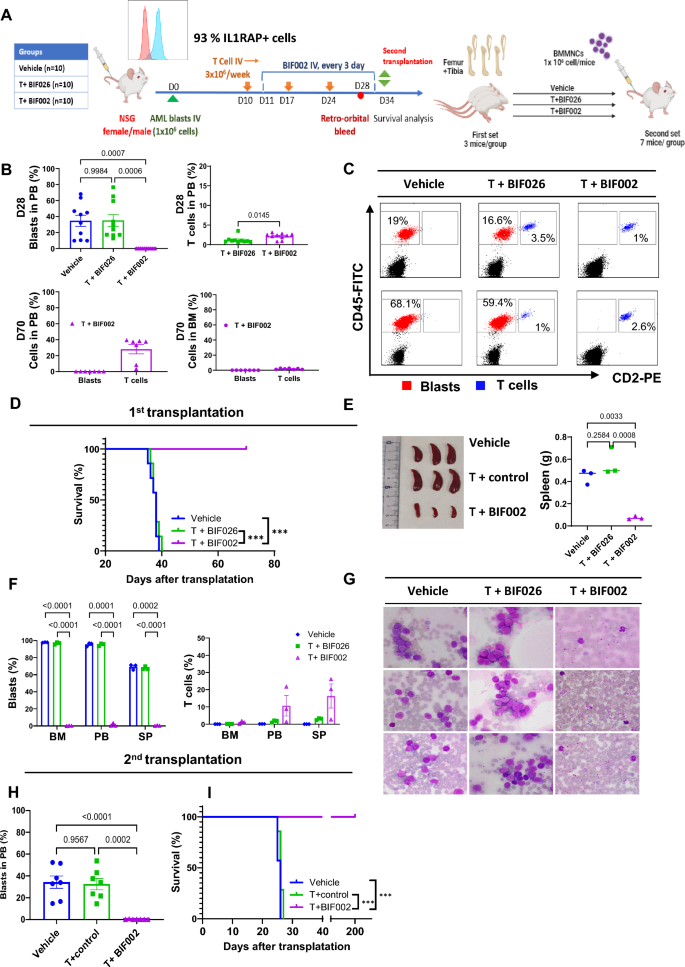
To explore if BIF002 targeted LSCs, we then generated a PDX model by transplanting primary blasts from a relapsed, complex karyotype AML patient with 93% IL1RAP + cells into NSGS mice (Fig. 7A) and treated these mice with T cells plus 10 µg BIF002 or control BIF026 or vehicle, starting on day 10 after transplant, for 3 weeks. On day 28, we observed a significant reduction of circulating blasts in the mice receiving T cells + BIF002 (0%) compared with those receiving T cells + BIF026 (35.1 ± 7.4%, p = 0.0006) or vehicle (34.7 ± 6.9%, p = 0.0007) (Fig. 7B, C). After monitoring for 70 days post-transplant, all the mice treated with T cells + BIF002 were alive, with no detectable PB or BM blasts, while all T cells + BIF026 (median survival: 38 days, p = 0.0001) or vehicle (38 days, p = 0.0002) -treated mice had already died of leukemia (Fig. 7B, D).
In vivo efficacy of BIF002 in the AML PDX Model with second transplantation. A Schematic experimental design. Blasts from a relapsed AML patient were transplanted into NSGS mice that were then treated with: vehicle, T cells + 10 µg control BIF026, or T cells + 10 µg BIF002 (n = 10 mice per group). On Day 34, BMMNCs were harvested from 3 mice/group and transplanted into NSGS recipient mice (n = 7/group) without further treatment. B Blasts and human T cell populations at Day 28 (upper) and at Day 70 (lower) by flow cytometry (FCM). C Representative Flow plots of blasts and T cells at Day 28 (n = 2). D Log-rank (Mantel-Cox) test of cumulative survival rates on first transplantation (n = 7). E Spleen size and weight of different groups. F Blasts and human T cell populations in bone marrow, peripheral blood, and spleen at the time for the second transplantation by FCM (n = 3). G Wright-Giemsa stain of peripheral blood by microscope (n = 3, 1000X magnification). H Blasts and human T cell populations at Day 21 in second transplantation mice peripheral blood by FCM. I Log-rank (Mantel-Cox) test of cumulative survival rates on the second transplantation (n = 7). B (left), E and H were analyzed by one-way ANOVA with Tukey multiple comparisons tests, F were analyzed by two-way ANOVA with Tukey multiple comparisons tests, and B(right) were analyzed by unpaired Student’s t test. Significance values: *p < 0.05; **p < 0.01; ***p < 0.001; ****p < 0.0001
For the secondary (2nd) transplant experiment, we then randomly selected 3 female mice from each group on day 34 post-transplant, harvested BM and transplanted 106 MNCs into 2nd NSGS recipients (n = 7 per group). At the time of the BM harvest, the donors treated with vehicle (spleen weight 0.447 g, p = 0.0033) or T + BIF026 (0.565 g, p = 0.0008) had significantly larger spleens than those treated with T + BIF002 (0.072 g) (Fig. 7E). Near 100% PB and BM blasts and 70% splenic blasts were detected in the mice treated with T + BIF026 or vehicle, while leukemia clearance (1.3%, 0.2%, 0.4% PB, BM and splenic blasts, respectively) was observed in the T cells + BIF002 treated group (Fig. 7F-G). Of note, treatment with T cells + BIF002 eliminated LSCs as supported by lack of disease on Day 21 after transplantation, in the 2nd recipients of BMMNCs from T + BIF002-treated donors compared with the recipients of BMMNCs from vehicle- (34.3 ± 5.6%, p < 0.0001) or T + BIF026- (32.5 ± 5.2%, p = 0.0002) treated donors (Fig. 7H). Of note, all the recipients of T + BIF002-treated donor BM survived over 200 days, and the recipients of BM from vehicle (median survival 26 days; p = 0.0004) or T cells + BIF026 (26 days; p = 0.0002) -treated donor BM died within 30 days (Fig. 7I). At the end of the observation, none of the mice transplanted with T cell + BIF002-treated donor BM showed detectable blasts in the PB and BM, suggesting LSCs were eradicated.


Add Comment