Study and data selection
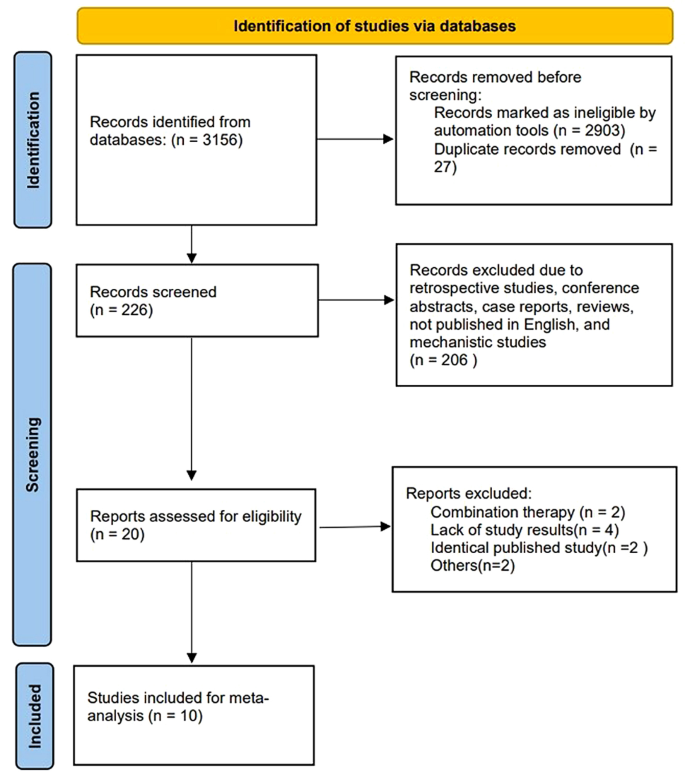
The study selection process is summarized in Fig. 1. We retrieved 3156 records from the primary search strategy, of which 2903 were removed for non-clinical trials. Twenty-seven records were excluded for duplicate results. Two hundred and six records were further excluded due to retrospective studies, conference abstracts, case reports, reviews, not published in English, and mechanistic studies. Twenty studies were assessed for eligibility, and ten studies were excluded (combination therapy = 2, lack of study results = 4, identical published study = 2, others = 2). Ultimately, ten studies with 925 patients were enrolled in this meta-analysis.
Study characteristics and quality assessment
The characteristics of the ten studies are shown in Table 1. Five studies used sotorasib [11,12,13,14,15], three studies used adagrasib [16, 18, 20], the other two studies used divarasib [19] and garsorasib [17], respectively. Seven studies reported NSCLC patients’ results [11, 12, 15,16,17,18,19], five studies reported CRC patients’ results [11, 14, 18,19,20], and four studies reported other (mostly pancreatic cancer and a variety of other tumors such as appendix, bile duct, endometrial, gastric and so on) patients’ results [11, 13, 18, 19]. The vast majority of studies included patients with a median No. of previous treatment lines ≥ 2. For NSCLC population, five studies were median No. of previous treatment lines = 2, the other one was 3. However, for CRC population, all four studies were median No. of previous treatment lines ≥ 3. And for other solid tumors, one study was median No. of previous treatment lines = 1, one was 2, and the other one was 3. Nine studies reported the results of median follow-up, and the shortest median follow-up time was 8.8 months (95% CI, 0.7–14.9).
The nine non-randomized controlled trials (RCT) studies without the control group scored 12–14 of 16, and the other RCT study scored 24 of 24 on MINORS (Supplement Table S1). The MINORS results suggested consistent high methodological quality for the included studies.
Pooled analysis of ORR and DCR
The pooled results of ORR were 28.6% (95%CI, 21.2-36.6%, I2 = 81.23%) for total population, 40.0% (95%CI, 32.2-48.2%, I2 = 73.21%) for NSCLC patients, 16.3% (95%CI, 5.7-30.1%, I2 = 76.78%) for CRC patients, 19.5% (95%CI, 9.5-31.6%, I2 = 24.35%) for other cancers (Fig. 2A), 23.0% (95%CI, 15.0-32.2%, I2 = 80.43%) for sotorasib monotherapy, 33.2% (95%CI, 17.9-50.5%, I2 = 76.65%) for adagrasib monotherapy (Fig. 2B), 36.3% (95%CI, 26.9-46.2%, I2 = 78.15%) for median NO. of previous treatment lines ≤ 2, and 26.7% (95%CI, 13.6-41.9%, I2 = 75.14%) for median NO. of previous treatment lines > 2 (Supplement Figure S1A). NSCLC had significantly higher pooled ORR compared with CRC (OR, 3.36, 95%CI, 2.56–5.02, p < 0.0001) and other cancers (OR, 2.70, 95%CI, 1.58–4.60, p = 0.0002). Sotorasib had significantly lower pooled ORR compared with adagrasib (OR, 0.60, 95%CI, 0.42–0.87, p = 0.0073). The patients with median NO. of previous treatment lines ≤ 2 had significantly higher pooled ORR compared with > 2 lines (OR, 1.56, 95%CI, 1.09–2.22, p = 0.0137, Table 2).
The pooled results of DCR were 85.5% (95%CI, 82.2-88.6%, I2 = 29.81%) for total population, 86.3% (95%CI, 81.3-90.8%, I2 = 60.67%) for NSCLC patients, 84.1% (95%CI, 78.3-89.3%, I2 = 0.00%) for CRC patients, 83.5% (95%CI, 74.0-91.5%, I2 = 0.00%) for other cancers (Fig. 2C), 81.5% (95%CI, 78.0-84.7%, I2 = 0.00%) for sotorasib monotherapy, 85.8% (95%CI, 76.3-93.3%, I2 = 51.56%) for adagrasib monotherapy (Fig. 2D), 85.4% (95%CI, 80.9-89.4%, I2 = 37.64%) for median NO. of previous treatment lines ≤ 2, and 88.5% (95%CI, 82.5-93.6%, I2 = 14.52%) for median NO. of previous treatment lines > 2 (Supplement Figure S1B). The pooled DCR was not significantly different between NSCLC and CRC (OR, 1.21, 95%CI, 0.78–1.87, p = 0.397), NSCLC and others (OR, 1.25, 95%CI, 0.69–2.26, p = 0.465), sotorasib and adagrasib (OR, 0.72, 95%CI, 0.45–1.16, p = 0.18), median NO. of previous treatment lines ≤ 2 and > 2 (OR, 0.75, 95%CI, 0.46–1.22, p = 0.25, Table 2).
Pooled analysis of time to response and DOR
There were 221 individual data of time to response and DoR were extracted. The median time to response was 1.39 months (95%CI, 1.37–1.41 months) for total population, 1.41 months (95%CI, 1.38–1.44 months) for sotorasib monotherapy, 1.36 months (95%CI, 1.33–1.39 months) for adagrasib monotherapy, and 1.38 months (95%CI, 1.33–1.43 months) for garsorasib monotherapy.
The median DoR was 10.54 months (95%CI, 7.72–13.36 months) for total population, 11.06 months (95%CI, 8.02–14.10 months) for NSCLC patients, 5.68 months (95%CI, 4.13–7.23 months) for non-NSCLC patients (Fig. 3A), 10.77 months (95%CI, 7.42–14.12 months) for sotorasib, 8.49 months (95%CI, 3.63–13.35 months) for adagrasib, not evaluable for garsorasib (Fig. 3B). NSCLC patients had significantly better DoR than non-NSCLC patients (Log-rank, p = 0.009). However, DoR was not significantly different among the three drugs (Log-rank, sotorasib VS adagrasib, p = 0.35; sotorasib VS garsorasib, p = 0.92; adagrasib VS garsorasib, p = 0.41).
Pooled analysis of PFS
The pooled PFS rates at 6 months (PFS6) were 48.2% (95%CI, 40.2-56.3%, I2 = 80.73%) for total population, 56.7% (95%CI, 49.3-64.0%, I2 = 67.32%) for NSCLC patients, 35.7% (95%CI, 23.4-49.0%, I2 = 72.73%) for CRC patients (Fig. 4A), 39.4% (95%CI, 29.6-49.6%, I2 = 79.22%) for sotorasib monotherapy, 51.5% (95%CI, 43.8-59.1%, I2 = 0.00%) for adagrasib monotherapy (Supplement Figure S2A), 54.1% (95%CI, 44.5-63.6%, I2 = 80.30%) for median NO. of previous treatment lines ≤ 2, and 42.6% (95%CI, 26.6-59.3%, I2 = 78.02%) for median NO. of previous treatment lines > 2 (Supplement Figure S2B).The pooled PFS rates at 12 months (PFS12) were 26.7% (95%CI, 19.8-34.1%, I2 = 78.79%) for total population, 32.3% (95%CI, 24.9-40.2%, I2 = 73.20%) for NSCLC patients, 13.7% (95%CI, 8.6-19.6%, I2 = 0.00%) for CRC patients (Fig. 4B), 22.0% (95%CI, 16.0-28.7%, I2 = 56.90%) for sotorasib monotherapy, 28.0% (95%CI, 13.2-45.5%, I2 = 75.54%) for adagrasib monotherapy (Supplement Figure S2C), 32.5% (95%CI, 24.1-41.6%, I2 = 78.43%) for median NO. of previous treatment lines ≤ 2, and 18.8% (95%CI, 8.7-31.3%, I2 = 70.20%) for median NO. of previous treatment lines > 2 (Supplement Figure S2D).
NSCLC had significantly higher pooled PFS6 (OR, 2.36, 95%CI, 1.70–3.28, p < 0.0001) and PFS12 (OR, 2.97, 95%CI, 1.93–4.56, p < 0.0001) compared with CRC. Sotorasib had significantly lower pooled PFS6 compared with adagrasib (OR, 0.61, 95%CI, 0.43–0.87, p = 0.0057); however, the pooled PFS12 was not significantly different (OR, 0.73, 95%CI, 0.49–1.08, p = 0.11). The patients with median NO. of previous treatment lines ≤ 2 had significantly higher pooled PFS6 (OR, 1.58, 95%CI, 1.13–2.23, p = 0.0078) and PFS12 (OR, 2.09, 95%CI, 1.38–3.17, p = 0.0005) compared with > 2 lines (Table 2).
Pooled analysis of OS
The pooled OS rates at 6 months (OS6) were 76.2% (95%CI, 68.8-82.9%, I2 = 70.55%) for total population, 73.0% (95%CI, 68.6-77.2%, I2 = 0.00%) for NSCLC patients, 88.1% (95%CI, 81.1-93.8%, I2 = not applicable) for CRC patients (Fig. 4C), 73.6% (95%CI, 65.4-81.1%, I2 = 64.17%) for sotorasib monotherapy, 80.9% (95%CI, 62.0-94.7%, I2 = 82.01%) for adagrasib monotherapy (Supplement Figure S3A), 71.2% (95%CI, 66.0-76.2%, I2 = 28.19%) for median NO. of previous treatment lines ≤ 2, and 86.4% (95%CI, 75.9-94.5%, I2 = 47.16%) for median NO. of previous treatment lines > 2 (Supplement Figure S3B). The pooled OS rates at 12 months (OS12) were 47.8% (95%CI, 38.6-57.0%, I2 = 76.58%) for total population, 49.6% (95%CI, 44.8-54.5%, I2 = 0.00%) for NSCLC patients, 53.0% (95%CI, 43.3-62.5%, I2 = not applicable) for CRC patients (Fig. 4D), 40.7% (95%CI, 29.5-52.4%, I2 = 79.55%) for sotorasib monotherapy, 58.9% (95%CI, 46.4-70.9%, I2 = 51.23%) for adagrasib monotherapy (Supplement Figure S3C), 43.1% (95%CI, 32.3-54.3%, I2 = 80.94%) for median NO. of previous treatment lines ≤ 2, and 56.7% (95%CI, 37.9-74.7%, I2 = 73.59%) for median NO. of previous treatment lines > 2 (Supplement Figure S3D).
NSCLC had significantly lower pooled OS6 (OR, 0.38, 95%CI, 0.20–0.69, p = 0.0015) compared with CRC; however, the pooled OS12 was not significantly different (OR, 0.88, 95%CI, 0.58–1.35, p = 0.56). Sotorasib had significantly lower pooled OS12 compared with adagrasib (OR, 0.48, 95%CI, 0.33–0.68, p = 0.0001); however, the pooled OS6 was not significantly different (OR, 0.67, 95%CI, 0.43–1.03, p = 0.066). The patients with median NO. of previous treatment lines ≤ 2 had significantly lower pooled OS6 (OR, 0.40, 95%CI, 0.23–0.69, p = 0.0008) and OS12 (OR, 0.58, 95%CI, 0.39–0.87, p = 0.0077) compared with > 2 lines (Table 2).
Pooled analysis of trAEs
The pooled incidences of any grade trAEs were 79.3% (95%CI, 66.2-90.0%, I2 = 94.89%) for total population, 60.3% (95%CI, 51.2-69.0%, I2 = 75.72%) for sotorasib monotherapy, 95.9% (95%CI, 91.3-99.0%, I2 = 22.82%) for adagrasib monotherapy (Fig. 5A). The pooled incidences of grade three or more trAEs were 24.4% (95%CI, 16.7-32.9%, I2 = 87.42%) for total population, 18.5% (95%CI, 10.8-27.6%, I2 = 82.72%) for sotorasib monotherapy, 39.9% (95%CI, 32.8-47.2%, I2 = 0.00%) for adagrasib monotherapy (Fig. 5B). Sotorasib had significantly lower pooled incidences of any trAES (OR, 0.07, 95%CI, 0.03–0.14, p < 0.0001) and grade three or more trAEs (OR, 0.34, 95%CI, 0.24–0.49, p < 0.0001) compared with adagrasib (Table 2).
There were 20 specific trAEs which were reported in at least three studies (Supplement Table S2). Diarrhoea, nausea, vomiting, fatigue, ECG QT prolonged, aspartate aminotransferase (AST) increased, alanine aminotransferase (ALT) increased, amylase increase, blood creatinine increase/acute kidney injury, decreased appetite, and anaemia were the very common (≥ 10%) any grade trAEs. Alkaline phosphatase increased, lipase increased, dysgeusia, edema peripheral, hyponatremia, abdominal pain, pneumonitis, lymphocyte count decrease, and neutrophil count decrease were the common (< 10%, ≥ 1%) any grade trAEs.
ALT increased, AST increased, diarrhoea, ECG QT prolonged, lipase increased, anaemia, fatigue, alkaline phosphatase increased, amylase increased, and hyponatremia were the common grade three or more trAEs. Blood creatinine increase/acute kidney injury, pneumonitis, lymphocyte count decrease, decreased appetite, nausea, neutrophil count decrease, abdominal pain, and vomiting were the uncommon (< 1%, ≥ 0.1%) grade three or more trAEs (Supplement Table S3). The other reported grade three or more specific trAEs were rare (< 0.1%, ≥ 0.01%) or very rare (< 0.01%).
Subgroup analyses for the incidences of the 20 specific trAEs by different drugs are also shown in Table S2 and Table S3. Most of the any grade specific trAEs were more common for adagrasib compared with sotorasib. However, for the grade three or more specific trAEs, some were more common for adagrasib while some others were not.
Publication bias analysis
The publication bias was analyzed by Egger’s test. The p-values of ORR, DCR, PFS6, PFS12, OS6, OS12, incidence of any trAEs, and incidence of grade three or more trAEs were 0.454, 0.402, 0.740, 0.671, 0.676, 0.996, 0.974, and 0.846, respectively (Supplement Figure S4). These results did not indicate any publication bias.


Add Comment