

Screening for proteolytic activity
Thermophilic bacterial strains demonstrating protease activity were isolated from municipal soil waste. Pure strains that produced protease activity were selected by screening for colonies that generated large clearings on agar plates containing 1% casein at 60◦C. These strains were analyzed further for the capacity to secrete protease activity into liquid culture containing 1% casein at 60◦C. The thermophilic BSP isolate was found to demonstrate some of the highest protease activity. This strain was characterized as an aerobic, motile, rod-shaped, Gram-positive, catalase-positive, indole-negative bacterium. Based on these characterizations, this isolate was designated as Bacillus subtilis BSP, a thermophilic protease producer. This strain was picked for additional research on protease characterization, scaling up, and production.
The 16 S rRNA gene sequence was sequenced and submitted to GenBank (accession number EF644419.1). The phylogenetic tree is shown in Fig. 1. The 16sRNA gene sequence similarity demonstrated that this strain belongs to various Bacillus sp. strains with 98–99% similiarity. The close matching strains were Bacillus subtilis strain ADA-2, Bacillus nakamurai strain, Bacillus oceanisediminis strain, Bacillus velezensis strain SHZ-30, Bacillus cereus strain LD170, Bacillus pumilus strain Hr8, Bacillus velezensis strain SM-24, Bacillus stercoris strain JCM and Bacillus rugosus strain SPB7.

Neighbor joining tree showing the phylogenetic relationship of the Bacillus subtilis BSP strain with the related species based on the 16sRNA sequences
Screening of significant factors using a conventional approach
The one variable at a time (OVAT) methodology was run to check the effects of initial pH, fermentation time, temperature, and casein concentration upon protease production in shake flasks. Protease activities may differ depending on pH levels. Each protease has a specific pH range for optimal activity. It is noteworthy that pH sensitivity of protease activity can differ depending on protease type and substrate used. Therefore, determining the optimal pH range for a specific protease is crucial to obtain maximum activity. In this study, the protease was highly active between pH 3 and 11. The optimal pH for protease production was determined by using 1% casein to induce enzyme production and varying the initial pH (3.0–11.0) of the growth medium containing 1% casein at 60◦C (Fig. 2a). B. subtilis BSP was capable to synthesize and express protease across a different choice of culture pH (3.0–9.0), whereas the pH 8.0 resulted in the highest protease production (184 U/mL). At pH 10.0, the enzyme level was dramatically decreased. B. subtilis BSP was also found to produce protease enzyme across all the temperatures studied (40˚C to 90˚C) at pH 8 and 1% casein as substrate (Fig. 2b); however, 60˚C was the optimum temperature for protease production (179 U/mL). Previously it is reported that the protease is active at pH levels ranging from 5 to 11. Similarly, another specific protease has been found to be active between pH 2 and 12. The optimum pH and temperature values reported in this study for protease production are similar to those of other thermophilic Bacillus sp [9, 10].
Tracking protease production across various time points indicated that a fermentation time of 48 h led to the highest enzyme production (179 U/mL) (Fig. 2c). Protease levels decreased from 60 to 72 h. Previous reports of Bacillus sp. GUS1 and Bacillus sp. P003 showed that these strains had maximum protease production during the stationary phase of growth [11]. In addition, optimum production occurred at 36 h for Bacillus sp. subtilisin protease and 72 h for Bacillus licheniformis (MTC NO. 7053) alkaline protease [12,13,14].
The composition of the growth medium was optimized by varying the concentration of the casein substrate which serves as a protease production inducer. Optimum enzyme production (165 U/mL) was observed when using 1% casein (Fig. 2d). A lower casein concentration (0.5%) reduced protease production while the maximum substrate concentration tested (3%) resulted in the lowest protease production.
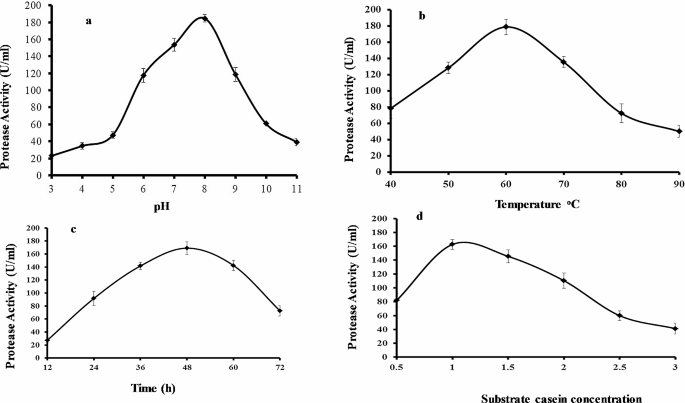
Results of experimental conditions on protease production by Bacillus subtilis BSP. (a) Effect of initial pH after 48 h fermentation at 60oC. (b) Effect of temperature after 48 h fermentation at pH 8.0. (c) Effect of fermentation time at pH 8.0 and 60oC. (d) Effect of casein concentration after 48 h fermentation at pH 8.0 and 60oC
Statistical Box-Behnken design matrix, model fitting, and analysis of variance (ANOVA)
To further optimize protease production, a response surface methodology (RSM) was employed. A Box-Behnken design with four factors was utilized to fit a second-order polynomial model, which resulted in 29 experimental setups to conduct for the optimization study. Table 1 demonstrates the experimental strategy and associated protease yields.
Box–Behnken design was used to evaluate the collective effects of 04 parameters (pH, fermentation time, inoculum density, and substrate concentration) on B. subtilis BSP protease secretion. Table 2 represents the design with three replicates showing the predicted responses based on a polynomial equation. ANOVA is a statistical technique used to determine the significance of a proposed model and its parameters. In general, higher F-values and lower p-values are indicative of significant coefficient terms [15]. ANOVA analysis suggested a regression equation with the terms of protease activity (Y) as a response to inoculum density (D), substrate concentration (C), pH (B), and fermentation time (A) as follows:
$$\begin{array}{l}Y = 280.88 + 13.46A + 6.22B – 5.19C – 0.57D – \\0.72AB – 2.29AC + 17.80AD – 14.56BC + 6.50BD + \\12.30CD – 26.08{A^2} – 72.71{B^2} – 23.17{C^2} – 29.00{D^2}\end{array}$$
(3)
A linear model’s percentage of variation in the response variable is shown by the R-Squared (coefficient of determination). R-Squared is a measure of how well a model matches experimental data [16]. Model fit is thought to be good when the R-Squared value is at least 0.8. R-Squared values of 0.9913 and 0.9827 for the adj R-Squared value in this analysis showed that the proposed response model can describe the reaction very well at a 95% confidence level. A difference between Pred R-Squared and Adj R-Squared of less than 0.2 is ideal, and this desirable state is reflected in the values of Pred R-Squared (0.9779) and Adj R-Squared (0.9870). The Adeq Precision ratio (signal-to-noise ratio), which in this case was 31.886, illustrates the model’s good fit. A ratio above 4 is ideal. With a noise-related error chance of only 0.01%, the F-value of 114.27 validates the model’s significance. The model terms are likely to be extremely important if the values for “Prob > F” is less than 0.0500. The linear fermentation time (A-Time), the interaction of the fermentation time and inoculum size (AD), the interaction of the pH and substrate concentration (BC), the fermentation time (A2), the pH (B2), the substrate concentration (C2), and the inoculum size (D2) were found to be significant model terms in this study (P0.0001) with a cutoff of P > 0.1000.
Response surface analysis
Three dimensional plots were obtained in order to study the effect of the combined relations of the factors being studied and to identify the optimal value of each variable at which maximum protease yield was achieved (Fig. 3). Figure 3a shows the effect of fermentation period and pH on protease production when inoculum density and casein concentration were kept constant. Protease yield increased with increasing pH up to pH 8.0 at the ideal fermentation period of 64 h. Protease production declined when the pH was more acidic or basic than pH 8.0 and when the fermentation time exceeded 64 h. The 3D response surface plot for the interaction of casein content and fermentation time is shown in Fig. 3b. The highest alkaline protease yield was achieved at a casein concentration of 2.5% and a fermentation time of 72 h. As displayed in Fig. 3c, the highest yield of alkaline protease occurred when the volume of inoculum density ranged from 0.9 to 1%, and the fermentation period was between 48 and 56 h. According to Fig. 3d, protease synthesis rose when the substrate concentration was increased to 2% and the pH was raised to 8.0. The impact of the combined interaction of pH and inoculum density on enzyme synthesis can be observed in Fig. 3e. Up to 1% inoculum densities and pH 8 resulted in higher protease yields. At inoculum densities exceeding 1% and pH levels above 8.0, the synthesis of enzymes dropped. The interaction effect of casein concentration (1–3%) and inoculum density (1–3%) on protease synthesis is shown in Fig. 3f. A 1.8% casein concentration and 1% inoculum density resulted in the highest enzyme yield. The quadratic mode equation was solved to get the best values of each variable for maximum protease activity. It was discovered that pH 8.0, 1% inoculum density, 72 h of fermentation, and 1% casein content were the best values for each variable. At these conditions, a response in protease activity of 295 U/mL was observed.

Response-surface plots of protease production Bacillus subtilis BSP showing mutual interactions
Expression and purification of protease
Using the optimized parameters calculated from the RSM results, four 500 mL Erlenmeyer flasks each containing 250 mL media were used to produce protease enzyme.
At the harvesting point, fermented broth was centrifuged at 10,000 rpm for 10 min at 4oC and the enzyme activity was measured. The protease activity was increased 2.1 fold in the synthetic medium when compared to that of complex media. Among the complex media, the foxtail millet medium showed higher protease activity. Protease was partially purified from cell free filtrate of Bacillus amyloliquefaciens TSA-2 cultured by employing ammonium sulphate precipitation followed by dialysis. Maximum amount of protein was precipitated at 70–80% saturation of ammonium sulphate. The outcome of ammonium sulphate precipitation was 1.56- fold increase in purity and 80.5% yield of protease. When the precipitated protein was dialysed, the purification was further increased to 1.35 fold with 71.3% yield.
A protease enzyme exhibiting a specific activity of 39.3 U/mg was detected in the supernatant of a bacterial culture, which contained a crude enzyme with a protein concentration of 560 mg. This enzyme was subsequently enriched through ammonium sulfate precipitation. The resulting precipitate was then resuspended and the protein was further purified using DEAE-cellulose ion exchange chromatography. Following ammonium sulfate precipitation, the enzyme exhibited a specific activity of 58.2 U/mg with a protein concentration of 208 mg. Dialysis further increased the enzyme’s specific activity to 71.1 U/mg, with a concentration of 107 mg. The DEAE-cellulose ion exchange chromatography step yielded 36 mg of protein and resulted in an enzyme specific activity of 111.3 U/mg. After the partial purification fractions obtained from the Sephadex G-200 gel filtration column, the protein yield was 3.34 mg, and the enzyme’s specific activity was further enhanced to 180.2 U/mg. On SDS-PAGE, the isolated protease was present as a partially purified fractions, with a symmetrical 36 kDa band (Fig. 4). Many Bacillus species have been reported with variety of molecular masses for proteases: thermostable protease (49 kDa) from Bacillus strain HUTBS71 [17]; thermostable proteases of (36 kDa) from Bacillus stearothermophilus TLS33 [18]; Bacillus licheniformis VSG1has (40 kDa) [19]; (28 kDa from Bacillus pumilus MK6-5 [20]; metalloserine protease of (36 kDa) from Brevibacillus thermoruber LII [21]; and an alkaline serine proteases of (37–40 kDa) from thermophilic Bacillus sp. GUS1 [15, 22].

SDS–PAGE of the thermostable protease from Bacillus subtilis BSP. Lane 1, molecular weight markers; lane 2, culture supernatant; lane 3, dialyzed protease after ammonium sulfate precipitation; lane 4, protease purified from DEAE-cellulose column; and lane 5–10, Sephadex G-200 purified protease. 12–120 kDa Protein Marker, Catalogue No: abx098114
Determination of optimum pH and temperature
The enzyme activity was analyzed at various pH ranging from pH 3.0 to pH 11.0 (Fig. 5a). The maximum protease activity was observed at pH 8.0. The enzyme also had significant activity from pH 6.0 to pH 9.0 with 83% and 51% relative proteolytic activity at these conditions, respectively.
The protease activity was also investigated at various temperatures ranging from 40–90ºC at pH 8.0 (Fig. 5b). The optimum temperature for protease activity was 50ºC. The enzyme activity decreased at temperatures above 60ºC. The thermostability of the protease was examined by heat treating the protease at different temperatures (40–90ºC) without substrate for 60 min, and the relative residual activity was assayed at 50ºC (Fig. 5b). The protease had high stability at 40ºC and 50 °C and retained 73% of its original activity even after heat treatment at 70ºC. However, 84% of the enzyme activity was lost after incubation at 80ºC [23].

Effects of pH and temperature on protease activity. (a) Protease activity assay was conducted at various pH at 50 °C. (b) Protease activity assay was conducted at various temperatures at pH 8.0 (■). Protease was pre-incubated at different temperatures before assaying for residual activity at 50 °C at pH 8.0 (▲)
Effect of metal ions, organic solvents, surfactants, and inhibitors on protease activity
Different metal ions (Co+ 2, Ca+ 2, Cu2+, Mg+ 2, Fe+ 2, Mn+ 2, Ni2+ and Zn+ 2), organic solvents (methanol, ethanol, benzene hexane, and dimethyl sulfoxide (DMSO)), various surfactants (Triton X-100, sodium dodecyl sulfate (SDS), Tween-20, Tween-80, H2O2, and potential inhibitors dithiothreitol (DTT), (β-mercaptoethanol (β-ME), iodoacetamide (IAA), ethylenediaminetetraacetate (EDTA), phenylmethylsulfonyl fluoride (PMSF)) were checked to analyze any effects that these reagents might have upon the B. subtilis BSP protease activity.
The enzyme activity was stimulated by the Ca+ 2 and Fe+ 2 cations (Table 3). In contrast, Cu2+ dramatically reduced protease activity to 23%. The protease activity was decreased to a lower extent by the Ni+ 2, Mg+ 2, Zn+ 2, and Co+ 2 cations. The Mn+ 2 cation was found to have little effect upon the enzyme activity. Similarly, a purified detergent-stable, solvent-tolerant protease STAP and a Bacillus stearothermophilus alkaline protease [24] were reported to also be stimulated by Ca2+ cation.
The B. subtilis BSP protease was found to be quite stable in the presence of many organic solvents (Table 3). The enzyme was tolerant in 10% benzene, ethanol, and methanol. Hexane had the greatest impact by reducing the enzyme activity to 76%. In addition, 10% DMSO reduced the enzyme activity to a lesser extent (83%).
The B. subtilis BSP protease also retained activity in the presence of many surfactants (Table 3). The protease maintained 97% of its activity in 10% (v/v) Triton X-100. A similar degree of stability against this detergent was reported for the Bacillus pumilis KS12 keratinase [25]. The B. subtilis BSP protease activity was decreased to a slightly greater degree by 10% H2O2. Interestingly, the protease activity was enhanced to 112% by the presence of 10% SDS. This is the first report of an SDS-stimulated protease from a Bacillus sp. The fact that the enzyme was tolerant to the tested surfactants and oxidants indicates that the structure of the protein is likely well-packed with rigid native conformation.
The proteolytic activity was decreased by all the inhibitors (5mM) tested (Table 3). When exposed to EDTA, the enzyme activity was reduced by 90.5% indicating that the active site of the enzyme requires critical metal ions that were chelated by EDTA. This observation indicates that the enzyme is a metalloprotease that requires metal cofactors for activity. The protease activity was decreased by 45% in the presence of β-ME which suggested that the enzyme was denatured by the breakage of at least one disulfide bond necessary for maintaining the active form of the enzyme. DTT and PMSF both induced moderate inhibition, and IAA had a small inhibitory effect.
In the published literature, the synthesis of protease and corresponding enzyme activity have been reported in various strains of Bacillus bacteria under different pH and temperature conditions. Glucose is widely recognized as the preferred carbon source, while yeast extract is considered as the optimal nitrogen source for efficient enzyme production. Most of the isolated strains indicate that the production of enzymes is optimized at a temperature of 50 °C and an alkaline pH level. provides a compilation of several species that are known to produce protease, along with the corresponding optimal conditions for the synthesis of protease [25, 26].
The media’s composition, as well as the growth and fermentation factors given to the bacterial strain, have a significant impact on the expression of proteases. The Bacillus subtilis BSP was also greatly affected by the conditions of pH, temperature, metals, surfactants, and inhibitors that were tested. The results and responses to these factors are correlated with previous studies reviewed by Sharma et al. in 2017 [27]. In their study, they observed an increased level of protease production (2450 U/ml) in Bacillus pseudofirmus AL-89 when 60 g/l glucose was added. Additionally, an increase in glucose concentration resulted in a slight reduction in enzyme production, with the optimum level reported to be a 1% (w/v) concentration in most studies. Various carbon sources such as glucose, lactose, galactose, and starch have also been reported to result in maximum levels of protease production by Bacillus aryabhattai K3 when used as carbon sources in the medium [27]. Different nitrogen sources, such as peptone, tryptone, potassium nitrate, and yeast extract phosphate at a concentration of 1%, have also been found to have an effect on protease production, as reported for the Rheinheimera strain. (NH4)2HPO4 has also been found to be the best nitrogen source for protease production by A.oryzae 637, and ammonium sulfate has been reported to be the best nitrogen source for protease production by Bacillus sp. strain AS-S20-I. The incubation time for protease production varies for each strain [27]. For example, protease production by Bacillus pumilus UN-31-C-42 starts 16 h after incubation, increases gradually, and reaches a maximum at about 28 h. For B. subtilis PE11 and B. licheniformis LBBL-11, maximum growth and enzyme production are observed after 2 days. Bacillus sp. APP1 produces the maximum titre of protease after an incubation period of 2 days. The maximum protease production from B. subtilis, and B. licheniformis is recorded after 72 h. Temperature is a critical parameter that needs to be controlled and varied for maximum cell growth and enzyme production, as it differs widely among different microorganisms [27]. The optimum temperature requirement for alkaline protease production also varies. For example, the optimum temperature for protease production by B. licheniformis, B. coagulans, and B. cereus is reported to be 30 °C, while a lower optimum temperature of 25 °C has been reported for B. circulans, Microbacterium sp., and 28 °C for B. cinerea. A temperature of 37 °C has been reported as the optimal temperature for protease production by a number of Bacillus species such as B. amovivorus, B. proteolyticus CFR3001, B. aquimaris VITP4, and B. subtilis strain Rand. On the other hand, a temperature of 40 °C has been reported to be the best for the production of protease by Bacillus sp. 2–5 and B. licheniformis GUS1. A high optimum temperature of 50 °C has been reported for Bacillus sp. strain APP1 and B. subtilis BS1. Various metal ions and reagents have been reported to influence the activity of proteases. For example, Ca + 2, Mg + 2, and Mn + 2 ions positively regulate the enzyme activity of alkaline protease from B. circulans, Pseudomonas thermaerum GW1, and B. licheniformis MP1. Isopropanol, methanol, and benzene increase the activity of protease from Pseudomonas thermaerum GW1 [27]. This indicates that, several factors, such as the pH of the production medium, ionic strength, temperature, and various surfactants, influence the performance of proteases.
Add Comment