Design and construction of MnCO/Ce6@H-MnO2
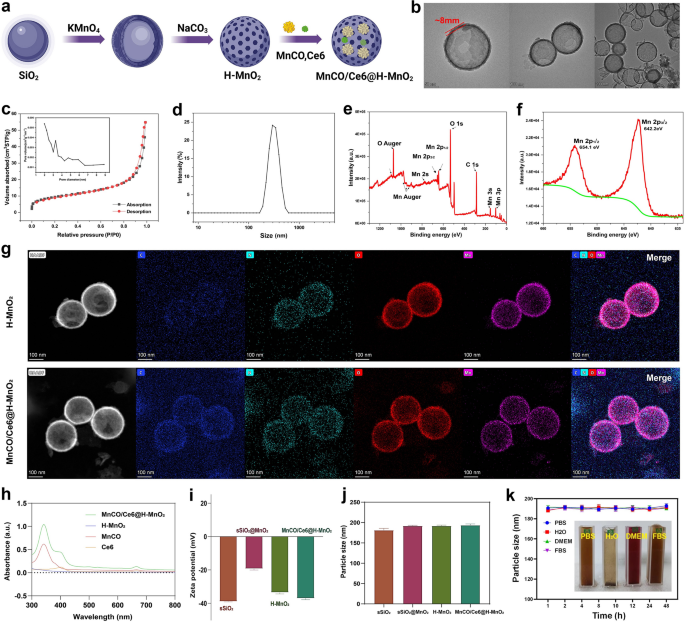
The synthetic process and details of MnCO/Ce6@H-MnO2 nanoparticles are shown in Figs. 1a and 2a, wherein H-MnO2 were firstly obtained according to the classic templating etching method [29], followed by the co-loading of Ce6 and Mn2(CO)10. Monodispersed silica nanoparticles (MSNs) as templates show an average particle size at 180 nm (Figure S1), which determines the size of ultimate H-MnO2. After reaction with potassium permanganate (KMnO4) solution, MnO2 components are intercalated to obtain SiO2@MnO2 with a diameter of 200 nm. Subsequently, the H-MnO2 nanospheres are obtained by removing SiO2 components, and the as-prepared H-MnO2 have a regular spherical morphology whose shell thickness is ~ 8 nm (Fig. 2b). s-SiO2 removal by etching leaves a large number of mesopores with a pore size of 3.2 nm and concurrently imparts H-MnO2 with large surface area (Fig. 2c), providing adequate space for accommodating Ce6 and Mn2(CO)10. The H-MnO2 carriers have the most probable size at 200 nm ~ 300 nm (Fig. 2d). Energy diffraction spectrum (EDS) indicates the atomic ratio of Mn/O at 1:2, denoting the + 4 valence of Mn (Figure S2), and X-ray photoelectron spectroscopy (XPS) test further verifies the valence of Mn atoms (Fig. 2e,f) [4]. The surface Zeta potential varies from s-SiO2 to s-SiO2@MnO2, and further to H-MnO2, indicating the successful synthesis of H-MnO2 carriers.
Characterizations of H-MnO2 and MnCO/Ce6@H-MnO2. a Schematic for understanding the construction steps of H-MnO2 and MnCO/Ce6@H-MnO2. b TEM images of H-MnO2 NPs. c N2 adsorption/desorption isotherms and pore diameter distribution curve (inset) of the H-MnO2 carriers. d Size distribution curve of H-MnO2 nanoparticles in water. e, f Wide-band (e) and narrow-band Mn2p f XPS spectra of H-MnO2 nanoparticles. g High-angle annular dark field (HAADF)- scanning transmission electron microscope (STEM) image and elemental mapping images of H-MnO2 and MnCO/Ce6@H-MnO2. h UV–vis absorption spectra of Ce6, MnCO, H-MnO2 and MnCO/Ce6@H-MnO2. i, j The zeta potential and particle sizes of MnCO/Ce6@H-MnO2 and its intermediates. k Time-dependent particle size variation profiles of MnCO/Ce6@H-MnO2 nanoparticles in several varied media including PBS, H2O, DMEM and FBS. Date are presented as means ± standard deviation (s.d.) (n = 3)
After co-loading Ce6 and Mn2(CO)10, no evident structural and compositional alterations are found, as evidenced by the HAADF and mapping images of compositional elements (Fig. 2g). The characteristic peaks of Ce6 and Mn2(CO)10 at 400 nm and 330 nm in MnCO/Ce6@H-MnO2 unveiling the successful co-entrapment of Mn2(CO)10 and Ce6 (Fig. 2h), respectively. As well, the zeta potential declines after co-loading Mn2(CO)10 and Ce6 (Fig. 2i), while the co-loading fails to alter the colloidal particle size (Fig. 2j), which means that Mn2(CO)10 and Ce6 predominantly reside in hollow cavity and mesopores in shell of H-MnO2 carriers. Significantly, the loading capacities of Ce6 and Mn2(CO)10 can be adjusted based on their feeding ratios to H-MnO2 carriers (Figures S3 and S4), wherein the largest Mn2(CO)10 and Ce6 percentages correspond to 40.5% and 32.6%, respectively. In addition, to determine the drug adsorption time, we observed the drug loading capacity of the nanomaterials after various soaking durations. The results demonstrated that saturation was achieved within approximately 24 h. Consequently, this specific drug loading condition was selected for subsequent experiments (Figure S5).
Intriguingly, such nanoplatforms exhibit high colloidal stability in different media due to no evident alterations in the hydrodynamic size (Fig. 2k). To further demonstrate the material’s stability, we have included numerical images before mixing, after mixing, and after 24 h of mixing (Figure S6).These results indicate that the H-MnO2 featuring porous outer layer is an appropriate vehicle for transporting anticancer therapeutic agents.
Endogenous and exogenous stimuli-triggered ROS production and CO release
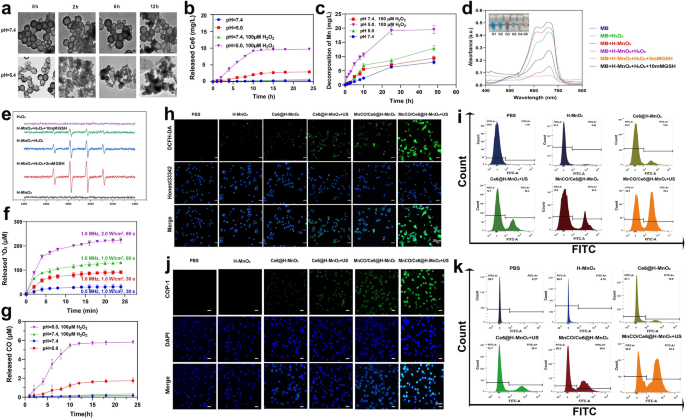
Manganese dioxide (MnO2)-based nanomaterials are known to be unstable and could be dissociated into Mn2+ at low pH, which further reacted with intratumoral H2O2 to give birth to •OH for implementing CDT [31,32,33,34]. To verify it, the structure of H-MnO2 after storage in PBS with varied pH values as a function of time was traced. After 12 h, no evident alterations in structure and morphology suggest the high structural stability of H-MnO2 at pH = 7.4 solution. In contrast, H-MnO2 exhibits a time-correlated degradation manner under acidic conditions (pH = 5.4) because of the dissociation of H-MnO2 into Mn2+, and more fragments are found as the time elapses (Fig. 3a). Quantitative release assays reveal the structural collapse of H-MnO2 in the presence of low pH values and rich H2O2 allows more releases of Mn2+ and Ce6 release since H2O2-abundant acidic tumor microenvironment favors more robust redox reaction (Fig. 3b, c).
Sequential CDT and SDT-mediated ROS production and CO release from MnCO/Ce6@H-MnO2 in vitro. a TEM images of H-MnO2 after incubation in buffer with different pH values (7.4 and 5.4) as a function of time. b In vitro accumulative release percentage of Ce6 from MnCO/Ce6@H-MnO2 at different pH values with varied doses of H2O2. c The release profile of Mn from MnCO/Ce6@H-MnO2 (5 mg/mL). d UV–Vis absorption spectra of MB that underwent different treatments. e ESR spectra of •OH in different reaction systems. f The release of 1O2 at different Ultrasonic condition. g In vitro accumulative burst amount of CO from MnCO/Ce6@H-MnO2 at different pH values with varied doses of H2O2. h Confocal laser scanning microscopic (CLSM) images of Lewis cells after various treatments for monitoring ROS using DCFH-DA as the ROS probe and Honest33342 as nuclear staining dye. i FCM patterns of Lewis cells that experienced staining with DCFH-DA after above various treatments. j CLSM images of Lewis cells after various treatments for monitoring intracellular CO level with COP-1 as the CO fluorescence probe. k FCM patterns of Lewis cells that experienced staining with COP-1 after above various treatments. H-MnO2: 100 μg/mL; US parameters: 1.0 MHz, 1.0 W/cm2, 15 s per time with 4 times for 60 s in total. Date are presented as means ± s.d. (n = 3)
H2O2 and GSH levels are higher in tumors than in normal tissue due to insufficient blood replenishment inside solid tumors [35, 36]. Inspired by it, Fenton-like reaction mediated by Mn2+ is within easy reach. To verify it, the ability of Mn2+ to induce CDT by converting H2O2 into •OH to degrade methylene blue (MB) was assessed. A drastic drop in the characteristic peak of MB is found upon reaction with H2O2 for 30 min, demonstrating •OH production and CDT occurrence that induces MB decolorization. Especially after adding 3 mM glutathione (GSH), more •OH production accounts for the complete color recession and the lowest absorbance of MB since GSH can promote H-MnO2 decomposition into Mn2+ to trigger Fenton-like reaction. However, when the GSH dose is increased to 10 mM, excessive GSH depletes the generated •OH, thereby inhibiting the oxidation of MB by •OH and resulting in the presence of unoxidized MB. (Fig. 3d). Similar results are obtained using electron spin resonance (ESR) technology, wherein the characteristic ESR peak of •OH is significantly enhanced in the group of H-MnO2 + H2O2, and reaches the highest level when adding 3 mM GSH, but decrease in the group of 10 mM GSH because of the excessive GSH-arised ROS exhaustion (Fig. 3e).Subsequently, the Ce6-mediated SDT process was evaluated, and the production of 1O2, a hallmark of SDT, was monitored using the singlet oxygen sensor green (SOSG). Higher ultrasound power density and longer treatment time were applied to enhance the generation of 1O2, demonstrating the occurrence of sonocatalytic process(Fig. 3f). Thanks to the large quality of ROS production, the reaction between ROS and Mn2(CO)10 is encouraged since ROS including 1O2 and OH is equipped with a more potent oxidation ability. Results also show that the acidic and H2O2-rich conditions support the most ROS production to stimulate more CO release from MnCO/Ce6@H-MnO2 (Fig. 3g), successfully switching the partial short-lived ROS to long-lived CO, which will boost the anti-tumor efficiency of ROS-based therapy. In order to mitigate the potential impact of ultrasound on carbon monoxide release, we have incorporated experimental figure S7 as additional evidence to substantiate that ultrasound does not induce Mn2(CO)10 liberation.
In the cellular-level experiments, further monitoring on ROS and CO levels were carried out. A ROS indicator, 2′,7′-Dichlorodihydrofluorescein diacetate (DCFH-DA) was used [37], and the MnCO/Ce6@H-MnO2 + US harvest the strongest ROS signal, suggesting the most ROS accumulation via the CDT and SDT processes (Fig. 3h). Noticeably, Mn2(CO)10 loading provides more Mn source to trigger CDT, resulting more ROS, as evidenced by the comparison between Ce6@H-MnO2 and MnCO/Ce6@H-MnO2. Quantitative results also reflect the variation trend of ROS level via flow cytometry (FCM), wherein ROS-positive cells increase and the treatment with MnCO/Ce6@H-MnO2 + US reaches the highest ROS level (Fig. 3i). Afterwards, a classical carbon monoxide fluorescence probe (COP-1) was adopted to examine the intracellular ROS-catalyzed carbon monoxide production. The fluorescence intensity gradually increases as the ROS level rises, and the MnCO/Ce6@H-MnO2 + US group harvest the highest green fluorescence signal, represented the most CO contents, which can be attributed that the most ROS accumulation stimulated the most decomposition of Mn2(CO)10 into CO (Fig. 3j, S8, S9). Apart from it, FCM analysis was used to further quantitatively examine CO release, and identical results are obtained (Fig. 3k). All these results provide reliable and adequate evidences of resolving the two concerns that ROS-based anti-tumor therapy encounters: maximumly elevating ROS level via the SDT and CDT combined strategy and prolonging the half-life via switching ROS to CO.
In vitro anti-tumor evaluation
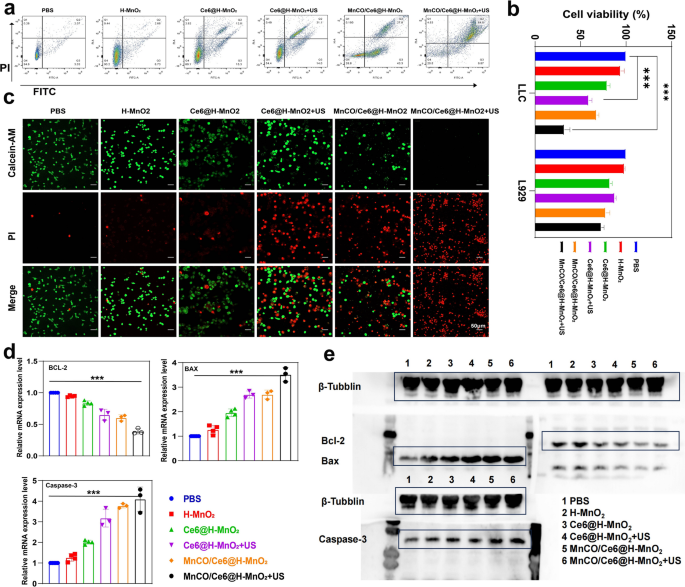
Contributed by the considerably-elevated ROS accumulation and CO release, desirable anti-tumor outcomes can be expected. Prior to assessing it, the in vitro biocompatibility of H-MnO2 carriers was evaluated on normal L929, TC-1 and Lewis cells via the CCK-8 assay. A neglectable cytotoxicity is found on three cells under neutral and acidic conditions even though H-MnO2 dose reaches 300 μg/mL (Figure S10), denoting the excellent biosafety of H-MnO2 nanoplatforms. This phenomenon also suggests the presence of heterogeneity-derived inadequate H2O2 in Lewis cells, resulting in poor CDT process. This point has been validated in ROS assay (Fig. 3h, i) wherein H-MnO2-mediated CDT alone fails to generate sufficient ROS when comparing with Control group.
Depending on the supplementary ROS induced by SDT process, the MnCO/Ce6@H-MnO2 + US group acquires the most ROS accumulation and evokes the highest CO release, thus successfully inducing the most deaths (over 70%) of Lewis cells via FCM analysis (Fig. 4a). Beyond that, CCK8 tests were adopted to further confirm this point. After different treatments, the constructed nanoplatforms exert the strongest killing effect on mouse tumor cells (Lewis cells), but have no influences on normal L929 cells (Fig. 4b). Similar results are further obtained via the calcein AM/PI co-staining tests. A large area of red fluorescence signal illuminates the Lewis cells in MnCO/Ce6@H-MnO2 and Ce6@H-MnO2 + US groups after 24 h of processing (Fig. 4c), representing the dead cells, which was further confirmed by quantitative analysis to cause tumor cell death(Figure S11). In particular, almost all Lewis tumor cells are dead upon treatment with MnCO/Ce6@H-MnO2 + US, but the treatment fails to kill L929 cells (Figure S12a), indicating the excellent safety and treatment precision.Meanwhile, we conducted verification of the mRNA transcription levels and protein expression levels of apoptosis-related genes through RT-qPCR and Western blot, aiming at provide further confirmation of the material’s safety (Figure S12b-d).
In vitro anti-tumor evaluations based on the maximumly-elevated ROS accumulation and long-lived CO release cascade catalysis effects. a FCM data for analyzing annexin V-FITC/PI-stained Lewis cells after undergoing various treatments and evaluating their apoptosis. b Relative viabilities of Lewis and L929 cells after various treatments. c CLSM images of calcein-AM and PI co-stained Lewis cells after different treatments. d Relative mRNA transcription levels of Bcl-2, Bax and Caspase-3 in Lewis cells that underwent varied treatments. e Western blot bands of Bcl-2, Bax and Caspase-3 expression in Lewis cells that underwent varied treatments. Note, H-MnO2: 100 μg/mL; US parameters: 1.0 MHz, 1.0 W/cm2, 15 s per time with 4 times for 60 s in total. Data presented as mean ± s.d. (n = 3). The statistical significance of differences was conducted with a Student’s t-test, and ***P < 0.001
Mechanistic explorations
To understand the killing mechanism, real-time quantitative polymerase chain reaction (RT-qPCR) survey was firstly harnessed to trace mRNA transcription level of some pivotal apoptosis-associated genes. Bcl-2 mRNA expression is down-regulated in all treated groups, and the largest decline magnitude occurs to the MnCO/Ce6@H-MnO2 + US group (Fig. 4d). Meanwhile, MnCO/Ce6@H-MnO2 + US triggers the highest mRNA transcription level of pro-apoptotic genes including Bax and Caspase-3 (Fig. 4d). Western blot (WB) assays further clarifies the apoptotic signaling pathway (Fig. 4e). The treatment of MnCO/Ce6@H-MnO2 + US harvests the most upregulation of Bax and Caspase-3 proteins and coincidently significantly instigates Bcl-2 downregulation, and this result is in accordance with RT-qPCR analysis.
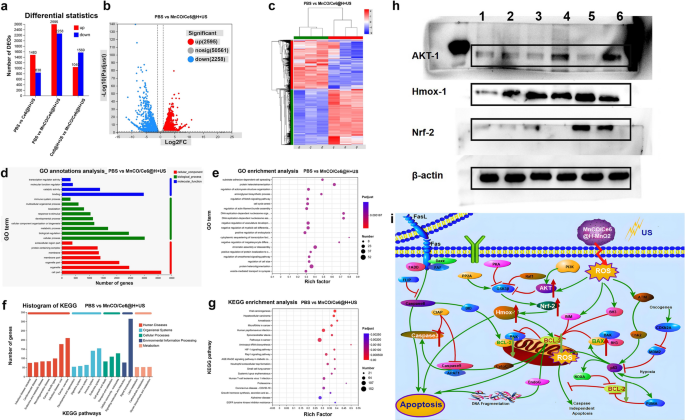
In order to further uncover the signaling pathway, more systematic examinations were carried on, and RNA sequencing and bioinformatics analysis were implemented to explore the possible action mechanisms. A large difference in RNA level expression among the PBS, Ce6@H-MnO2 + US and MnCO/Ce6@H-MnO2 + US groups is found (Fig. 5a), and Fig. 5b, c clearly show the significantly differential gene profiles between the MnCO/Ce6@H-MnO2 + US and PBS groups. The classification and enrichment analysis of differential genes according to Gene Ontology (GO) / Kyoto Encyclopedia of Genes and Genomes (KEGG) show that the expression of mitochondrial function-related genes in experimental group tremendously varies in comparison to that in the control group (Fig. 5d–g). In detail, Akt signaling pathway is activated, and the down-stream targets including AKT-1, Nrf-2 and HMOX-1 are highly expressed after the activated genomic communication. This result reveals that the treatment system may activate the Akt signaling pathway to induce apoptosis. Furthermore, the molecular proteins of Akt signaling pathway, AKT-1, Nrf-2 and HMOX-1, proceeded to be inspected by WB, and they are found to be highly expressed in the MnCO/Ce6@H-MnO2 + US group, which is consistent with the RNA sequencing results (Fig. 5h).
Mechanistic explorations of anti-tumor therapy via RNA sequencing and WB analysis. a Statistical plot of expression differences between 3 groups. b Volcano plot of expression differences between PBS group and MnCO/Ce6@H-MnO2 + US group. c Heatmap of differentially expressed genes. d GO classification statistics map of differential genes. e Results of GO enrichment analysis of differential genes. f KEGG classification statistics map of differential genes. g Results of KEGG enrichment analysis of differential genes. h WB bands of AKT-1, HMoX-1 and NRF-2 proteins in Lewis cells after experiencing varied treatments. i Signaling pathways of such a maximumly-elevated ROS accumulation and long-lived CO release cascade catalysis-unlocked anti-tumor therapy. H-MnO2: 100 μg/mL; US parameters: 1.0 MHz, 1.0 W/cm2, 15 s per time with 4 times for 60 s in total
Collectively, the detailed signaling pathway of such a maximumly-elevated ROS accumulation and long-lived CO release cascade catalysis-unlocked anti-tumor therapy is outlined after taking all above together, as shown in Figs. 1b and 5i. The synthesized MnCO/Ce6@H-MnO2 in an acidic environment can trigger a cascade of reactions that promotes the generation of •OH and 1O2 via enhanced CDT and SDT processes, thereby stimulating long-lived CO release via ROS-based redox reaction with Mn2(CO)10 and remodeling the genomic instability-induced tolerance to ROS therapy. By activating these damaged mitochondria, the released CO and ROS resulted in Akt signaling pathway activation represented by AKT-1, Nrf-2 and HMOX-1, thereby improving the therapeutic efficiency. Probably, there are other potential emerging pathways or cell subtypes that manipulate the CO/ROS anti-tumor process due to the tumor spatial–temporal heterogeneity, which, however, can’t be discerned due to the limitation of common RNA-Seq technology. Fortunately, the unwavering advancements in single-cell analysis technology have provided indispensable support for cutting-edge medical scientific exploration [38, 39], which will reveal more anti-tumor mechanisms of this endogenous and exogeneous stimuli-triggered cascade catalysis method.
In vivo anti-tumor evaluation based on MnCO/Ce6@H-MnO2 nanoplatforms
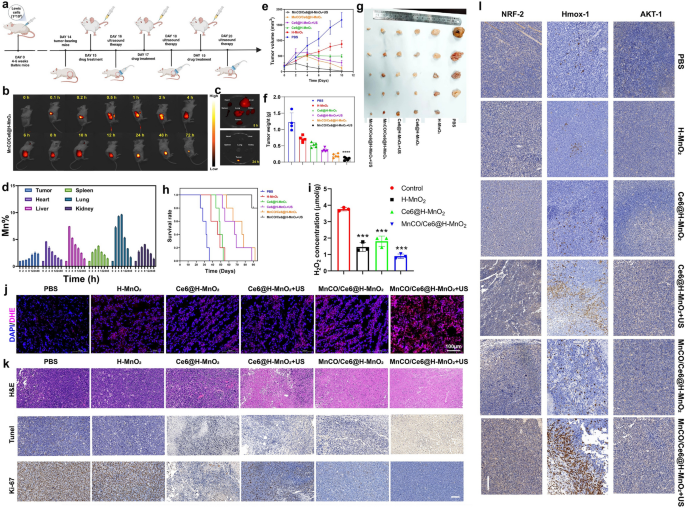
The in vitro cascade catalytic therapeutic consequences based on the engineered MnCO/Ce6@H-MnO2 nanocatalysis encourage the in vivo Lewis lung cancer recession. The detailed experiment protocol is drawn (Fig. 6a), and the common intravenous administering for lung cancer in clinics was used since it outperformed atomization absorption in evading exhalation-arised material loss and pulmonary mucosa and dense blood barriers-inhibited delivery. Firstly, in vivo biodistribution of nanoplatforms was monitored through labeling MnCO/Ce6@H-MnO2 nanoparticles with Cy5.5 since high accumulation of nanoplatforms in tumor is the premise of acquiring excellent treatment outcomes. Results clearly find that although the accumulation level of MnCO/Ce6@H-MnO2 firstly increases and subsequently gradually decreases within 72 h after injection (Fig. 6b), the retention in tumor is still kept at much higher level after 24 h post-injection even though the nanoplatforms in other organs are eliminated (Fig. 6b, c). Correspondingly, semi-quantitative fluorescence image analysis shows that Cy5.5 fluorescence signal is strong after 2 h post-injection at the site of tumor in MnCO/Ce6@H-MnO2 treated mice, and reaches the largest signal at 12 h (Figure S13). We also determined the biodistribution of MnCO/Ce6@H-MnO2 in vivo at various time points post-intravenous injection using ICP-AES analysis. Experimental results reveal that the material accumulates rapidly in normal organs (heart, liver, spleen, lungs, and kidneys) within 2–4 h post-injection, but is subsequently metabolized. After 48 h post-injection, the Mn level in all normal organs returns to that at pre-injection and approaches baseline levels (Fig. 6d and S14). In contrast, there is a gradual increase in material accumulation at tumor sites over time, which peaks at around 24 h and remains relatively a high level until 48 h. These results further underscore the highly-effective delivery and accumulation properties of this material specifically in tumors.
In vivo anticancer therapy evaluation on the combination of the maximumly-elevated ROS accumulation with long-lived CO release cascade catalysis-unlocked anti-tumor therapy. a Schematic representation of anticancer experimental procedures on the animal model. b In vivo time-correlated fluorescence images of Lewis tumor-bearing mice after intravenously administering Cy5.5-MnCO/Ce6@H-MnO2 (2 mg/kg equivalent Cy5.5). c Ex vivo fluorescence images of tumor, heart, liver, spleen, lung and kidney harvested from MnCO/Ce6@H-MnO2-treated mice at 8 h and 24 h, respectively. d Time-dependent Mn levels in tumor and normal organs that were determined by ICP-AES. Error bars indicate standard deviation (n = 3). e Time-correlated tumor volume variation profiles after different treatments. f, g Tumor weights (f) and digital photographs (g) after the end of the experimental period in varied treatment groups. h Surviving curves of Lewis tumors-bearing mice in various treatment groups (n = 5). i H2O2 levels in tumor that experienced different treatments. Error bars indicate standard deviation (n = 3). j CLSM images of DAPI&DHE co-stained tumor slices after different treatments for monitoring ROS level using ROS indicator (i.e., DHE), and scale bar: 100 μm. k Histological and immunohistochemical images of H&E, TUNEL, and Ki67 tests for the isolated tumor sections after different treatments, and Scale bar: 50 μm; l Histological and immunohistochemical analysis of AKT-1, Hmox-1, NRF-2 tests for the isolated tumor sections after different treatments, and Scale bar: 100 μm. H-MnO2 concentration: 5 mg/kg; ultrasound parameters: 1.0 MHz, 1.0 W/cm2, 15 s per time with 8 times for 120 s in total. Data presented as mean ± s.d. (n = 5). The mice in all experimental groups were euthanized and sampled on the 23rd day following injection of tumor cells. Moreover, symbol markers were employed to indicate instances of premature euthanasia resulting from rapid tumor growth, in accordance with principles of animal ethics.The statistical significance of differences was conducted with a Student’s t-test, and ****P < 0.0001
Depending on the high accumulation, a significant shrinkage after treatment is found, and the MnCO/Ce6@H-MnO2 + US group receives the largest tumor inhibition rate (94.3%) (Figs. 6e and S15), which is much higher than MnCO/Ce6@H-MnO2 (77.2%) and Ce6@H-MnO2 + US (55.7%). After sacrifice at the end of experimental period, tumors were collected, photographed and weighed. Tumor weights and corresponding digital photographs of representative mice in each group further demonstrate that the MnCO/Ce6@H-MnO2 + US treatment significantly inhibits tumor progression, resulting in the smallest tumor weight and volume (Fig. 6f, g), with no significant variation in body weight observed (Figure S16). Further, the survival rate of treated mice was recorded, and the MnCO/Ce6@H-MnO2 + US group makes a huge step to prolong the survival time (Fig. 6h), suggesting that the constructed nanotherapeutic system exerts the extremely pivotal effects on lung cancer recurrence inhibition and prognosis improvement in mice. To determine whether the H2O2 concentration is adequate for H-MnO2-induced CDT, the H2O2 levels were traced. It is clearly found that the concentration of H2O2 in tumor is approximately 4 μmol/g, but after treatments with H-MnO2-contained nanoplatforms, the H2O2 level significantly declines (Fig. 6i), suggesting the H2O2 reaction with H-MnO2. This result also validates that the H2O2 level in Lewis lung cancer is sufficient for triggering CDT, which is consistent with previous reports [40, 41]. Subsequently, in vivo ROS inspection was implemented and results reveal that the depleted H2O2 is converted into ROS in H-MnO2 group. More significantly, the SDT/CDT process in MnCO/Ce6@H-MnO2 + US group stimulates the most ROS production, which thus is expected to favor more CO birth via the cascade catalysis process (Fig. 6j).
To figure out the therapeutic rationales, tumor sections were inspected after staining with hematoxylin and eosin (H&E), TUNEL, and Ki-67 histochemical staining after various treatments (Fig. 6k, S17). The most large-area apoptosis/necrosis regions in H&E-stained images, the considerably-enhanced apoptosis in TUNEL-stained images, and the most significantly-suppressed cell expansion in Ki-67 test are obtained in tumors in the MnCO/Ce6@H-MnO2 + US group (Fig. 6k). The image clearly demonstrates that the high expression of the brown area corresponds to a high expression of the associated protein. Furthermore, upon comparing the results of the experimental group with those of MnCO/Ce6@H-MnO2 group and Ce6@H-MnO2 + US group, it is evident that Ki67, a proliferation-related protein, exhibits weak expression in the experimental group while there is a more significant expression of corresponding apoptosis-related proteins, revealing that the sequential treatment can expedite the deaths of cancer cells and oppose the replication of cancer cells. Beyond it, we further stained the tumor sections with AKT-1, HMOX-1 and NRF-2 antibodies to examine their expression (Fig. 6l, S17). Results show that the protein expressions of AKT signaling pathways including AKT-1, HMOX-1 and NRF-2 indicators are remarkably up-regulated, which is consistent with in in vitro WB analysis. It is noteworthy that the upregulation of pathway-related proteins in the experimental group not only significantly differed from that in the control group, but also exhibited distinct differences compared to those in the MnCO/Ce6@H-MnO2 group and Ce6@H-MnO2 + US group.The inspiring results further verify the mechanism feasibility of such a maximumly-elevated ROS accumulation and long-lived CO release cascade catalysis-unlocked anti-tumor therapy, that is, inhibiting the mitochondrial pathway and activating AKT signaling pathway.
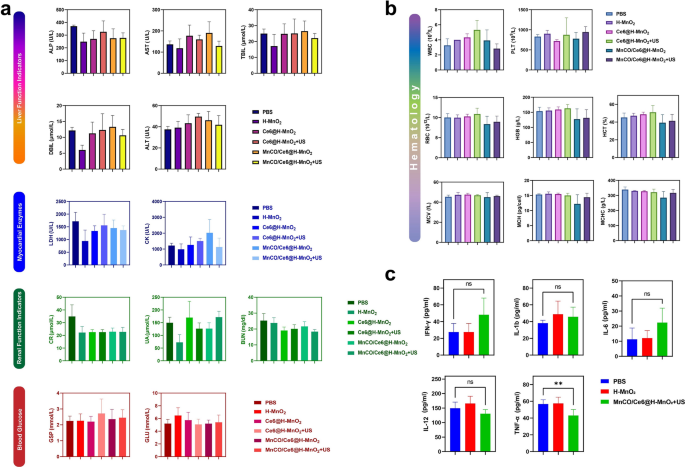
To evaluate the therapeutic safety, we performed H&E staining of heart, liver, spleen, lung and kidney of the injected mice, and results show that there is no evidence of significant organ damage in the MnCO/Ce6@H-MnO2 + US treatment group at the tested dose reflecting the good biocompatibility of MnCO/Ce6@H-MnO2 + US (Figure S18). Meanwhile, blood samples were collected from normal Bala/c mice after intravenous injection of PBS or MnCO/Ce6@H-MnO2 + US for hematological and blood biochemical tests. There is no prominent difference in serum indexes between the MnCO/Ce6@H-MnO2 + US group and the normal mice, further confirming that the safety of MnCO/Ce6@H-MnO2 (Figs. 7a and b). In addition, cytokines in serology were determined by enzyme-linked immunosorbent assay (ELISA) and MnCO/Ce6@H-MnO2 + US is disabled to induce prominent abnormalities in IL-1b, IL-12, IL-6 and IFN-γ levels. Although TNF-α is different between the two groups, the expression level remains within the normal range. These results also prove that MnCO/Ce6@H-MnO2 + US has no significant cytokine secretions (Fig. 7c). The accumulation of manganese in the body may lead to neurotoxicity. To further investigate the metabolism of carrier H-MnO2 in the body, we closely monitored the Mn content in the serum of mice in the treatment group (Figure S19). It was observed that during the administration period, there was a slight fluctuation in Mn content in mouse serum, which increased compared to before administration but still remained within normal range. Around the fourth day after completing treatment, almost complete metabolism of manganese in serum was observed. On day 7 after treatment, we closely monitored serum manganese levels and simultaneously euthanized mice to measure Mn content in their heart, liver, spleen, lungs, and kidneys. The results showed no statistically significant difference between manganese levels in these organs compared to those of normal mice(Figure S20).These biological effects initially prove that MnCO/Ce6@H-MnO2 + US has excellent biocompatibility, excellent biosafety and no obvious toxic side effects since their components have been validated to be safe [42,43,44], holding high potentials in clinical translation.
The criteria for evaluating biosafety in vivo. a Blood biochemistry analysis of balb/c mice that experiencing various treatment options. ALP: alkaline phosphatase; AST: aspartate aminotransferase; TBIL: total bilirubin; DBIL: direct bilirubin; ALT: alanine aminotransferase; LDH: lactic dehydrogenase; CK: creatine kinase; CR: blood creatinine; UA: uric acid; BUN: urea nitrogen; GSP: glycosylated serum protein; GLU: glucose. b Hematology data of balb/c mice that experiencing various treatment options. WBC: white bold cell; PLT: platelet; RBC: red blood cell; HGB: hemoglobin; HCT: hematocrit; MCV: mead corpuscular volume; MCH: mead corpuscular hemoglobin concentration; MCHC: mean corpuscular hemoglobin concentration. c Serum levels of some typical cytokines in balb/c mice treated with PBS, H-MnO2 as well as MnCO/Ce6@H-MnO2 + US nanoparticles


Add Comment