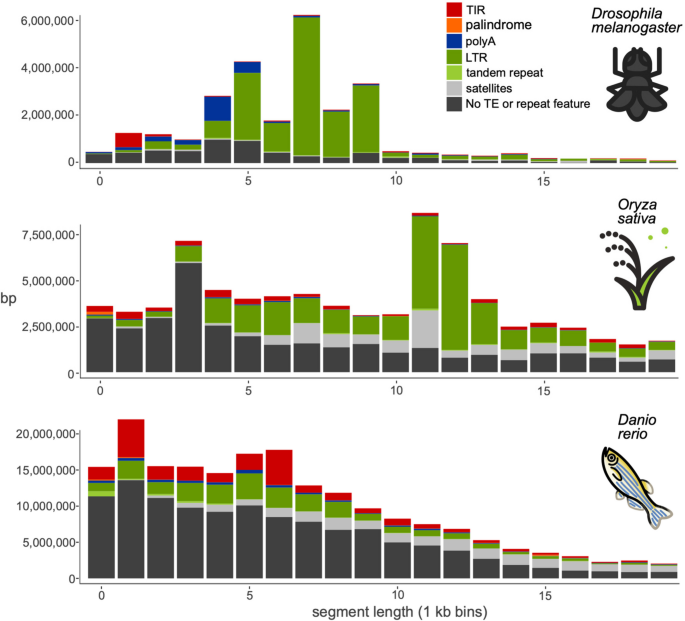
First, we benchmarked the new tool with three species for which there exist manually curated TE libraries: Drosophila melanogaster (fruit fly), Oryza sativa (rice), Danio rerio (zebrafish). Figure 2 shows the distribution of insertion polymorphisms in the size range 250 bp to 20 kb in the pangenomes we used for these species, with the fraction of those polymorphisms exhibiting the various TE features classified by pantercheck. For each of the species we compared the results of pantera to those of a reference library and those obtained with a denovo method, RepeatModeler for Drosophila melanogaster and Danio rerio and REPET for Oryza sativa.
Structural feature found in polymorphic segments of three pangenomes, by segment length (250—20,000 bases). Total number of base pairs in insertions on a pangenome in different size ranges, grouped by structural features associated with TEs or other repeats. TIR: terminal inverted repeats. Palindrome: TIRs that occupy more than 90% of the sequence. polyA: A/T homopolymer at least 10 bases long, allowing for 1 mismatch every 8 bases. Tandem repeat: The sequence is composed of a smaller sequence repeated 2 or 3 times. Satellites: The sequence is composed of a motif repeated more than 3 times
Drosophila melanogaster
We used seven genomes A1 to A7 of Drosophila melanogaster from the DrosOmics project [6] (Fig. 1a) and built a pangenome composed of one connected graph for each of the five main Muller elements (chromosome arms 2L, 2R, 3L, 3R and X). This produced 5 GFA files between 100 and 144 MB of size composed of a total of 5,564,238 segments. Running pantera on them resulted in a library of 141 elements that we classified using RepeatClassifier 2.0.4 [9] (Fig. 1c). Next we ran RepeatModeler 2.0.4 [9] with default parameters on one of the genomes (A1) and compared the results (N = 361) with pantera and the reference library, Drosophila transposon canonical sequences (v10.2), obtained from https://github.com/bergmanlab/drosophila-transposons.
Oryza sativa
For rice we constructed the pangenome from two genome sequences: the reference genome GCF_001433935.1 from the Japonica group [18] and an Indica group genome GCA_001623345.3 [44]. The final graph was composed of 7,801,181 segments. The resulting library obtained with pantera had 525 elements of which 267 (51%) are classified by RepeatClassifier as Unknown. We compared this library to the manually curated TE annotation in Rice (v6.9.5) [33], with 2,431 elements. In this case we compared the results of pantera to the uncurated library obtained with REPET [8, 34, 35] downloaded directly from REPETDB [1] composed of 2,479 families.
Danio rerio
For zebrafish we used the reference genome danRer11 (GCF_000002035.6) [16] and compared it to fDanRer4.1 (GCA_944039275.1), one of the recent assemblies generated by the Wellcome Sanger Institute Tree of Life programme. The final graph was composed of 32,943,885 segments. The library obtained from it using pantera returned 913 putative TE families with 29 (3%) of them being classified as unknown. We compared it to the 1,740 curated TE families included in Dfam [40], and to the results obtained with RepeatModeler2 (3,728 families).
Benchmark results
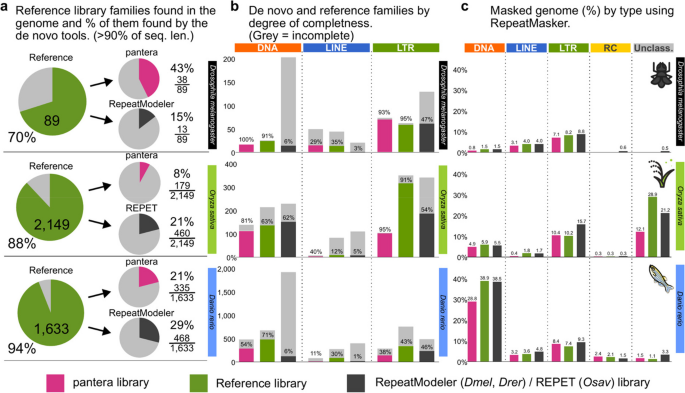
To compare the results we looked at different values (Fig. 3): a) how many sequences from the reference library had at least 90% of their sequence matched by a sequence of the other tools; b) what fraction of the sequences obtained for each type were complete; c) the total percentage of the genome masked by the resulting libraries.
Comparing different TE libraries in Drosophila melanogaster, Oryza sativa and Danio rerio. a Number of families from the reference library with matches in the specific target genome (A1 for Drosophila, the standard reference for rice and zebrafish), and how many of them have a match with the Pantera or alternate automated library covering > 90% identity and length in the selected genome. Note that not all reference library families were found in the specific genome used (some are only found in other genomes from the species). b Degree of TE completeness as percentages of the total number of segments for each tool, type and species. The definition of “complete” is given in Methods subsection “Assessment of completeness”. c Percentage of the genome masked by RepeatMasker using each of the libraries by type of TE family
Pantera found more near-full length (> 90%) members of the reference libraries than RepeatModeler (fruit fly and zebrafish) or REPET (rice) except for LTR elements for rice and zebrafish. In rice this was primarily due to different criteria on divergence while defining a family, as was confirmed by the similar percentage of genome masked in both cases (pantera 10.4%, reference 10.2%). In the case of zebrafish both pantera and RepeatModeler libraries have an excess of incomplete elements, probably due to the relatively low copy number of full length LTR elements.
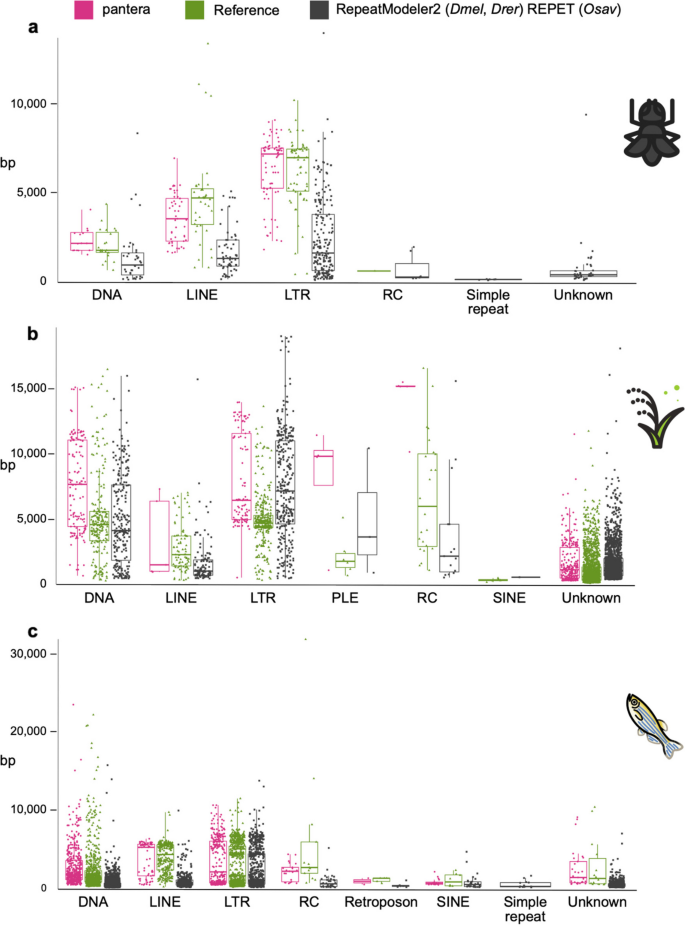
In general pantera families are more complete as defined in the previous section, even than the reference library families (Fig. 3b), with the exceptions being DNA and LTR elements for zebrafish. Length distributions of all families generated can be compared in Fig. 4 and Supplementary Fig. 2. We interpret the typically longer mean size and lower variance of the distributions of lengths by superfamilies for pantera as further evidence that the consensus sequences it produces tend to belong to full elements. As an example, of 48 CMC-EnSpm families identified by pantera, only 5 lack the expected TIR elements, compared to 29 families missing the TIR element out of 70 in the REPET results. This is even true for LINE elements, for which it is particularly hard to produce a full length consensus because most copies are incomplete. Another point to take into account is that the results can also be biased by the cut point selected to define the minimum size of an element to be included in the library. Mobile elements associated with TE activity usually start over the 100 bases mark, with SINEs or solo LTRs. If instead we want to focus on autonomous TEs, in our experience a minimum size of 700 to 800 bases is low enough. As pantera uses the information from several genomes, it is possible that a family found in the pangenome is not actually present in one of the genomes. This happens for example with the full Q-element, LINE/CR1, in fruit fly, that can be found in the curated and pantera libraries, but not present in the genome (A1) used by RepeatModeler and as template for the results.
Length distributions of the different libraries by TE order. Length distributions of the consensus sequences by order in which they have been classified. RC stands for rolling circle (Helitrons). a Drosophila melanogaster. pantera (N = 141), Drosophila Transposon Canonical Sequences 10.2 (N = 127), RepeatModeler (N = 361). b Oryza sativa. pantera (N = 525), rice6.9.5 (N = 2431), REPET (N = 2471) c Danio rerio. pantera (N = 913), Dfam curated (N = 1740), RepeatModeler (N = 3728)
The results of masking the genomes with the libraries generally show a comparable though slightly lower coverage percentage by pantera (Fig. 3c). This is expected as pantera will not build consensus sequences from very old and fragmented TE insertions, that can represent a sizable percentage of the genome, and instead will identify more recent elements, which are closer to the putative active sequence of the TE, but which may have fewer copies in the genome. As an example, in Danio rerio pantera identified one large CMC-EnSpm element that has three full copies in the genome. It shows the two full proteins associated with these elements, and has a 13 basepair TIR (CACTCAAAAAAAT) (Supplementary Fig. 3). This and other large CMC (CACTA) elements were not reported by RepeatModeler. The same happened with other large DNA elements classified as Zisupton (Supplementary Fig. 4).
RepeatMasker landscape plots for all libraries are shown in Supplementary Figures 5,6 and 7. Differences between methods are observed due to different clustering approaches. In general pantera provides greater resolution at low Kimura divergences, presumably due to its tight initial clustering step.
We compared the time employed by all workflows (Supplementary Fig. 8) except for the REPET library for rice for which we used a library previously generated. For the pantera workflow we added the time employed by the creation of the pangenome (pggb) extraction of the library (pantera) and the classification of the sequences (RepeatClassifier). The results for RepeatModeler include also the time employed by RepeatClassifier. With Drosophila melanogaster pantera was 3.5 × times faster than RepeatModeler, even though the pangenome was composed of 7 genomes. In the case of Danio rerio the pantera workflow was 6 × times faster than RepeatModeler. It is worth noting that by default RepeatModeler limits the genome sampled to 400 MB. This limit can be increased to sample the full genome and avoid missing low copy elements, but that comes at a larger cost in execution time. The results presented used the default configuration.
Results using both haplotypes of the same sample: Trachurus
trachurus and Aquila chrysaetos
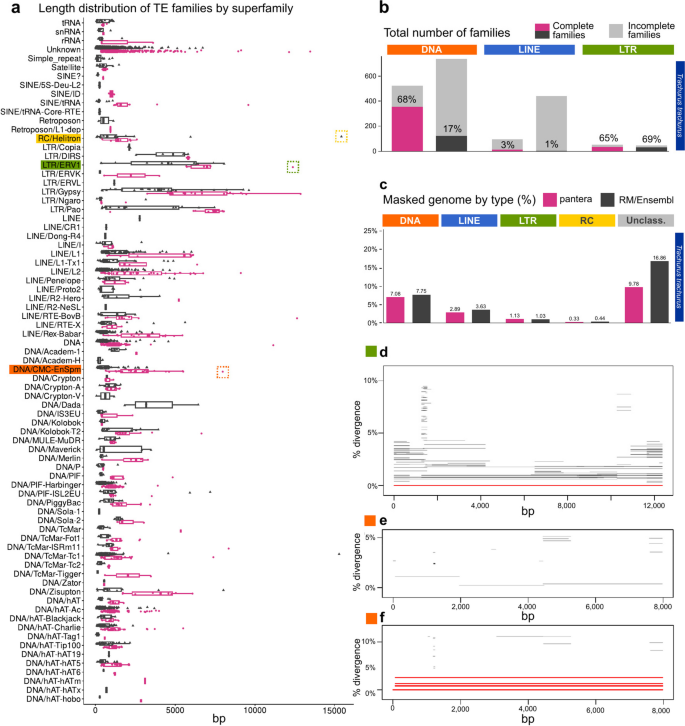
As an example of the application of pantera to a newly sequenced species without a reference we selected two species from the Sanger Institute, the Atlantic horse mackerel Trachurus trachurus and the golden eagle Aquila chrysaetos. For T. trachurus we used its primary (GCA_905171665) and alternate (GCA_905171655) haplotype assemblies [12] to extract a new TE library for the species using the pantera pipeline (1301 families). Then we compared the results with the Ensembl annotation for the species, obtained with RepeatModeler, without further manual curation (3718 families) (Fig. 5). The results of masking the genome with both libraries are similar, but in the case of pantera more than double the elements in all three main divisions (DNA, LINE, LTR) appear to represent the full sequence of the TE. Of the DNA TEs found by RepeatModeler 29% had a more complete element in pantera. For LTRs the corresponding figure was 44%, but it was smaller for LINE elements, just 8%. As an example of a novel full length element, pantera identified a new ERV element, 12,371 bases long, with 707 bp LTRs and two ORFs of 1,402 and 1,032 amino acids (green box in Fig. 5a). There is just one full copy in the main haplotype and this is a case in which pantera can benefit from using the information present in both haplotypes (Fig. 5d). Furthermore, the largest family of CMC-EnSpm elements found in the genome has no full copies in the primary haplotype but is only present in the alternate haplotype with six full copies (Fig. 5e,f). In both of them we could observe the orfs encoding the full proteins characteristic of these families.
Results with Trachurus trachurus, from a pangenome composed from the primary and alternate assemblies from the same sample. a Length distributions of the consensus sequences by superfamily in which they have been classified. pantera (N = 1301), RepeatModeler (N = 3718). Highlighted in dotted boxes are a Helitron element not found by pantera (yellow), and an ERV1 (green) and a CMC-EnSpm (orange) element not found by RepeatModeler. b Total number of families of the resulting libraries, and their degree of completeness as in Fig. 2. c Percentage of the genome masked by RepeatMasker using each of the libraries. d Only one full length copy of the ERV1 boxed in green in (a) is present in the primary assembly. e, No full length copies of the CACTA element highlighted in orange in (a) are present in the primary assembly, while (f) six are present in the alternate assembly. d, e and f were generated with TE-aid (https://github.com/clemgoub/TE-Aid). [13]
We repeated the same procedure with the primary haplotype (GCA_900496995.4) and alternate (GCA_902153765.2) of the golden eagle [29]. In this case pantera did not find any of the DNA type content found by RepeatModeler, as that appears to be due to old insertions which are no longer polymorphic. Instead, it was able to correctly find several large ERVs that are still polymorphic and might be relatively recent insertions, which were missed by RepeatModeler. In particular one of them includes an extra protein in addition to the putative ERV proteins that we found to be present also in the genomes of other Accipitriformes but not in more divergent species, which suggests that it could be an ERV specific to this order (Supplementary Fig. 9).
Results comparing closely related species: Astatotilapia calliptera and Maylandia zebra
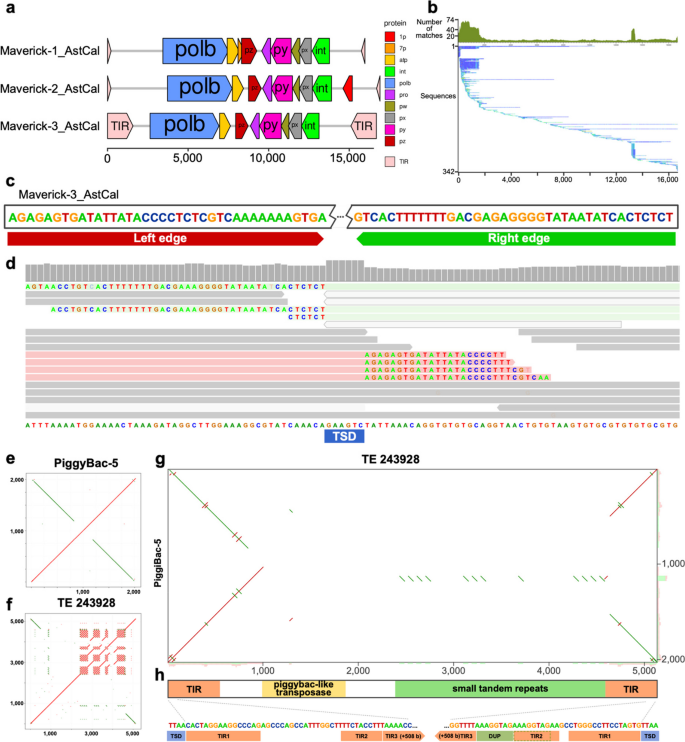
The polymorphism-first approach can also be applied to comparisons between genomes of closely related species, and we have found that in some cases this allows us to have a better understanding of their TE content. As an example, we created a pangenome from the genomes of two closely related cichlid fishes from Lake Malawi, Astatotilapia calliptera (GCA_900246225.5) and Maylandia zebra (GCA_000238955.5) that diverged within the last million years [26], and used pantera to generate 250 candidate TE families. In the resulting library we found three different complete families of Maverick elements for which previously only fragmented components had been reported. One of them, Maverick-3_AstCal, has just one full copy in the Astatotilapia calliptera reference genome (Fig. 6a,b), but a search for polymorphic insertions in more than 600 samples with short read data using MeGANE [20] confirmed that all of them have tens of polymorphic insertions of that family, highlighting the relevance of having the most complete possible consensus sequence to perform further downstream analysis accurately (Fig. 6c,d). Pantera also found a previously identified element, named piggybac-5, formed by the fusion of two segments of the same piggybac-like element in opposite senses (Fig. 6e,f,g). This has lost the transposase, but the intact TIRs suggest it is still being mobilized as a nonautonomous element, and indeed there are 51 full length copies in the Astatotilapia calliptera reference genome. Pantera also obtained a consensus for an intact piggybac TE (TE-243928) (Fig. 6f) which has only six full copies in the Astatotilapia calliptera genome, each containing a complete piggybac transposase of 256 aa. The target site duplications of TE-243928 and piggybac-5 are identical, and the terminal region of the TIR of piggybac-5 is the same as the TIR of TE-243928, but the piggybac-5 TIR is substantially extended internally by material which is only found in single copy in TE-243928 (Fig. 6h). We suggest that piggybac-5 may have been formed by overlapping chromosomal inversion events from TE-243928 or a closely related element.
Selected TE families found in Astatotilapia calliptera. a Structure elements identified in three Maverick families found with pantera in a pangenome built with Astatotilapia calliptera and Maylandia zebra. All families include TIR elements, and separate ORF components for DNA polymerase b, integrase, ATPase and a double jelly roll capsid protein (py) among others. b Seed Alignment Coverage and Whisker Plot for Maverick-3_AstCal from Dfam (https://www.dfam.org/family/DF003572096/seed). The small number of matches all along its sequence can make it very hard to find based only on repetitiveness, but the presence of full elements in the Maylandia zebra genome allowed us to obtain the full sequence. c Detail of the edge sequences for both TIR elements. d The accurate definition of the edges of the TE element allows us later to use other tools like MeGANE to identify polymorphic insertions using short reads, bases on mapping of discordant reads to the TE sequence but also matching the soft clip reads of on the insertion to the edges of the putative TE element. In this case we observe the signal for an heterozygous polymorphic insertion, which has created an 8 bases target segment duplication (TSD). e Structure of a new TE composed of the fusion of two identical piggybac elements in opposite sense. f Hits in the genome. The black divergent lines show matches to previous insertions of the single piggybac element. The red complete ones prove that the new element is creating new copies. g Self dotplot showing the structure of the element. f and g generated with TE-aid (https://github.com/clemgoub/TE-Aid)



Add Comment