Sequencing statistics
To characterize the genetic and epigenetic variances among the subtypes of CPT, we analyzed 20 CPT patients using WGS, WTS, and Methyl-seq. We produced 31 WGS, 20 WTS, and 20 Methyl-seq data, with average read depths of 43X, 53X, and 131X, respectively. The percentage of sequenced reads mapped to the target region was 99.9%, 97.4%, and 75.6%, respectively for WGS, WTS, and Methyl-seq (Supplementary Table 1).
Point mutations of TP53 and EPHA7 are unique and mutually exclusive in CPC
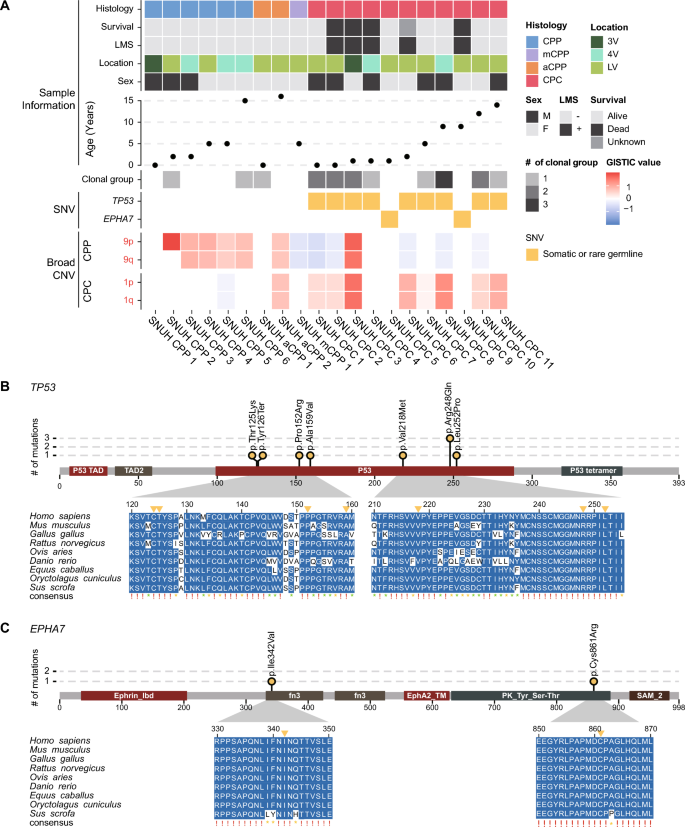
To identify the genetic variations responsible for CPT, we analyzed point mutations in the WGS data. Notably, rare TP53 and EPHA7 variants were discovered only in CPCs (Fig. 1a, Supplementary Table 2). Somatic or rare germline TP53 mutations occurred in 9 (81.9%) of 11 CPC patients; of these, eight were missense mutations and one was a nonsense mutation. Among them, one TP53 variant was a somatic mutation that was not detected in the matched blood sample, and the others were rare germline mutations with allele frequencies of less than 0.001 in healthy populations such as Korea1K [20], gnomAD [22], and 1000 Genomes Project [14]. Notably, all these variants were located in the p53 DNA binding domain. Six patients (including one patient with somatic mutation) had variants that were already reported as pathogenic or likely-pathogenic (c.743G > A, c.374C > A, c.652G > A, c.742C > T, and c.476C > T) [11, 25, 29]. Among them, one patient (CPC-1) was diagnosed with LFS with a multiple family history of cancer. Another patient (CPC-2) had a grandmother with breast cancer. Although no family history of cancer was revealed in the medical records of the other four patients, many of these cases might correspond to LFS or Li-Fraumeni-like syndrome. Previous studies have reported a significant association between TP53 mutations and the development of CPT, particularly CPC [36, 52, 57, 63]. In line with previous studies, TP53 mutations were observed only in CPC patients in our data. To predict the functional importance of each variant, we performed multiple sequence alignment (MSA). All seven variants occurred at highly conserved positions (Fig. 1b).
An overview of sample information and genetic events from WGS data. a Summary of sample information and genetic events of 20 CPT patients. b, c Multiple sequence alignment diagrams of regions where point mutations occurred within TP53 (b) and EPHA7 (c), respectively, in several vertebrate species. A red exclamation mark indicates a perfect match across all species examined. A yellow asterisk indicates an 80% or better match across species, but not a perfect match. A green asterisk indicates more than 50% and less than 80% match across species
Interestingly, CPC patients without TP53 mutations harbor rare EPHA7 mutations. EPHA7 has been identified as a tumor suppressor in various tumors including lymphoma, melanoma, tongue squamous cell carcinoma, and prostate cancer [17, 27, 30, 40, 54]. The two variants identified in this study have not been reported previously. Of the two patients with EPHA7 mutations, one patient was a long-term survivor, but the other had LMS at the time of diagnosis and died due to rapid progression of the disease. To predict the potential impact associated with the mutations in EPHA7, we also performed MSA using the EPHA7 sequences of several vertebrate species. The sites of the variants in EPHA7 were highly conserved, implying that the identified mutations in EPHA7 may impair its function (Fig. 1c).
Large-scale SCNA reveals distinct differences between CPP and CPC
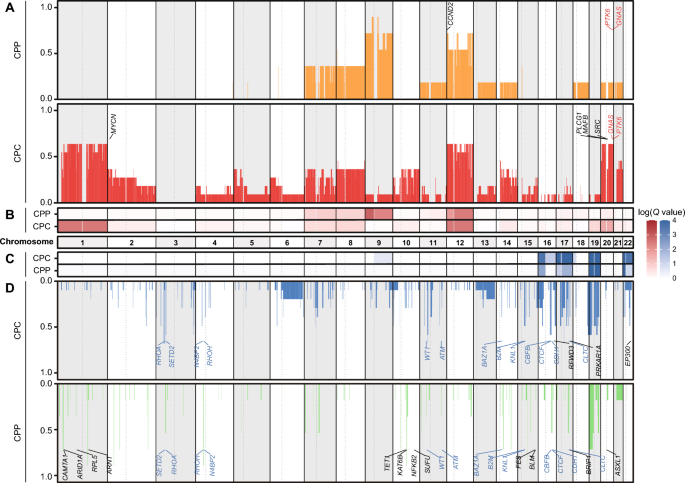
To identify SCNAs in CPT, we analyzed the WGS data of CPT patients. Whole chromosome 12 gain was commonly observed in all subtypes. Whole chromosome 9 gain was repeatedly observed almost exclusively in CPP with 66.7% (4/6) of CPP samples and one CPC sample showing only chromosome 9p gain (Fig. 2a, b). Conversely, whole chromosome 1 gain was detected exclusively in CPC, with 72.7% (8/11) of CPC samples, but not in CPP. The observed whole chromosome 12 gain in CPC is concordant with previous research reporting that more than 70% of CPT patients had chromosome 12 gain [45, 56]. CPP-specific chromosome 9 gain and CPC-specific chromosome 1 gain were also confirmed in previous reports [45, 46, 56]. In addition, losses of chromosomes 16p, 17q, 19, and 22p were commonly found in CPP and CPC. There was no CPP-specific arm-level loss event. Chromosomes 17p, and 22q loss were detected specifically in CPC (Fig. 2c and Supplementary Fig. 1A, B).
There were 6 gains and 28 losses of focal SCNA cytobands commonly detected in both CPP and CPC samples (Supplementary Fig. 1C), which led to amplification of 2 known oncogenes (GNAS and PTK6) and deletion of 13 known tumor suppressor genes (ATM, B2M, BAZ1A, CBFB, CDH1, CLTC, CTCF, KNL1, N4BP2, RHOA, RHOH, SETD2, and WT1). In addition, 15 gains and 43 losses of focal SCNA cytobands were detected uniquely in CPP samples, including 1 oncogene amplification (CCND2) and 12 tumor suppressor gene deletions (ARID1A, ARNT, ASXL1, BLM, BRIP1, CAMTA1, FES, KAT6B, NFKB2, RPL5, SUFU, and TET1). On the other hand, 15 gains and 12 losses of focal SCNA cytobands were specifically detected in CPC, including four specific oncogene amplifications (MAFB, MYCN, PLCG1, and SRC) and three tumor suppressor gene deletions (EP300, PRKAR1A, and RFWD3) (Fig. 2a, d, Supplementary Table 3).
CPC has higher intratumoral heterogeneity than CPP
To characterize the genetic clonal structure of CPT subtypes, clonality was predicted for 11 samples with matched blood normal samples based on somatic point mutations and SCNAs profiles. All CPP (n = 2) and aCPP (n = 1) patients were predicted to have one clone, but 62.5% (5 out of 8) of CPC patients (n = 8) were predicted to have two or more clones, with an average of 1.75 clusters (Fig. 1a). Moreover, there was a significant difference in the number of clones between CPP/aCPP and CPC (p = 0.019, Supplementary Fig. 2), suggesting more vigorous tumor evolution in CPC than CPP.
Cell cycle- and epithelial-mesenchymal transition-related genes are overexpressed in CPC
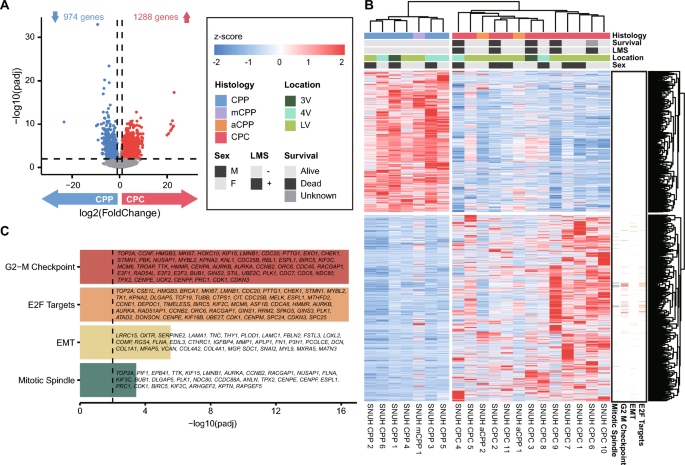
To identify genes with different expression levels in CPP and CPC, we performed DEG analysis based on expression data, excluding aCPP and mCPP. There were 2,262 genes that showed a significant difference (adjusted P value < 0.01, absolute log2 (fold change) > 1) in expression levels between the histological subtypes, of which 1,288 genes were upregulated, and 974 genes were downregulated in CPC (Fig. 3a). We performed a hierarchical clustering analysis based on the expression of these DEGs and confirmed the clustering according to the CPP and CPC subtypes (Fig. 3b). The gene expression profiles of aCPP and mCPP were intermediate between those of CPP and CPC. The expression pattern of aCPP resembled that of the CPCs, while that of mCPP was more similar to that of the CPPs.
Expression profile of DEGs between the subtypes of CPT. a Volcano plot showing genes that are significantly up- and downregulated between CPP and CPC. b Heatmap of DEGs between CPP and CPC. Hierarchical clustering was performed by gene (column) and sample (row) according to expression pattern. The top of the figure is colored according to the pathway to which the gene belongs. c Enrichment test of significant DEGs and their associated pathways
Additionally, we performed clustering analysis of the DEGs above using the PCA method, and the resulting clusters showed distinct expression profiles by histological subtype (Supplementary Fig. 3A).
Enrichment analysis of the lists of genes upregulated and downregulated between the two histological subtypes was performed. The gene sets significantly upregulated in CPC were associated with the ‘G2-M Checkpoint’, ‘E2F Targets’, ‘Epithelial-Mesenchymal Transition’ and ‘Mitotic Spindle’ pathways (Fig. 3c). The pathway analysis results identified characteristics associated with cell division and migration, indicating the malignant features of CPC. In contrast, the gene set downregulated in CPC was not meaningfully enriched in any pathways.
There were 141 genes that were included in both the significant SCNAs and the DEGs of CPP and CPC. The enrichment analysis of these genes revealed that the ‘G2-M Checkpoint’ pathway was the most significant. Of the 13 genes in this pathway, 10 of them, including CDC20, were located on chromosome 1 (Supplementary Table 4). To confirm the expression levels of CDC20 in CPP and CPC, we performed RT-qPCR. The expression level of CDC20 was significantly higher in the CPC tissue samples than in the CPP samples. Primary cultured cells could not be tested for statistical significance because the number of samples for CPP is less than 3, but there still seems to be a notable difference in the expression levels (Supplementary Fig. 3B). In a previous study, RAD54L, TAF12, and NFYC, which are co-located on human chromosome 1p, were shown to be involved in the initiation and proliferation of CPC [57]. However, in our data RAD54L was the only one of these three genes to satisfy the threshold for classification as a DEG (Supplementary Fig. 3C, Supplementary Table 5).
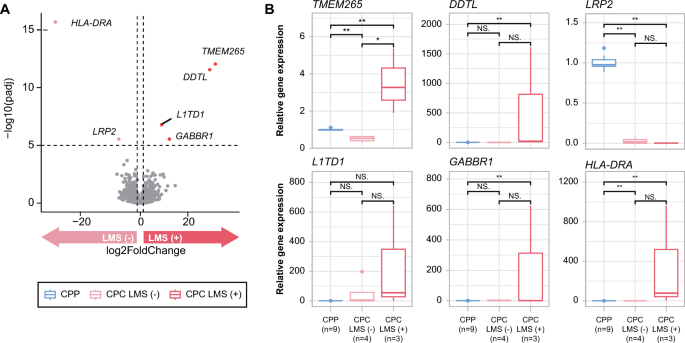
All CPC patients with LMS died, whereas CPC patients without LMS remain alive. LMS was therefore the defining factor in determining the survival outcome of CPC. For this reason, we also performed DEG analysis of CPC patients based on LMS status. Six genes (HLA-DRA, TMEM265, DDTL, L1TD1, GABBR1, and LRP2) showed significantly different expression levels depending on LMS status (-log10 (padj) > 5, Fig. 4A). HLA-DRA and LRP2 were downregulated in the group with LMS, while TMEM265, DDTL, L1TD1, and GABBR1 were upregulated in the group with LMS (Supplementary Table 6). In particular, L1TD1 and GABBR1 have been previously associated with tumor metastasis and progression in other cancers. L1TD1 is highly expressed in seminoma, embryonal carcinoma, and medulloblastoma cancer cells, and its upregulation is associated with poor clinical outcome and metastasis of medulloblastoma. L1TD1 knockdown results in downregulation of pluripotency factors and reduced proliferation, as well as decreased migration and invasion capacity of medulloblastoma cells [39, 47]. There is accumulating evidence implicating GABBR1 in the cancer cell growth and metastasis of high-grade chondrosarcoma, breast cancer, and renal cell carcinoma [18, 21, 59]. Furthermore, previous methylation analysis studies of CPT have demonstrated that GABA receptor signaling is the most enriched pathway in CPC [43]. We further validated the differential expression of those genes in tissues through RT-qPCR. Among the six genes, five genes (LRP2, TMEM265, DDTL, L1TD1, and GABBR1) showed concordant expression patterns, and TMEM265 showed a statistically significant difference in its expression levels (Fig. 4b).
Expression profile of DEGs between LMS (−) and LMS (+) CPC. a Volcano plot showing genes that are significantly up- and downregulated depending on LMS status in CPC. b PCR validation of DEGs that are significantly up- and downregulated between LMS (−) and LMS (+) CPC. Significant differences between groups are indicated by asterisks. *P < 0.05, **P < 0.01, ***P < 0.001 as calculated by the Wilcoxon rank-sum test
CPC and CPP show differential methylation patterns in repeat regions
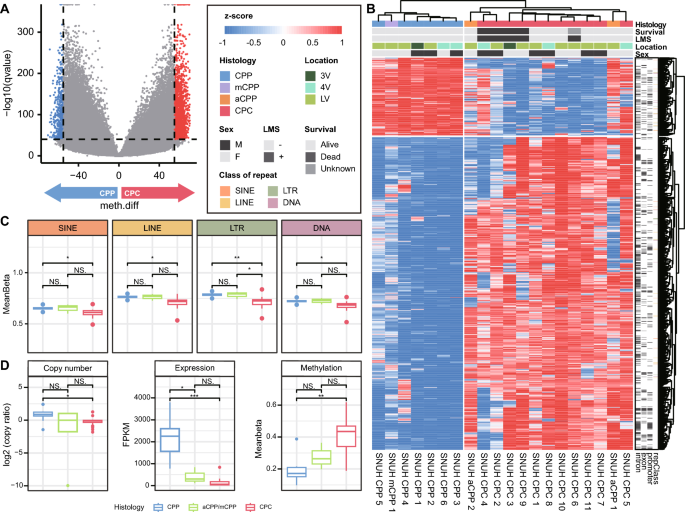
To identify distinct methylation patterns in CPP and CPC, we performed a DMS analysis. There were 2,139 significantly different CpG sites (-log Q value > 40, absolute differential methylation value > 55), including 1,709 hypermethylation and 430 hypomethylation sites. When clustering was performed with CpG sites with significant methylation differences, two clusters formed, one for each CPT subtype (Fig. 5a, b). In addition, aCPPs were clustered with CPCs, but mCPP was grouped with CPPs. In PCA with the corresponding sites, samples of the same subtype of CPT clustered closely together (Supplementary Fig. 4A).
Methylation profile of DMSs between CPT subtypes. a Volcano plot showing sites that are significantly hyper- and hypomethylated sites between CPP and CPC. b Heatmap of DMSs between CPP and CPC. Hierarchical clustering is performed by CpG site (column) and sample (row) according to the methylation pattern. The top of the figure indicates the genomic regions in which each site is located. c Boxplot of the degree of methylation in four types of repeat regions, grouped by CPT subtype. Significant differences between groups are indicated by asterisks.: *P < 0.05, **P < 0.01 as calculated by t test. d Copy number ratio, expression, and methylation of AK1 in different CPT subtypes. Significant differences between groups are indicated by asterisks.: *P < 0.05, **P < 0.01, ***P < 0.001 as calculated by the Wilcoxon rank-sum test
We examined differences in methylation according to genomic region, including protein-coding regions, cis-regulatory elements, and repeat regions. There was no significant difference in the degree of methylation in the genomic regions except for the repeat regions (Supplementary Fig. 4B). Interestingly, the degree of methylation in major repeat regions such as long interspersed nuclear elements (LINEs), short interspersed nuclear elements (SINEs), long terminal repeats (LTRs), and DNA transposon regions was significantly lower in CPC than in CPP (Fig. 5c).
In the promoter region, we identified 746 hypermethylation sites involving 112 genes and 332 hypomethylation sites involving 83 genes. Notably, we found that the promoter regions of p53-related genes were hypermethylated, while those related to angiogenesis were hypomethylated in CPC. There were only significantly enriched pathways in each methylation status. Specifically, AK1, KIF13B, PLXNB2, and RALGDS were found to be involved in the ‘p53 pathway’, whereas PDGFA and OLR1 were involved in ‘angiogenesis’. These results suggest the tumorigenic characteristics of CPC. (Supplementary Fig. 4C).
The differential expression of AK1 driven by genomic and epigenomic factors in CPP
To identify the genes whose expression was affected by methylation, we compared the gene lists from the DMS analysis and the DEG analysis. As a result, we discovered four overlapping genes (FABP3, PDE6G, FAM24B, and CNN3) between the hypomethylated and upregulated genes and 16 overlapping genes (SYNE1, APOBEC4, SLC20A2, GAS2L2, AL031710.1, AC027449.1, AK1, AKNA, SPAG8, RALGDS, TCTEX1D4, AP000842.2, MIR600HG, DDO, TRIM29, and FAM102A) between the hypermethylated and downregulated genes.
Interestingly, among the genes identified through the DMS pathway analysis, AK1 showed significant differences in its expression level (Fig. 5d). Previous studies have identified AK1 as a methylation signature in CPC, and its downregulation is documented not only in CPC but also in various other cancer types [19, 43, 58]. Additionally, recent research on colorectal cancer has revealed an increased expression of the adenylate kinase (AK) genes in benign polyps, followed by a decrease in expression levels of AK genes in cancer [44]. Although CPP does not seem to develop into CPC, the significant difference in expression of AK1 may cause the differences in histological characteristics between the two CPT subtypes. We observed that the amplification of chromosome 9 resulted in the increased copy number of AK1 in CPP. Therefore, we hypothesized that both the copy number gain and the hypomethylation of AK1 in CPP may have driven the overexpression of AK1, proposing that AK1 be one of the candidates driving the difference between CPC and CPP.


Add Comment