


Map of metabolic differences in liver tissue samples of HCC patients before and after immuno-targeted therapy
We detected 20 liver samples of 10 HCC patients before and after immuno-targeted treatment by metabolomics analysis, and established metabolomics difference maps. We performed partial least squares discrimination analysis(PLS-DA) of metabolites before and after treatment to reflect the variation between and within the sample groups in general. PLS-DA method was used to observe the overall distribution trend of all samples, and the results showed separation of pretherapy and post-treatment (Fig. 1A). The explanatory rate R2Y = 0.998 and predictive rate Q2 = 0.983 of the PLS-DA analysis, both of which were close to 1, indicated that this PLS-DA model explained and predicted the differences between the two groups of samples well, representing a good predictive ability of the model. Based on Pearson correlation analysis method, the correlation coefficients between significantly different metabolites were calculated and presented in the form of correlation coefficient matrix heat map(Fig. 1B). Heatmap plot was used to show differential metabolites before and after immuno-targeted treatment and results showed that most metabolites were altered in before immuno-targeted treatment relative to after immuno-targeted treatment. The elevated ranked top 20 metabolites included Perfluoropropanesulfonic Acid, Secopenitrem D, N-Acetylneuraminate, Fenoldopam, 2,4-Dinitrotoluene, Etomidate, Gly-Val, Pangamic Acid Sodium, 8-Gingerol, D-(+)-Malic Acid, Destruxin A, Serine-Cholic Acid, Toradol, D-(+)-Pantothenic Acid, Butyrolactone I, 2-Coumaric Acid, Norharman, Raltitrexed, Xanthyletin, N-Acetyl-Dl-Methionine. Meanwhile, there were top 20 decreased metabolites, contained Isopalmitic Acid, Dodemorph, Delsoline, 3-Hydroxybenzo(A)Pyrene, N,N-Dimethyldodecylamine N-Oxide, Ascorbic Acid, Menthol, Styrene, Morpholine, Pacifenol, 6-Hydroxynicotinate, 3,4-Dimethoxybenzoic Acid, Cis, Cis-Muconic Acid, Maleic Acid, Methanesulfonate, Triptophenolide, Dodecylbenzenesulfonic Acid, Rhodinyl Acetate, 4-Hydroxybenzoylcholine, Cyclohexylamine (Fig. 1C and D). KEGG pathway analysis showed that these differential metabolites were mainly concentrated in central carbon metabolism in cancer, alanine, aspartate and glutamate metabolism, ABC transporters, butanoate metabolism, glycine, serine and threonine metabolism, citrate cycle (TCA cycle), nicotinate and nicotinamide metabolism, protein digestion and absorption, and biosynthesis of amino acids (Fig. 1E and F).

Map of metabolic differences in liver tissue samples of HCC patients before and after immuno-targeted therapy. (A) PLS-DA method was used to observe the overall distribution trend of all samples. R2X and R2Y denote the percentage of X and Y matrix information that can be explained by the PLS-DA classification model, respectively, and Q2Y is calculated by cross-validation. R2X = 0.473, R2Y = 0.998,Q2 = 0.983 (B) Based on the Pearson correlation analysis method, the correlation coefficient (R) between the differential metabolites was between − 1 and + 1. R > 0 means positive correlation, which is represented by red; R < 0 means negative correlation, which is represented by blue. (C) The results of hierarchical clustering of differential metabolites caused by liver injury samples before(A group) and after(B group) treatment. The redder the color, the higher the relative expression level, the bluer the lower the relative expression level. (D) Volcano plot, with FC > 1.5 or FC < 0.667, and P value < 0.05 as the screening criteria, the vertical dotted line analysis indicates log2(1/1.5) and log2(1.5), red dots in the figure indicate up-regulated metabolites, blue Dots indicate down-regulated metabolites.(E) The significant pathway bubble map shows the top10 significant pathways. (F) Histogram of KEGG pathway enriched for significant top10
Map of metabolic differences in liver tissue samples with severe liver injury before and after immuno-targeted therapy
We analyzed the changes of metabolites in 5 HCC patients with severe liver injury before and after immuno-targeted treatment. We adopted positive, negative, and mix mode to analyze the differential metabolites respectively. The mix model was applied firstly. The circos diagram mainly showed the correlation between multiple differential metabolites. The following combinations were among the top 10 differential metabolites that we examined at in our analysis, including Baicalin, Pyridine, Nicotinamide, Adenosine.3`,5`-Cyclic Monophosphate, Perfluoropropanesulfonic Acid, Rofecoxib, Phosphoenolpyruvic Acid, Aconitic Acid, Styrene, and D-Sorbosonic Acid (Fig. 2A). According to the structure and function of metabolites, the different metabolites in each comparison group were classified and counted, and the results of substance classification in KEGG and HMDB databases were provided respectively(Fig. 2B). The top 20 up-regulated metabolites(including Perfluoropropanesulfonic Acid, Pentadecanoic Acid, Sparfloxacin, Palmitoylcarnitine, et al.) and the top 20 down-regulated metabolites (including Pramiracetam, Styrene, Homoeriodictyol, 7-Oxocholesterol, Ascorbic Acid, et al.) were shown Fig. 2C according to the multiples of difference. KEGG pathway analysis showed that these differential metabolites were mainly concentrated in ferroptosis, ABC transporters, biosynthesis of cofactors, biosynthesis of amino acids, purine metabolism, vitamin digestion and absorption, et al. (Figure 2D and E). Sankey diagram was used to visually analyze the trend of data flow between downregulated metabolites and various pathways and results indicated that the rightmost hierarchy with the largest pool of differential metabolites is metabolism, and the most concentrated in the metabolic pathway is global and overview maps of biosynthesis of amino acids and cofactors. And glutamate metabolism accounted for half of the amino acids metabolism(Fig. 2F). Next, both positive and negative patterns were analyzed, and the results were shown in Figure S1–S2. The above results showed that the metabolism of liver tissue samples with severe liver injury was significantly different before and after immuno-targeted therapy.

Map of metabolic differences in liver tissue samples with severe liver injury before and after immuno-targeted therapy. (A) The circos diagram of differential metabolite. (B) Differential metabolite hierarchical clustering results, the redder the color, the higher the relative expression, and the bluer the bluer, the lower the relative expression. The metabolite classification information of the KEGG and HMDB databases is also shown in the figure. (C) Differential metabolites with a higher degree of importance are displayed, the abscissa is the log transformation of FC, and the ordinate is the metabolites. The blue and red dots on the left and right sides represent the down-regulated and up-regulated differential metabolites, respectively. (D) The pathways with the top30 significance are displayed, the abscissa represents the negative logarithmic transformation of p-value, the ordinate represents the name of the pathway, and the size of the circle represents count, that is, the number of differential metabolites annotated into the pathway; the color of the circle corresponds to the corrected p -value, more significant from red to blue. (E) Salient pathway histogram showing KEGG pathway enriched for salience top30. (F) The first column on the left of the significant pathway Sankey diagram represents the differential metabolites of up & down, and the width of the branch curve corresponds to the size of the data flow
Map of metabolic differences in liver tissue samples with mild liver injury before and after immuno-targeted therapy
We analyzed the changes of metabolites in 5 HCC patients with mild liver injury before and after immuno-targeted treatment. We adopted positive, negative, and mix mode to analyze the differential metabolites respectively. Firstly, the mix model was applied. We investigated the connection between the top 10 most important differential metabolites, which included Sulfadimethoxine, 4-Nitroquinoline 1-Oxide, Ergonovine Maleate, Sulfadimethoxine, Propanil, Boscalid, Pyruvate, Poricoic Acid A, Histamine Dihydrochloride and Guanosine (Fig. 3A). According to the structure and function of metabolites, the different metabolites in each comparison group were classified and counted, and the results of substance classification in KEGG and HMDB databases were provided respectively(Fig. 3B). The top 20 up-regulated metabolites(including Perfluoropropanesulfonic Acid, Flufenacet Oxa, Palmitoylcarnitine, et al.) and the top 20 down-regulated metabolites (including Pacifenol, Cocamidopropylbetaine, Didemnin B, Gitoxigenin Diacetate, Ascorbic Acid, et al.) were shown Fig. 3C according to the multiples of difference. KEGG pathway analysis showed that these differential metabolites were mainly concentrated in biosynthesis of cofactors, purine metabolism, biosynthesis of amino acids, central carbon metabolism in cancer, taste transduction, vitamin digestion and absorption, et al. (Figure 3D and E). Sankey diagram indicated that the rightmost hierarchy with the largest pool of differential metabolites is metabolism, and the most concentrated in the metabolic pathway is global and overview maps of biosynthesis of amino acids and cofactors. And glutamate metabolism accounted for half of the amino acids metabolism (Fig. 3F). Next, both positive and negative patterns were analyzed, and the results were shown in Figure S3-S4. These results indicate that even in mild liver injury, there are still many changes in the metabolism of liver tissue samples before and after immunotargeted therapy.

Map of metabolic differences in liver tissue samples with mild liver injury before and after immuno-targeted therapy.(A) The circos diagram of differential metabolite. (B) Differential metabolite hierarchical clustering analysis (C) Differential Metabolite Importance Analysis (D) The prominent top30 pathway salient pathway bubble chart (E) Salient pathway histogram showing KEGG pathway enriched for salience top30. (F) Significant pathway Sankey diagram
AA attenuates liver injury in vivo and vitro
Overall, there were some consistent findings in the analysis of individuals with severe and mild liver damage. Perfluoropropanesulfonic Acid, Secopenitrem D, Fenoldopam, Pangamic Acid Sodium, D-(+)-Malic Acid, Menthol(-), and Styrene were all among the top 20 increasing metabolites identified in the three analysis. Isopalmitic Acid, Dodemorph, 3-Hydroxybenzo(A)Pyrene, N, N-Dimethyldodecylamine N-Oxide, AA(Ascorbic Acid) were shared among the top 20 descending metabolites in the three analyses(Fig. 4A). The KEGG pathway analysis of the overall analysis enriched in glutamate metabolism, biosynthesis of amino acids, the analysis of individuals with severe liver injury enriched in ferroptosis, biosynthesis of amino acids, vitamin digestion and absorption, and the analysis of individuals with mild liver injury enriched in biosynthesis of amino acids, vitamin digestion and absorption. Amino acid biosynthesis, glutamate metabolism, and vitamin digestion and absorption are all associated with ferroptosis [16, 17]. Moreover, the levels of AA were significantly decreased in the liver tissue that underwent treatment. Consequently, we would like to investigate the link between AA and ferroptosis in liver tissue.

AA attenuates liver injury by modulating ferroptosis pathway in vivo. (A) Before and after immuno-targeted treatment, the same differential metabolites were found in the two groups of samples with mild(BT. vs. BC) and severe liver injury(AT. vs. AC). (B) Diagram of experimental steps in mice. (C) The content of AA in liver samples of mice in PBS group, AA group, anti-PD1 + TKI group, anti-PD1 + TKI + AA group, Fer-1 group, and anti-PD1 + TKI + Fer-1 group. (D) The content of ALT, AST in blood of mice in PBS group, AA group, anti-PD1 + TKI group, anti-PD1 + TKI + AA group, Fer-1 group, and anti-PD1 + TKI + Fer-1 group. (E) HE staining of mouse liver tissue and pathology score in PBS group, AA group, anti-PD1 + TKI group, anti-PD1 + TKI + AA group, Fer-1 group, and anti-PD1 + TKI + Fer-1 group. Scale bar, 50 μm.(F) The content of GSH in liver samples of mice in PBS group, AA group, anti-PD1 + TKI group, anti-PD1 + TKI + AA group, Fer-1 group, and anti-PD1 + TKI + Fer-1 group. (G) SLC7A11, GPX4, β-ACTIN protein expression in PBS group, AA group, anti-PD1 + TKI group, anti-PD1 + TKI + AA group, and Fer-1 group, and anti-PD1 + TKI + Fer-1 group. *, P < 0.05; **, P < 0.01; ***, P < 0.001,****, P < 0.0001
Through cross-analysis, we found that AA decreased significantly in the total differential metabolites before and after immuno-targeted treatment, and decreased more significantly in HCC patients with severe liver injury than in the group with mild liver injury. For addressing the possible effect exerted by AA for immuno-targeted-induced liver injury in HCC patients, we injected Hepa1-6 cells in C57BL/6 mice and treated the mice with PBS, AA, anti-PD1 + TKI, anti-PD1 + TKI + AA, respectively (Fig. 4B).We first detected the amount of AA and found that the content of AA in the anti-PD1 + TKI group was significantly lower than that in the PBS group, and the addition of AA increased the content(Fig. 4C).The results of liver enzyme showed that AST and ALT in anti-PD1 + TKI + AA group was significantly lower than that in anti-PD1 + TKI group (Fig. 4D). HE results of the liver showed that the liver injury of anti-PD1 + TKI + AA group was significantly lighter than that of anti-PD1 + TKI group, and pathology was evaluated using the Knodell score. (Fig. 4E). Fer-1 is a ferroptosis inhibitor that acts by inhibiting lipid peroxidation. We also established the Fer-1 group and the anti-PD1 + TKI + Fer-1 group to investigate whether the liver tissue injury induced by immuno-targeted treatment was caused by ferroptosis. Fer-1 reduced AST, ALT levels and attenuated liver injury caused by immuno-targeted treatment(Fig. 4C and E). Both AA and Fer-1 had the same effect of attenuating treatment-induced liver injury. In addition, we simulated liver injury by adding CCL4 to normal liver cells Lo2. The results showed the addition of AA increased the AA content in liver cells with CCL4 (Fig. 5A). These animal and cellular results suggested that AA could reduce immuno-targeted liver injury.

AA attenuates liver injury by modulating ferroptosis pathway in vitro. (A) The content of cellular AA in the control, CCL4 + PBS and CCL4 + AA groups. (B) The content of cellular GSH in the control, CCL4 + PBS and CCL4 + AA groups. (C) Fluorescent probes detect reactive oxygen specie(ROS) in control group, CCL4 + PBS group and CCL4 + AA group. (D) Relative ROS level in control group, CCL4 + PBS group and CCL4 + AA group. (E) SLC7A11, GPX4, β-ACTIN protein expression in control group, CCL4 + PBS group and CCL4 + AA group. **, P < 0.01; ***, P < 0.001,****, P < 0.0001
AA attenuates immuno-targeted-induced liver injury by modulating SLC7A11/GPX4 ferroptosis pathway in HCC
However, the cause of AA attenuating immuno-targeted-induced liver injury is still unknown. We found that previous enrichment analysis were involved in ferroptosis, so we hypothesized that AA slowed the liver by inhibiting ferroptosis pathway. To prove our hypothesis, we examined the GSH content in liver of different groups of mice and found that the content of GSH in anti-PD1 + TKI group was significantly lower than that of PBS group, which was improved by the increase of AA and Fer-1(Fig. 4F). Western blotting confirmed that ferroptosis-related proteins including GPX4 and SLC7A11 proteins were both down-regulated in anti-PD1 + TKI group, indicating ferroptosis increased. Meanwhile, AA and Fer-1 could enhance expression of GPX4 and SCL7A11 proteins(Fig. 4G). In addition, we simulated liver injury by adding CCL4 to normal liver cells Lo2. The results showed the GSH content in liver cells with CCL4 + AA was significantly higher than that in CCL4 + PBS group (Fig. 5B). The ROS probe suggested that the ROS content in CCL4 + PBS group was significantly higher than that of the CCL4 + AA group (Fig. 5C and D). Western blotting confirmed that ferroptosis-related proteins were both up-regulated in CCL4 + AA group (Fig. 5E). These results demonstrated that AA alleviated immune-targeting induced liver injury by regulating the SLC7A11/GPX4 ferroptosis pathway in HCC.
AA enhances anti-PD1 HCC therapeutic effect by increasing CD11b+ CD44+ PD-L1+cell population infiltration
Since AA could alleviate liver injury, we needed to consider its effect on tumor growth to avoid its counterproductive effect. For addressing the possible effect exerted by AA for HCC tumors, we injected Hepa 1–6 cells in C57BL/6 mice and treated the mice with PBS, AA, anti-PD1 + TKI, anti-PD1 + TKI + AA, respectively. Hepa1-6 cells with PBS tended to grow faster in mice, whereas they showed the attenuation in AA or anti-PD1 + TKI group (Fig. 6A). When anti-PD1 was added on the 8th day in AA + anti-PD1 + TKI group, the tumors tended to grow more slowly (Fig. 6A).The mice were euthanized on day 20, and the volume and weight of the tumor in AA or anti-PD1 + TKI group were found significantly smaller than those in PBS group, and those in AA + anti-PD1 + TKI were much smaller than those in AA or anti-PD1 + TKI group (Fig. 6B). According to IHC results, compared with the PBS group, the expression of Ki67 was significantly decreased after AA was injected (Fig. 6D and E). In the anti-PD1 + TKI + AA group, Ki67 was significantly decreased expressed compared with anti-PD1 + TKI group (Fig. 6D and E).These evidence indicated that AA enhanced the inhibition of HCC when combined with anti-PD1 + TKI therapy in vivo.

AA improves the efficacy of anti-PD1 therapy in HCC patients. (A) Mouse tumor pictures of PBS group, AA group, anti-PD1 + TKI group, and anti-PD1 + TKI + AA group. (B) Mouse tumor growth volume of PBS group, AA group, anti-PD1 + TKI group, and anti-PD1 + TKI + AA group. (C) Mouse tumor weight of PBS group, AA group, anti-PD1 + TKI group, and anti-PD1 + TKI + AA group. (D) Mouse tumor immunohistochemical pictures of PBS group, AA group, anti-PD1 + TKI group, and anti-PD1 + TKI + AA group. Scale bar, 50 μm. (E) Histogram of mouse tumor immunohistochemical analysis in PBS group, AA group, anti-PD1 + TKI group, and anti-PD1 + TKI + AA group. *, P < 0.05; **, P < 0.01; ***, P < 0.001
In order to explore the changes of the tumor immune microenvironment of HCC with addition of AA, two tumor samples from PBS and AA C57BL/6 mice were detected by mass cytometry, respectively.There were 32 cell clusters in total, and the respective cell clusters were defined based on the specific markers of the respective cell types (Figure S5, Fig. 7A and B). As indicated from the result, the relative proportion of DC and macrophages in AA group showed an increasing trend compared with the PBS group, whereas monocytes showed a downward trend (Fig. 7C). In particular, we found that the CD11b+CD44+PD-L1+ cell population was significantly increased in the AA group compared to PBS (Fig. 7D), which aroused our great interest. We further verified the mouse tumor tissue by immunofluorescence, and found that the expressions of CD11b+CD44+PD-L1+ were significantly increased in the AA group compared with the PBS group (Fig. 7E and F), which were consistent with the results of mass cytometry. In addition, it was revealed that the expression of CD11b, CD44, and PD-L1 increased while PD1 decreased in AA group (Fig. 8A and B), which was consistent with immunohistochemistry results(Fig. 8C and D). These results confirmed that AA could improve the anticancer effect of immunotherapy by recruiting CD11b+CD44+PD-L1+ cells.
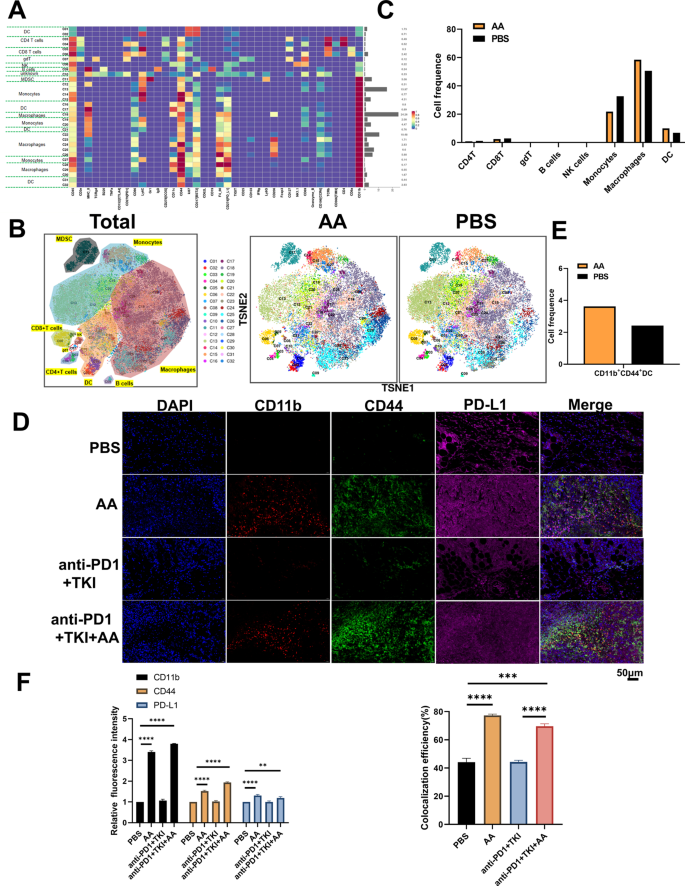
AA enhances the efficacy of anti-PD1 therapy in HCC by improving CD11b+CD44+PD-L1+ cell population. (A) The expression levels of various immune factors in PBS and AA group. The left side of the figure is labeled with the different cell populations, and the right side of the figure is labeled with the percentage of different cell populations. (B) The expression levels of various immune cells in PBS and AA group. (C) The proportion of immune cell populations in PBS and AA group. (D) Mouse tumor immunofluorescence(IF) CD11b, CD44, PD-L1 staining in PBS and AA group. Scale bar, 50 μm. (E) The population of CD11b+CD44+PD-L1+ cell in PBS and AA group. (F) Histogram of mouse tumor IF analysis in PBS and AA group. **, P < 0.01, ***, P < 0.001,****, P < 0.0001
Add Comment