Quercetin improves short-term memory ability and increases the proportion of NK cells in middle-aged mice
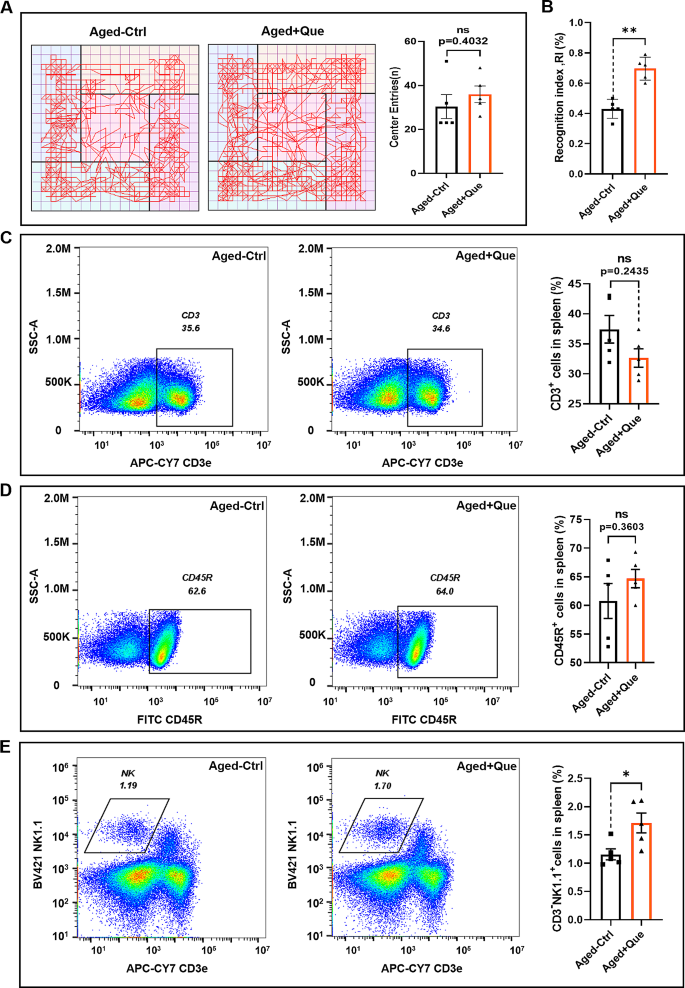
We investigated anxiety/depression-like behaviors and the learning and memory abilities of middle-aged mice (10 months) treated with quercetin via tail vein injection (1 mg/kg every 2 days for 30 days) using the novel object recognition and open field tests. There was no significant difference in the number of crossings of the center area between the quercetin-treated and control groups in the open field test (Fig. 1A). Quercetin did not affect the anxiety levels of middle-aged mice, but in the novel object recognition test, the recognition index was significantly higher in the quercetin-treated group than in the control group (Fig. 1B). This result suggests that quercetin significantly improved the short-term memory ability of middle-aged mice. As mice age, the quantity and functions of immune cells undergo changes. Our previous studies demonstrated an association between immune cells and cognitive function [33, 34]. Therefore, we examined the immune cell population in the spleen after quercetin treatment. Compared with the control group, the proportions of T and B cells in the quercetin-treated mice were not significantly different (Fig. 1C, D). However, there was a significant increase in the proportion of NK cells (Fig. 1E, F). These findings suggest that quercetin treatment had no impact on the splenic T and B cell populations, but increased the proportion of NK cells. Therefore, the influence of quercetin on short-term memory in middle-aged mice may be related to its effect on NK cells.
Quercetin improves cognitive ability and increases the number of NK cells in middle-aged mice. (A) Representative path plots and the number of crossings of the central region in the open field test for quercetin-treated (Que) and control mice. (B) Recognition indexes of the Que and control groups in the novel object recognition experiment. (C) Representative flow cytometry plots and bar graphs of T cells in the spleens of Que and control groups of mice. (D) Representative flow cytometry plots and histograms of B cells in the spleens of Que and control groups of mice. (E) Representative flow cytometry plots and histograms of NK cells in the spleens of the Que and control groups. (n = 5 for each group, ns p > 0.05, *p < 0.05, **p < 0.01)
Quercetin promotes the maturation of NK cells
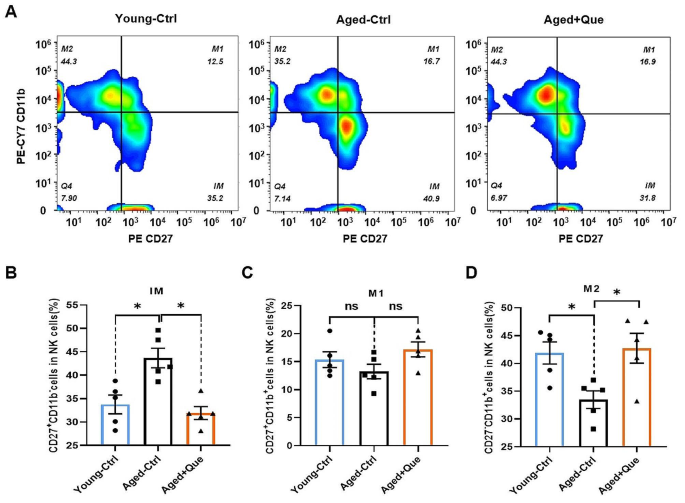
NK cells are components of the innate immune system, but they also participate in the adaptive immune system and in the immune memory response [35]. Mouse NK cells were identified by CD3−NK1.1+ labeling, and mature functional NK cells were divided into three different subsets according to their expression of CD27 and CD11b, as follows: CD27+CD11b− (immature), CD27+CD11b+ (intermediate mature) and CD27−CD11b+ (mature) [36]. CD27+CD11b− cells represent immature NK cells with potent proliferative ability. CD27+CD11b+ cells are intermediate mature NK cells with the highest cytotoxicity. CD27−CD11b+ cells are terminal mature NK cells with a strong ability to secrete cytokines. To further investigate the effects of quercetin on NK cells, we conducted a quantitative analysis of NK cell subsets in the spleen following quercetin treatment. Flow cytometry showed that, compared with young mice, the proportion of early CD27+CD11b− NK cells were increased significantly in middle-aged mice (Fig. 2A, B). There was no statistically significant difference in the proportion of intermediate phase CD27+CD11b+ NK cells (Fig. 2C), but there was a significant decrease in the proportion of terminally mature CD27−CD11b+ NK cells (Fig. 2D). Following quercetin treatment in middle-aged mice, the proportion of early CD27+CD11b− NK cells decreased, while the proportion of terminal mature CD27−CD11b+ NK cells increased. These results indicate that quercetin promotes the maturation of NK cells.
Quercetin promotes NK cell maturation in vivo. (A) Representative flow cytometry profiles of NK cell subsets in the spleens of young control, middle-aged control (Ctrl) and quercetin-treated (Que) mice. (B) Proportions of CD27+CD11b− NK cells (immature, IM). (C) Proportions of CD27+CD11b+ NK cells (intermediate mature, M1). (D) Proportions of CD27−CD11b+ NK cells (mature, M2). (n = 5 for each group, ns p > 0.05, *p < 0.05)
Quercetin enhances the proportion of NK cells and facilitates NK cell maturation in vitro
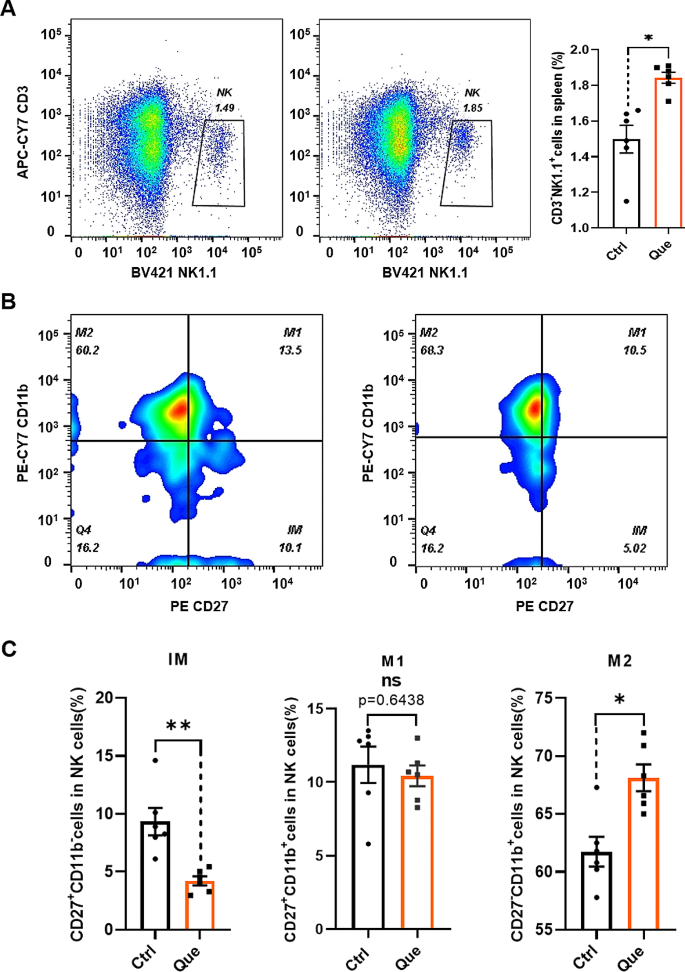
Aging leads to a decline in the self-renewal ability of hematopoietic stem cells (HSCs) in the body, resulting in an increased number of HSCs differentiating into myeloid lineage cells, a decreased number of HSCs differentiating into gonadal lineage cells, and the reduced production of immune cells [37]. The NK cells in peripheral tissues observed were derived from HSCs. The above findings demonstrate that quercetin increases the proportion of NK cells and promotes NK cells differentiation in vivo. We therefore investigated whether quercetin predominantly impacts the proportion or maturation of NK cells. The effect of quercetin on NK cells was investigated by treating spleen mononuclear cells in vitro using four different concentrations of the compound (3.125, 6.25, 12.5 and 25 µM). These concentrations had no significant effect on T or B cells. However, 12.5 and 25 µM quercetin markedly increased number of NK cells (Fig. S1). Thus, a concentration of 25 µM was used for subsequent experiments. Quercetin at 25 µM not only promoted NK cell number (Fig. 3A), but also reduced the number of early CD27+CD11b− cells and increased the number of terminally mature CD27−CD11b+ cells (Fig. 3B, C). These findings are consistent with the in vivo results obtained from quercetin-treated mice, suggesting that quercetin increases the percentage of NK cells and promotes NK cells differentiation in the spleen.
Quercetin promotes the proportion and maturation of splenic NK cellsin vitro. Cells were treated with 25 µM quercetin (Que) or DMSO (Control). (A) Representative flow cytometry profiles and bar graphs of splenic NK cells. (B) Representative flow cytometry profiles of NK cell subpopulations (immature cells, IM; intermediate mature cells, M1; mature cells, M2). (C) The proportions of CD27+CD11b− (IM), CD27+CD11b+ (M1) and CD27−CD11b+ (M2) NK cell subpopulations. Data represent mean ± SEM. *P < 0.05. **p < 0.01. ns, not significant, vs. Ctrl
Quercetin inhibits the differentiation of HSC-derived NK cells
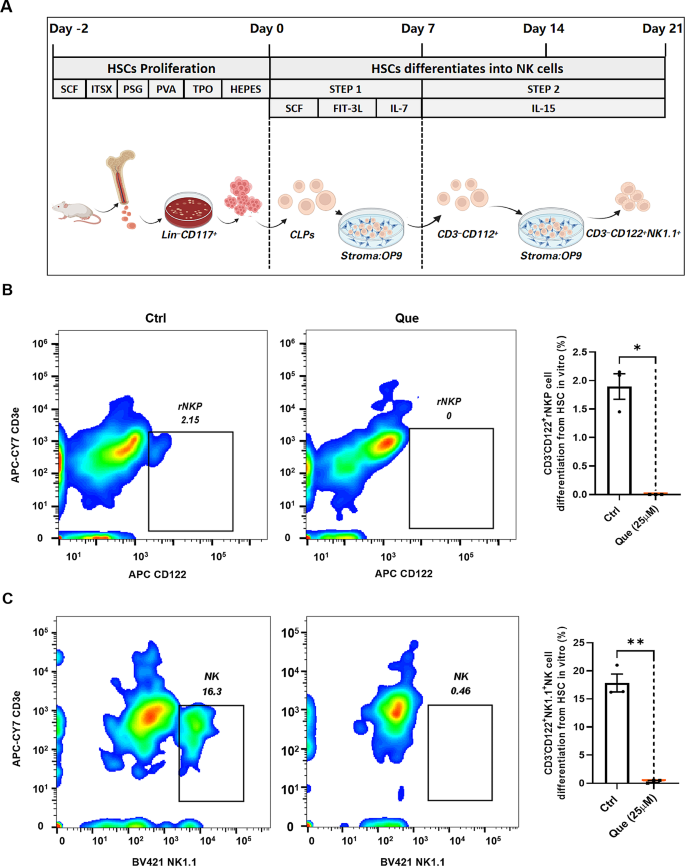
To examine the effect of quercetin on the differentiation of HSC-derived NK cells, we conducted in vitro differentiation experiments. To ensure that the concentration of quercetin was non-cytotoxic and did not induce cellular damage, three concentrations of quercetin (6.25, 12.5 and 25 µM) were selected for treating HSCs during the proliferative period, and their viability was assessed using the CCK-8 assay. None of the three concentrations of quercetin exhibited cytotoxicity towards HSCs. A concentration-dependent increase in HSC proliferation was observed (Fig. S2). Therefore, 25 µM quercetin was chosen for the following experiments. HSCs obtained from bone marrow were sorted to obtain Lin−CD117+ cells, which were then co-cultured with OP9 cells for 21 days. The culture medium was supplemented with appropriate differentiation factors to establish an in vitro culture model of HSC-to-NK cell differentiation. Following 7 days of culture, HSCs differentiated into common lymphoid progenitor (CLP) cells, which subsequently matured into CD122+ rNKP cells after an additional 7 days of culture. The rNKP cells then proceeded to differentiate into NK1.1+ NK cells (Fig. 4A). Flow cytometry analysis was used to examine CD122+ rNKP cells on the 14th day of differentiation culture, as well as NK1.1+ NK cells on the 18th day. After 14 days of differentiation, the Control group contained approximately 2% CD3−CD122+ rNKP cells, whereas the quercetin group did not contain any CD122+ cells (Fig. 4B). On the 21st day of differentiation, the CK group contained approximately 16% NK1.1+ cells, indicating successful differentiation of HSCs into NK cells. In contrast, the quercetin group did not express CD122 or NK1.1, suggesting the absence of NK cell differentiation from HSCs (Fig. 4C). Together, these in vitro findings suggest that quercetin does not promote the differentiation of HSCs into NK cells, but instead significantly impedes the differentiation of NK cells derived from HSCs.
Quercetin inhibits the differentiation of HSCs to NK cells. (A) Culture protocol for the differentiation of Lin−CD117+ hematopoietic stem cells into NK cells. (B) Representative flow cytometry profiles and bar graphs for the differentiation of 25 µM quercetin-treated (Que) and DMSO-treated (Control) Lin−CD117+ hematopoietic stem cells into rNKP cells. (C) Representative flow cytometry profiles and bar graphs for the differentiation of Que and Control Lin−CD117+ hematopoietic stem cells into NK cells. Data represent mean ± SEM. *P < 0.05. **p < 0.01
Quercetin targets the MYH9 protein
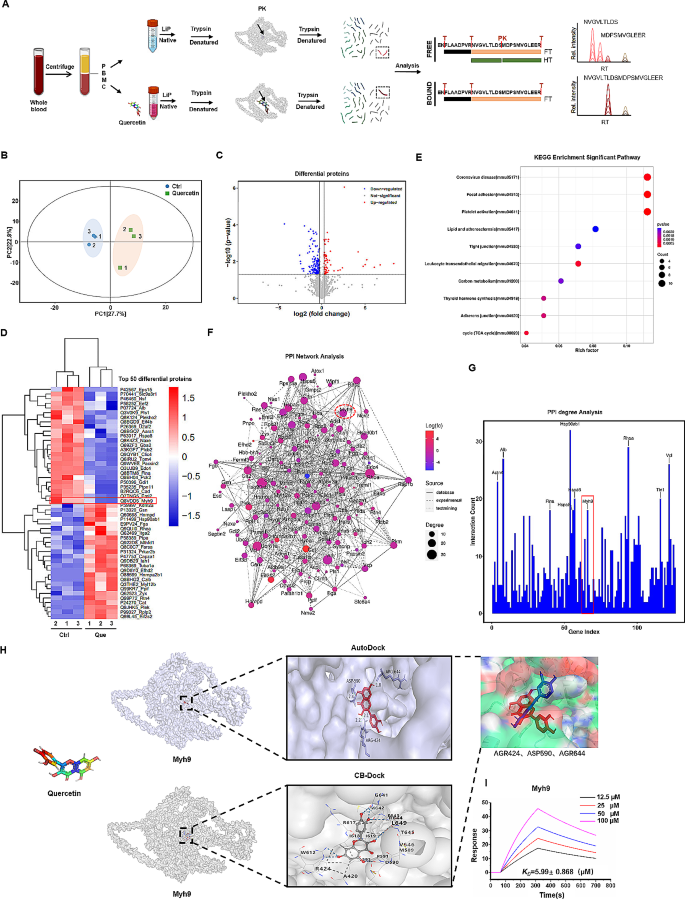
To further clarify the effects of quercetin on immune cells and uncover its target proteins and associated signaling pathways, we isolated PBMCs from C57BL/6 mice. Total cellular protein from PBMCs was extracted, and the interaction between quercetin and the extracted total protein was evaluated using Metpro protein–ligand interaction detection technology. Following incubation with quercetin, total cellular protein was enzymatically digested with trypsin, and the resulting peptides were eluted and analyzed using nanoLC-MS/MS, which successfully identified a total of 667 proteins and 1,596 peptides (Fig. 5A). To assess similarities and differences between the groups, we performed principal component analysis (Fig. 5B). In addition, differential screening of the detected peptide fragments was performed, resulting in the identification of 189 differentially-expressed peptides between the control and quercetin-treated groups (Fig. 5C and Fig S3). Subsequently, the 50 peptides displaying the most significant differential expression levels were subjected to hierarchical cluster analysis and visualized by heat map (Fig. 5D). This revealed a significant enrichment of multiple proteins associated with the cellular cytoskeleton, including the non-myosin IIA-MYH9 protein, caused by quercetin treatment. Furthermore, these differential peptides were labeled with subordinate proteins, and KEGG analysis was performed to identify significantly-enriched metabolic pathways. The analysis revealed a strong correlation between quercetin and pathways linked to coronavirus diseases, focal adhesions, platelet activation, lipids, and atherosclerosis (Fig. 5E). We constructed an interaction network diagram of the differentially-expressed proteins (Fig. 5F) and analyzed the connectivity between these interacting proteins (Fig. 5G), which revealed an association between quercetin and the MYH9 protein. The MYH9 protein, a fundamental constituent of the cellular skeleton, plays a critical role in preserving and facilitating the functionality of HSCs [38]. Additionally, it exerts influence over immune cells and regulates the cytotoxicity of NK cells [39]. Thus, the MYH9 protein is likely to be a primary target of quercetin. Therefore, we simulated their binding using CB-Duck and AutoDuck molecular docking software. In order to obtain more accurate docking results and prevent blind searching for the optimal ligand conformation throughout the entire protein structure, we initially employed the online molecular docking tool CB-DOCK to predict potential binding sites for quercetin and the protein. Subsequently, AutoDock simulations were performed based on the cavity dimensions of the predicted binding sites. After docking, we chose the docking results with the lowest binding energy and hydrogen bond generation in AutoDock, as well as a shared binding site in CB-DOCK. The simulation results showed that quercetin was located in the same cavity of the MYH9 protein, using both docking tools, with three common binding sites—arginine 424, aspartic acid 590 and arginine 644 (Fig. 5H).
Quercetin binds to MYH9 protein. (A) Label-free quantitative (LFQ) proteomics study. Schematic of the experimental design of nanoLC-mass spectrometry analysis for investigating the interaction between quercetin (Que) and PBMC proteins. (B) Principal component analysis (PCA) plot of control and quercetin-treated samples. (C) Volcano plot of the differential expression of peptides between the quercetin-treated and control groups. (D) Heatmap representation of the differentially-expressed peptides. (E) KEGG analysis of the differentially-expressed peptides. (F) Protein–protein interaction (PPI) network analysis of the differentially-expressed proteins. (G) Histogram displaying the connectivity of interacting proteins in the differentially-expressed protein set. The y-axis shows the number of proteins involved in the protein–protein interactions. (H) Visualization of the predicted binding sites for quercetin and MYH9 protein using AutoDock and CB-Duck. (I) Binding affinity of SPR COOH and MYH9-quercetin interactions. MYH9 was immobilized on COOH chips with quercetin concentrations (from top to bottom) of 100, 50, 25 and 12.5 µM
Surface plasmon resonance (SPR) analysis was employed to verify the binding capability of the MYH9 protein to quercetin. Based on the analysis of the binding constant (Ka), dissociation constant (Kd), affinity constant (KD), response curve, and affinity ranking of quercetin for MYH9 protein at varying concentrations, a specific 1:1 binding interaction between quercetin and MYH9 protein was identified. Moreover, the MYH9 response to quercetin displayed a trend towards concentration-dependency (Fig. 5I). These results demonstrate specific binding of quercetin to MYH9. Therefore, quercetin may have potential as a modulator of NK cell function through its specific targeting of MYH9.
MYH9 protein promotes the proportion and maturation of NK cells
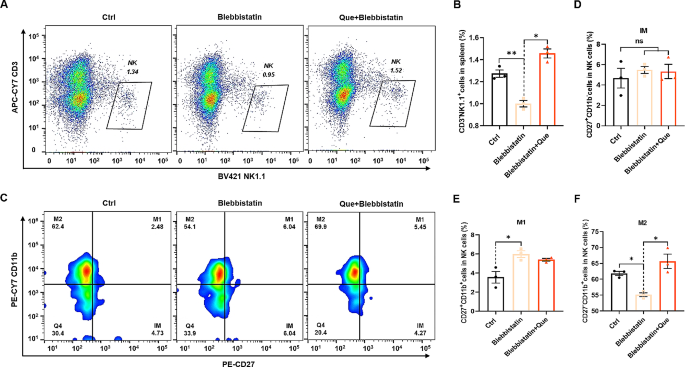
To investigate the role of MYH9 in NK cell proportion and maturation, mouse spleen mononuclear cells were treated with the MYH9 inhibitor blebbistatin (10 µM). Flow cytometric analysis was performed to examine the abundance of NK cells, which revealed a significant inhibition of NK cell proportion by blebbistatin compared with the control group (Fig. 6A). Notably, this inhibitory effect was significantly mitigated by treatment with quercetin (25 µM) (Fig. 6B). We also analyzed the NK cell subpopulations (Fig. 6C), which showed that there was no statistically significant difference in the number of early CD27−CD11b+ NK cells between the control and blebbistatin-treated groups (Fig. 6D), whereas the number of mid-phase CD27+CD11b+ NK cells was increased (Fig. 6E) and the number of end-phase CD27−CD11b+ NK cells was decreased (Fig. 6F). Quercetin treatment significantly increased the number of terminally differentiated NK cells (Fig. 6F). These results show that downregulation of MYH9 in splenocytes inhibits the proportion and maturation of NK cells. This inhibitory effect is relieved by quercetin. MYH9 promotes the proportion and maturation of NK cells, and quercetin exerts its regulatory effects on NK cells by binding to MYH9.
MYH9 protein promotes NK cell proportion and maturation. Representative flow cytometry profiles (A) and proportions (B) of NK cells among control (Ctrl), blebbistatin-treated (Blebbistatin), and quercetin (Que; 25 µM) + blebbistatin-treated spleen mononuclear cells. C, Representative flow cytometry profiles (C) and proportions of NK cell subpopulations CD27+CD11b− (D), CD27+CD11b+ (E) and CD27−CD11b+ (F) among ctrl, blebbistatin, and blebbistatin + Que- treated spleen mononuclear cells. Data represent mean ± SEM. *P < 0.05. **p < 0.01. ns, not significant, vs. Ctrl
Depletion of NK cells significantly reduces short-term memory ability in mice
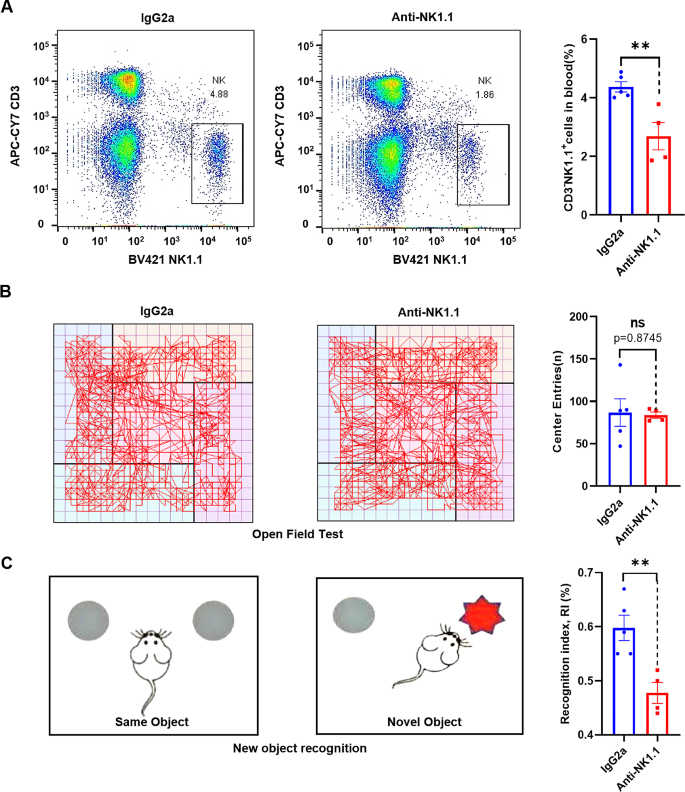
Numerous studies show an involvement of the immune system in the regulation of brain function, with peripheral immune cells capable of impacting cognition by entering the [7]. NK cells have been detected in the brain parenchyma, and they have been demonstrated to participate in neural repair after damage to the CNS, improve brain damage in Parkinson’s disease, and play a neuroprotective role [40]. To further assess the role of NK cells in cognitive function in mice, we depleted NK cells by intraperitoneal injection of anti-NK1.1 antibody [41, 42] and then evaluated cognitive performance. To assess the efficacy of NK cell depletion, we employed flow cytometry analysis to measure the percentage of NK cells in blood after the novel object recognition and open field tests were conducted. The analysis revealed a reduction in the proportion of NK (CD3−NK1.1+) cells in the group treated with anti-NK1.1 antibody, compared with the control group injected with IgG2a (Fig. 7A). This demonstrates that the mice were lacking NK cells when they performed the novel object recognition and open field tests. During the open field test, no statistically significant difference was observed in the number of center zone crossings between the NK cell depletion group and the isotype control group (Fig. 7B), indicating that NK cell depletion had no impact on anxiety or depressive behaviors in mice. In contrast, the novel object recognition test showed that the cognitive index in the anti-NK1.1 antibody group was decreased compared with the isotype control group (Fig. 7C), suggesting that short-term memory functions were impaired. These findings collectively demonstrate an influence of NK cells on the cognitive abilities of mice.
Depletion of NK cells reduces short-term memory ability in mice. (A) Representative flow cytometry profiles and bar graphs of NK cells in the spleens of IgG2a and anti-NK1.1 antibody-treated 8-week-old C57BL/6 mice. (B) Representative pathway maps and number of crossings of the central area in the open-field test in IgG2a and anti-NK1.1 antibody-treated 8-week-old C57BL/6 mice. (C) Schematic of the novel object recognition (NOR) experiment. The cognitive index from the NOR test in IgG2a and anti-NK1.1 antibody-treated 8-week-old C57BL/6 mice. Data represent mean ± SEM. **p < 0.01. ns, not significant, vs. IgG2a
Quercetin improves gene expression patterns in the hippocampus of middle-aged mice
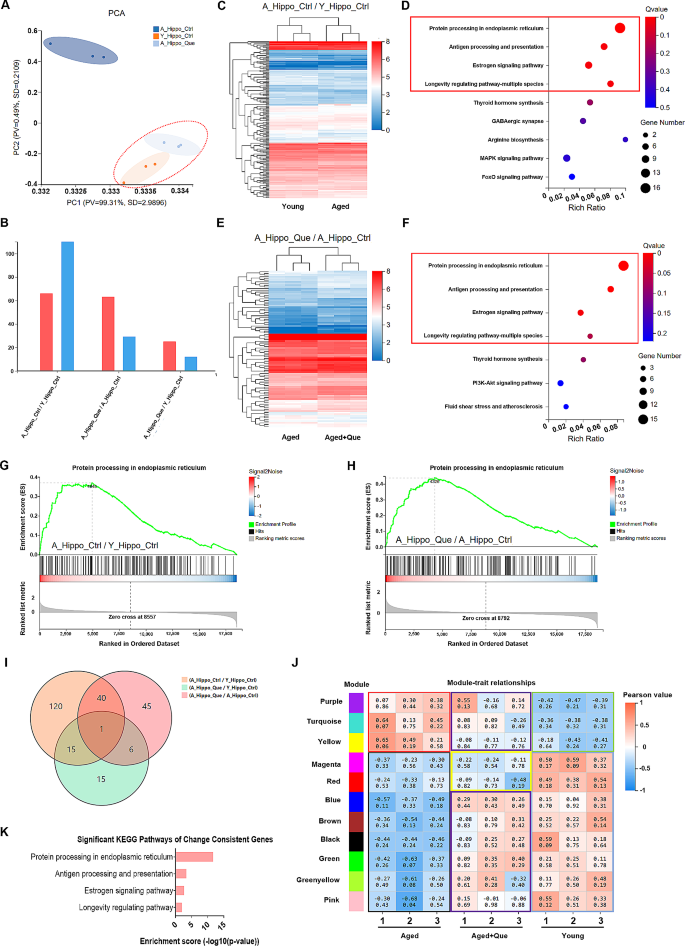
The hippocampus is a crucial region of the brain involved in learning and memory [43]. NK cells have been detected in the dentate gyrus region of the hippocampus [44]. To further investigate the effects of quercetin treatment on the brains of middle-aged mice, we performed RNA-seq analysis of the hippocampus from 8-week-old young mice, 10-month-old middle-aged mice and middle-aged mice given quercetin treatment. The analysis revealed high similarity between the hippocampal samples from the young group and the quercetin-treated middle-aged group by principal component analysis. Moreover, the hippocampal samples from the middle-aged control group differed significantly from the other two groups (Fig. 8A). Next, we conducted pairwise comparison analysis of the three groups. The differentially-expressed genes between each pair of groups were analyzed by hierarchical clustering and visualized by heat map (Fig. 8B). This revealed a substantial number of differentially expressed genes between the young and middle-aged control mice (Fig. 8C). Next, we performed KEGG pathway enrichment analysis on these differentially-expressed genes and discovered that the majority of them were concentrated in pathways related to protein processing in the endoplasmic reticulum, antigen processing and presentation, estrogen signaling pathways, and the multi-species-longevity regulatory pathway (Fig. 8D). There were more differentially-expressed genes between the quercetin-treated middle-aged mice and middle-aged control mice (Fig. 8E), while there were fewer differentially-expressed genes between young mice and quercetin-treated middle-aged mice. Interestingly, we found that the metabolic pathways significantly enriched in the middle-aged control group compared with the quercetin-treated middle-aged group were the same as those enriched in the middle-aged group compared with the young group (Fig. 8F). We also performed gene set enrichment analysis (GSEA) on genes involved in protein processing in the endoplasmic reticulum in the three groups of hippocampal samples. We found a higher expression of genes related to protein processing in the endoplasmic reticulum in both young mice (Fig. 8G) and quercetin-treated middle-aged mice (Fig. 8H), while these genes were expressed at lower levels in the middle-aged control group mice. Importantly, the expression pattern of this gene set was similar between the young group and the quercetin-treated group. In addition, we quantified the overlap of the differential genes between each group pair. There were more common differential genes between the middle-aged control group and the young group, as well as between the middle-aged control group and the quercetin-treated group, but fewer common differential genes between the young group and the quercetin-treated group (Fig. 8I). Weighted gene co-expression network analysis (WGCNA) demonstrated that the middle-aged group showed positive correlations with three gene modules, namely purple, turquoise and yellow, while the young group showed negative correlations. In contrast, the expression patterns of the middle-aged group treated with quercetin exhibited changes within these three gene modules, resulting in reduced correlation (Fig. 8J). Additionally, the blue, brown, black, green, yellow-green and pink gene modules, which demonstrated negative correlations in the middle-aged group, showed decreased correlation after quercetin treatment, with positive correlations similar to those in the young group (Fig. 8J). Finally, by analyzing the metabolic pathways enriched in the gene modules showing altered expression patterns after quercetin treatment, we identified significant overlap of the enriched pathways between the middle-aged control group and the young group, as well as between the middle-aged control group and the middle-aged quercetin-treated group. These findings suggest that there are significant differences in hippocampal gene expression patterns between middle-aged and young mice. Furthermore, quercetin alters the gene expression profiles in middle-aged mice to ones similar to those in young mice.
Hippocampal RNA sequencing of young mice, middle-aged mice and quercetin (Que)-treated middle-aged mice. (A) Principal Component Analysis (PCA) plots of the A-Hippo-Ctrl, Y-Hippo-Ctrl and A-Hippo-Que samples. (B) Number of differentially-expressed genes between each pair of the A-Hippo-Ctrl, Y-Hippo-Ctrl and A-Hippo-Que samples. (C) Heatmap of differentially-expressed genes in the A-Hippo-Ctrl and Y-Hippo-Ctrl samples. (D) KEGG analysis of the differential genes in A-Hippo-Ctrl and Y-Hippo-Ctrl samples. (E) Heatmap of the differential genes in A-Hippo-Ctrl and A-Hippo-Que samples. (F) KEGG analysis of the differential genes in the A-Hippo-Ctrl and A-Hippo-Que samples. (G) GSEA plot showing enrichment of upregulated genes (red) and repressed genes (blue) at baseline for genes involved in protein processing in the endoplasmic reticulum in A-Hippo-Ctrl compared with Y-Hippo-Ctrl. (H) GSEA plot showing the enrichment of genes involved in protein processing in the endoplasmic reticulum in A-Hippo-Que compared with A-Hippo-Ctrl for upregulated genes (red) and repressed genes (blue) at baseline. (I) Pie chart showing the number of differentially-expressed genes between each pair of the A-Hippo-Ctrl, Y-Hippo-Ctrl and A-Hippo-Que samples. (J) Plot of weighted gene co-expression network analysis (WGCNA) in the samples from the Aged, Aged + Que and Young groups. (K) KEGG analysis of genes with altered expression patterns in the hippocampus of quercetin-treated mice




Add Comment