Off-season sex- and event-specific differences in BC
The overall off- and in-season whole and regional BC estimates of the athletes are presented in Table 2, and off-season sex and event differences (mean [lower: upper, 95% CI]) can be found in Supplementary Table 1. Male athletes had significantly higher BM, FFMI, BMD, BMD Z-score and total and regional LM and BMC than female athletes (p ≤ 0.042). Males, in comparison to females, also had lower FMI, %FM and total and regional FM (p ≤ 0.006; Table 2 and Supplementary Table 1), except for trunk FM (mean difference − 568; [-1280: 144] g; p = 0.116).
Off-season event comparisons showed that power athletes (n = 32) had significantly higher BM, FFMI, BMD, BMD Z-score, FMI, and FM, and total- and regional LM and BMC (p ≤ 0.02) than endurance athletes (n = 21), while no significant differences between events in % FM and arms FM were observed.
Male power athletes had significantly higher FFMI, FMI, BMC, BMD and BMD Z-score (p ≤ 0.046) than male endurance athletes, but no significant differences in LM, FM, %FM or BM were observed (mean group BM difference 6.0 [0.6: 11.4] kg; p = 0.051). Female power athletes had, except for total %FM (p = 0.058) and arms FM (p = 0.072), significantly higher off-season BMD, BMD Z-score and total- and regional LM, BMC, and FM than the female endurance athletes (p ≤ 0.041, see Table 2 and Supplementary Table 1).
Sex and event-type off- to in-season BC changes
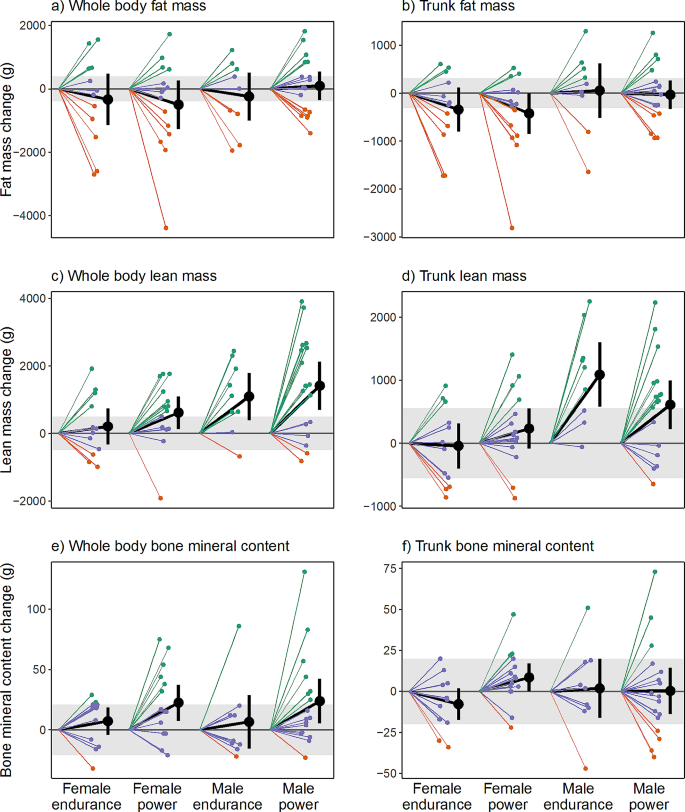
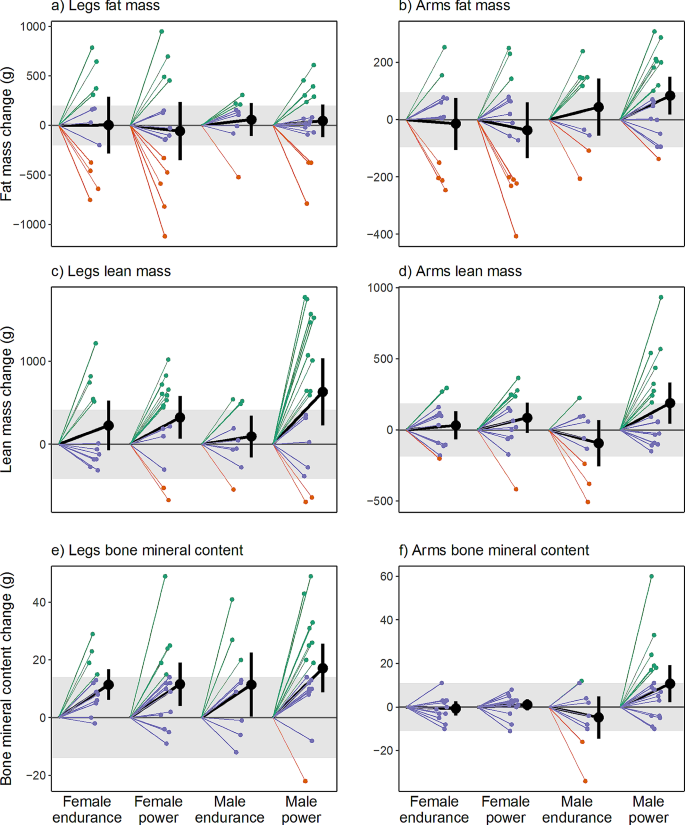
Table 2 presents the within-group differences in total and regional body composition estimates from the off-season to the in-season. Additionally, Fig. 1 illustrates the changes in total body and trunk LM, FM, and BMC from the off- to in-season periods, while Fig. 2 displays the alterations in BC specifically in the extremities (arms and legs). No significant change in absolute or %FM was observed. The male athletes gained 1.1 kg in BM (0.5: 1.8 kg; p = 0.004), a BM change which mainly consisted of LM accretion (mean change 1257 g, [757: 1757] g, p < 0.001) in the trunk and legs (mean change 851 g and 363 g, p = < 0.001 and p = 0.009, respectively). Consequently, mean FFMI increased by 0.4 kg/m2 (p < 0.001) and significant increases in BMD, BMD Z-score, total BMC, and legs BMC were also noted (p ≤ 0.015).
Individual off-season to in-season changes in whole body (a, c, e) and trunk (b, d, f) composition in elite male and female endurance and power athletics event competitors (n = 53). Grey area represents least significant change (LSC)-95% confidence interval, i.e., precision error of DXA measurement. The green lines represent athletes who experienced off- to in-season changes in LM, FM, and BMC that exceeded the LSC threshold. Red lines indicate athletes who experienced reductions surpassing the LSC threshold, while purple lines represent athletes who neither increased nor reduced beyond the LSC threshold
Individual off-season to in-season changes in legs (a, c, e) and arms (b, d, f) composition in elite male and female endurance and power athletics event competitors (n = 53). Grey area represents least significant change (LSC)-95% confidence interval, i.e., precision error of DXA measurement. The green lines represent athletes who experienced off- to in-season changes in LM, FM, and BMC that exceeded the LSC threshold. Red lines indicate athletes who experienced reductions surpassing the LSC threshold, while purple lines represent athletes who neither increased nor reduced beyond the LSC threshold
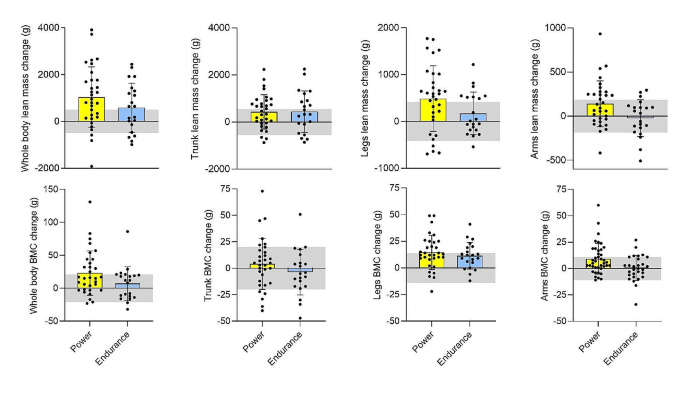
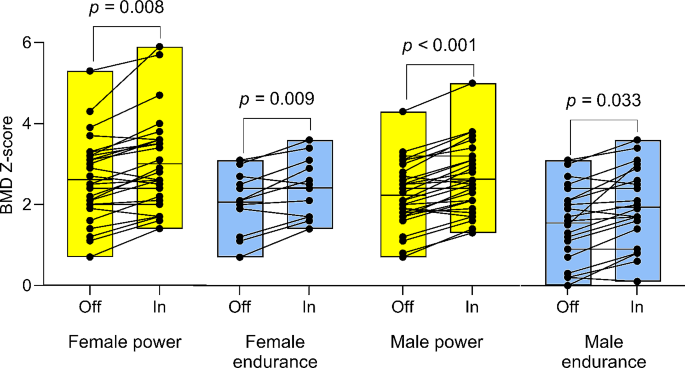
Figure 3 illustrates mean changes in total and regional LM and BMC for power and endurance athletes, respectively. The male power athletes significantly increased BM (mean change 1.4 [0.6: 2.3] kg), LM (1416 [703 to 2130] g) and arms, legs, and trunk LM and FFMI (p ≤ 0.023). BMD, BMD Z-score (Fig. 4), total BMC, and legs and arms BMC were also higher in-season than at off-season (p ≤ 0.023), while no significant change was noted for FM variables except an increase in arms FM (p = 0.023). In male endurance athletes, increments in LM (1097 [396: 1797] g; p = 0.019), trunk LM (1089 g; p = 0.001) and FFMI (0.3 kg/m2; p = 0.019) were the only significant BC changes noted.
For the female athletes (n = 27) no significant changes were found for whole or regional FM and LM variables, except legs LM which increased by 275 g from off-season to in-season (79: 475 g, p = 0.030). Furthermore, female athletes BMD, BMD Z-score, total BMC and legs BMC were significantly (p ≤ 0.030) higher at in-season than off-season.
Female power athletes significantly increased LM (mean change 618 [133: 1103] g, p = 0.041) and FFMI (0.2 kg/m2, p = 0.041), total BMC and BMD (22 g and 0.039 g/cm2, p = 0.024 and p = 0.001, respectively) and BMD Z-score (p = 0.008) but also legs LM (324 [67: 581] g; p = 0.041) and legs BMC (12 [4: 19] g; p = 0.024). In the female endurance athlete group, the only significant BC change observed over the course of the season were increased legs BMC (mean change 11 [6: 17] g; p = 0.001) and BMD Z-score (mean change 0.35 [0.15:0.55] p = 0.009).
Mean off- to in-season whole and regional lean mass and bone mineral content (BMC) changes in elite male and female power (n = 32) and endurance (n = 21) athletics event competitors. Grey area represents least significant change (LSC)-95% confidence interval, i.e., precision error of DXA measurement
Off-season (Off) to in-season (In) changes in whole-body bone mineral density (BMD) Z-scores among elite female and male competitors in power (F: n = 15, M: n = 17) and endurance (F: n = 12, M: n = 9) athletics events. The box plots depict the mean BMD Z-score and the range of values (min-max distribution). Significant indicators denote within-group off- to in-season changes
Sex and event-type differences in off- to in-season BC changes
The results of the sex and event-type differences in off- to in-season BC changes, including 95% CI and p-values, are presented in Supplementary Table 2. Male athletes gained significantly more BM (mean difference 1.5 [0.5: 2.4] kg; p = 0.027), LM (mean difference 843 [-253: 1459] g; p = 0.048) and Trunk LM (mean difference 756 [-502: 1156] g; p = 0.007) than female athletes. No other significant differences in BC change were found for sex and event-type.
Meaningful off- to-in-season BC changes
The figures (Figs. 1, 2 and 3) present the number of athletes surpassing the LSC estimates for alterations in whole- and regional LM, BMC, BMD, and FM between the off-season and in-season, while additional statistical inferences are provided in Supplementary Table 3. Notably, 58% of all athletes (20 power and 11 endurance) experienced a substantial increase (> 496 g) in LM whereas six athletes (11% of the total sample) exhibited a meaningful decrease in LM (> -496 g). In terms of regional LM changes, 51% and 45% respectively demonstrated a significant increase in leg LM (> 417 g) and trunk LM (> 417 g), while five athletes exhibited a decrease in leg LM (see Figs. 1d and 2c).
30% of athletes exhibited a verifiable increase, while 40% demonstrated a noteworthy decrease in whole-body FM (LSC = ± 396 g). Among all athletes, 32% (n = 17) exhibited an increase in leg FM (> 202 g) with a similar relative distribution across sex and event groups (27–35%, Supplementary Table 4). One-third of participants (n = 13) displayed a meaningful decrease in leg FM (Supplementary Table 4 and Fig. 2a).
All participants had high off-season BMD (1.35 ± 0.11 cm2, min-max = 1.14–1.65 cm2) and high BMD Z-score (2.23 ± 1.1, min-max = 0.0–5.3) values; however, 30% (n = 16) demonstrated a meaningful increase in whole-body BMC (> 21 g), with the majority (81%) comprising power athletes (n = 13; M/F = 8/5, Fig. 1e). Three athletes showcased a decrease in whole-body BMC (Figs. 2e and 3) that exceeded the LSC. 38% of all athletes experienced a meaningful increase (> 14 g) in leg BMC, with a larger proportion of the male power athletes (47%; n = 8) compared to the other three groups (33%, respectively).


Add Comment