Study settings
This clinical trial was conducted in Faculty of Dentistry- Cairo University, Egypt and was implemented following the ethical principles stated in the World Medical Association Declaration of Helsinki. The research protocol was reviewed and approved by the research ethics committee of the faculty with approval number (39–7-2022) on 26/7/2022. It was retrospectively registered on the clinicaltrials.gov website (https://clinicaltrials.gov/) with identification number (NCT06162182) on 8/12/2023. The trial has been reported following the STARD 2015 guidelines for Reporting Diagnostic Accuracy Studies.
Sample size calculation
A power analysis was designed by adopting an alpha (α) level of 0.05 (5%), a beta (β) level of 0.20 (20%), a within-subject correlation coefficient of (0.4), and a difference in proportions of (0.19) based on the results of a previous study [4] and on expert’s opinion; the predicted sample size (n) was found to be a total of (67) cases.
Clinical examination
Using a 0.5-mm ball-ended probe (CPITN Probe, Premium Instruments, USA) and a dental mirror, carious lesions were examined and scored according to the International Caries Detection and Assessment System “ICDAS”. Calibration of the examiners was executed using an online program on the International Caries Classification and Management System “ICCMS” website (https://www.iccms-web.com) to accurately define the eligible participants.
Eligibility criteria
Participants eligible for this study were those aged from 12 to 25 y, willing to join the study and with clinically detectable occlusal or proximal carious ( ICDAS score 3, 4) vital permanent posterior tooth with closed apex and healthy periodontal supporting. The minimum extension of the carious cavity should be at least 1 mm in width to accommodate with the probe of the Prepometer™ [14]. Excluded participants were those with poor oral hygiene, severe medical complications, showing signs and symptoms of irreversible or necrotic pulp pathology or with internal or external root resorption also when the affected tooth was with extended buccal or lingual caries, extending clinically very deep to the inner half of dentin thickness or previously restored. Also, patients suffering from any developmental or formative abnormalities e.g. molar incisor hypomineralization were excluded from the trial.
Patients were informed of the goals and procedures of the trial before consenting to participate and signing the informed consent form.
Operative procedures
All the operative procedures were performed under local anesthesia (articaine HCL 4% and epinephrine 1:100,000 (Artinibsa; Inibsa, Spain)) by one experienced operator. The tooth was prepared to receive an adhesive restoration. A tungsten carbide bur no. #245 (0.8 mm in diameter and 1.6 mm in length] (Komet, Germany) rotating in a high speed handpiece was used to remove the superficial and undermined enamel to gain access to the carious dentine and to remove caries from the walls for at least the 2 mm of the cavity boundaries to provide the peripheral seal necessary for the restoration success. The clinical determination of the caries removal endpoint was done based on the selective removal of caries consensus [15]. A sharp discoid excavator (#51&52 Dentsply Maillefer, Switzerland) was used to remove remaining carious dentine either to firm dentine “physically resistant to hand excavation and some pressure needs to be exerted through an instrument to lift it” in shallow and moderately deep cavities or to soft dentine “that deforms when an instrument is pressed into it and can be easily scooped up (e.g. with a spoon hand excavator) with little force being required” in deep and very deep cavities [15].
Measuring the remaining dentin thickness (RDT)
Index test: electrical impedance device, Prepometer™ (Hager & Werken, Duisburg, Germany)
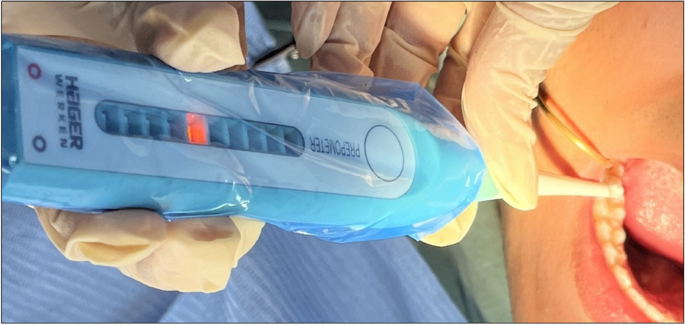
The device was calibrated before any measurement by simultaneously touching the wet dentin surface with the calibration and sensor electrodes which is confirmed by the sequential flash of all the LEDs [10]. The reference electrode was placed on the buccal vestibule during the measurement. The sensor electrode was gently dragged across the cavity floor to measure the thickness of the remaining dentin at the deepest area, which was located by two trained raters and pointed by a periodontal probe [8, 14]. The electrical impedance value is displayed on the Prepometer™ by a scale represented by ten LEDs illuminated with different colors. They represent according to the manufacturer: green – a riskless preparation, yellow—further preparation is still possible, orange – limited range for a safe preparation and it should be stopped, finally red – imminent endangerment of pulp vitality [16]. Preoperative and post excavation measurements were taken Fig. 1.
Reference standard: intraoral digital radiographic examination
A preoperative digital periapical radiograph using the paralleling technique was taken of the selected tooth using an intraoral X-ray unit (Vario DG, Dentsply Sirona) with an exposure time of 0.88 s, at 70 kV, and a tube current of 3.5 mA using a photostimulable phosphor plate (PSP) film sensor of (31 × 41 mm) dimensions VistaScan® Imaging Plate PLUS, size 2 (Dürr Dental AG, Germany). Another post-excavation periapical radiograph using the same machine and settings was taken upon the completion of caries management. A digital reader preset (VistaScan Mini Plus, Dürr Dental, Germany) was used to process the radiographic images. The image analysis was executed using DBSWIN 5.4.0; a dental imaging processing software and visualized on a LED monitor (Lenovo D19-10 18.5 inch HD, China).
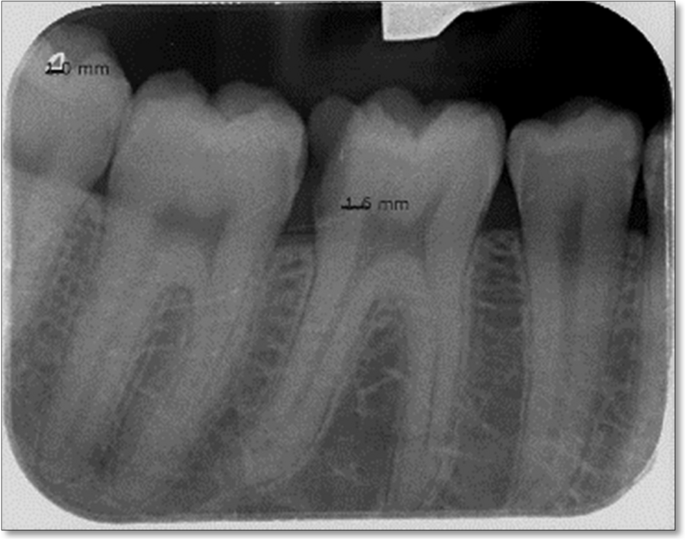
Two methods of image calibration were employed. First, the program was calibrated by equal matching the length of the imported radiographic photo to the actual length of the film sensor used for the study (41 mm). In addition, a reference guide was used which was the built-in (1 × 1 mm) triangle located at the corner of the used image plate. These calibration procedures allowed for millimeter-scale line measurements of the RDT. Two calibrated raters recorded all the measurements to confirm the reproducibility of the readings and to minimize the possibility of errors. They were blinded to the readings of the electrical impedance device, which were recorded by the operator. The radiographic image and raters’ calibration processes were done on ten initial cases with the help of a dental radiologist. The measurement was executed by drawing a straight line from the deepest point of the carious tissue floor to the highest point of the pulp before and after ending of the tooth cavity preparation [17] Fig. 2.
Patient-reported outcome measures (PROMs): patients satisfaction
Patients were evaluated regarding their satisfaction with the handling and conveniency of each device using a 4-point Likert scale: (a) “yes, very satisfied”, (b) “yes, mostly satisfied”, (c) “less satisfied”, (d) “not at all satisfied”. They were also asked to mark the Visual Analog Scale (VAS), which is a 100 mm straight horizontal line with the left end representing “not at all satisfied” while the right end indicating “very satisfied”. The satisfaction value was calculated by measuring the distance from the left end of the scale to the mark in millimeters and expressing it as a percentage (10 mm equals 10%, 20 mm equals 20%, etc.) [18].
Data treatment and statistical analysis
In order to obtain common units for comparison and based upon a previous study [19], electrical impedance device “Prepometer™” green LEDs were representing 2.1 to 3.0 mm radiographic RDT, yellow LEDs to 1.5 to 2.1 mm, orange LEDs to 0.9 to 1.5 mm while red LEDs to less than 0.9 mm. Based on these measurements, cavities depth was divided into shallow preparations where radiographic RDT is greater than 2 mm, moderately deep preparations when the RDT is 1–2 mm, deep preparations when the RDT is less than 1 mm while very deep preparations when the RDT is less than or equal to 0.5 mm [20].
Categorical and ordinal data were presented as frequency and percentage values. Numerical data were tested for normality by checking distribution and by using Shapiro–Wilk’s test. Normally distributed data were presented as mean and standard deviation (SD) values, while non-parametric data were presented as median and interquartile range (IQR) values. Inter and intragroup comparisons were analyzed using signed rank test, while agreement between devices and observations was tested using weight kappa (WK) coefficient. Statistical analysis was performed with R statistical analysis software version 4.3.1 for Windows (R Core Team, 2023).


Add Comment