
Patients’ characteristics
Eighty-nine patients with metastatic NSCLC, enrolled in this study according to inclusion criteria, were described in Table 1. Fifty-five patients were treated with ICIs alone or in association with chemotherapy as first-line therapy. Twenty-four patients were treated with Pembrolizumab as monotherapy (TPS ≥ 50%), while thirty-one patients underwent immunotherapy plus chemotherapy (TPS < 50%). Thirty-four patients were treated with Nivolumab as second-line treatment regardless of TPS status. Forty-three patients had PS = 0 (48%), and 46 were classified as PS ≥ 1 (PS = 1: 36; PS = 2: 10;). Most patients were current or former smokers (88%), and 12% of patients declared never smoked. The disease control rate was used to classify responder (R) (61%) and non-responder (NR) (39%) patients. Forty-three patients had a disease progression, while 28 showed a partial response and 18 had stable disease as the best response rate.
High levels of CD137+ T cell subsets were associated with response to anti-PD1 treatment
To study the immune activatory profile of NSCLC patients enrolled in this study, the circulating CD137+ T cell subsets were analyzed. The results showed that high levels of CD137+ and CD137+PD1+ T cells positively correlated with response to immunotherapy (Fig. 1A). Indeed, responding patients had higher levels of CD137+ T cells and CD137+PD1+ T cell subsets compared to non-responders (CD137+, R vs. NR 1.4 ± 0.8 vs. 0.82 ± 0.4, p = 0.0002; CD137+PD1+, R vs. NR 1.03 ± 0.65 vs. 0.52 ± 36 and p = 0.0002), although the percentage of CD3+ and PD1+ T cells was similar between the two groups (Additional file 1: Figure S1A). The differences observed in the CD137+ and CD137+PD1+ subsets could be ascribed to both CD8 and CD4 T cell populations (CD8+CD137+, R vs. NR 1.04 ± 0.67 vs. 0.59 ± 0.37, p = 0.0008; CD4+CD137+, R vs. NR 0.39 ± 0.3 vs. 0.22 ± 0.19, p = 0.005; CD8+CD137+PD1+, R vs. NR 0.73 ± 0.55 vs. 0.4 ± 0.3, p = 0.002; CD4+CD137+PD1+, R vs. NR 0.27 ± 0.2 vs. 0.12 ± 0.1, p = 0.0005) suggesting that each of this cell subset contribute to the overall anti-tumor immune response in this setting of patients. These immunological features were also correlated to the best overall response rate (Fig. 1B). Interestingly, patients with progression (PD) displayed significantly lower levels of CD137+ and CD137+PD1+ T cells as compared to the groups of patients with partial response (PR) and stable disease (SD) (PR vs. PD 1.6 ± 1.2 vs. 0.9 ± 0.6, p = 0.01; SD vs. PD 1.3 ± 0.5 vs. 0.9 ± 0.6, p = 0.01) (PR vs. PD 1.1 ± 0.7 vs. 0.6 ± 0.4, p = 0.03; SD vs. PD 0.87 ± 0.4 vs.0.6 ± 0.4, p = 0.006). No difference in the percentage of these two cellular subsets was observed between patients with PR and SD. These results indicate that CD137+T cells as well as CD137+PD1+ T cells are strongly associated with the clinical response.
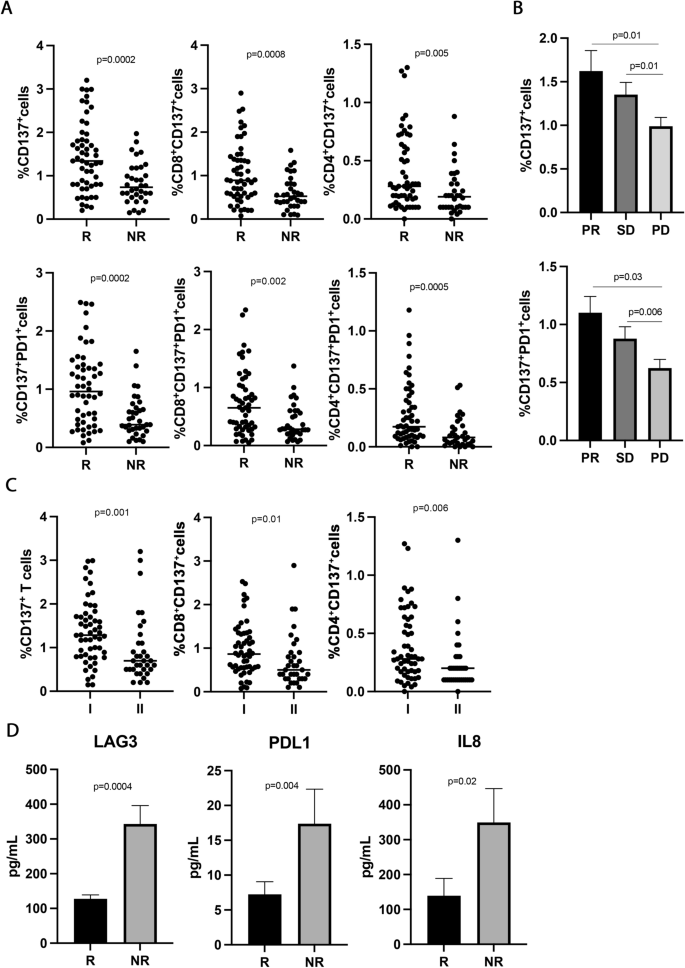
CD137+ T cell subsets sLAG3, sPDL1, and IL-8 correlated with response to ICIs in 89 NSCLC patients. A The scattered dot plots display the values of CD137+ (total, CD8+, and CD4+) and CD137+ PD1+ (total, CD8+, and CD4+) T cells in responder (R) and non-responder (NR) patients. The horizontal lines correspond to the median values of each CD137+ T cell subset in the two groups of patients. B The histograms represent the median values of CD137+ and CD137+ PD1+ T cells of patients with partial response (PR, in black), stable disease (SD, in dark grey), and progression (PD, in light grey) ± standard error of the mean (SEM). C The scattered dot plots show the percentage of CD137+ T cells (total, CD8+, and CD4+) in patients treated with immunotherapy as first (I) and second line (II). The horizontal lines correspond to the median values of each CD137+ T cell subset in the two groups of patients. D The histograms represent the median values expressed in pg/mL of soluble LAG3, PDL1, and IL8 in R (black histograms) and NR (gray histograms) patients ± SEM. p values < 0.05 were considered significant
CD137+ T cells were also evaluated stratifying the patients according to sex (female vs. male), histotype (adenocarcinoma vs. squamous), and smoking status (smoker vs. non-smoker), however, no significant differences were observed among groups. Other T cell subpopulations (Ki67+ and effectors, naïve, central memory, and effector memory cells in the CD3+, CD137+, and PD1+ T cells) were also analyzed without statistical significance (data not shown).
Finally, the levels of CD137+ T cells (total, CD8, and CD4) were also assessed according to the administration of immunotherapy (first- vs. second- line) (Fig. 1C). Results showed that naïve patients had high levels of CD137+ T cells (total, CD8, and CD4) compared to platinum-doublet chemotherapy-treated patients, demonstrating that chemotherapy negatively impacts the immune activatory profile of cancer patients.
High circulating levels of soluble LAG3, PDL1, and IL8 inversely correlated with response to immunotherapy
To evaluate the impact of soluble immune molecules on the response to immunotherapy, 14 checkpoints, and 20 cytokines were analyzed in the serum of NSCLC patients before therapy (Fig. 1 D). Among the soluble checkpoints evaluated, sLAG3 and sPDL-1 were inversely associated with the response to ICIs. Indeed, both molecules were higher in non-responding patients (sLAG3, R vs. NR 127.5 ± 71 vs. 343 ± 302, p = 0.0004; sPDL-1, R vs. NR 7.2 ± 12.6 vs.17.39 ± 29.3, p = 0.04), confirming their correlation with a worse clinical outcome. Concurrently, the analysis of the cytokines in the serum patients showed that only the pro-inflammatory cytokine, sIL8, correlated with response to anti-PD1 treatment and displayed a higher concentration in the non-responding group (sIL8, R vs. NR 139 ± 242 vs. 349 ± 433, p = 0.02). All these data suggested that non-responder patients had before the beginning of ICIs a worse immunological fitness than responders characterized by a higher inflammatory milieu. Interestingly, the release of these three molecules was correlated (sLAG3-sPDL1, r = 0.49; sLAG3-sIL8, r = 0.68; sPDL1-sIL8, r = 0.46, p < 0.001 for all correlations). These correlations were not found between these soluble mediators and the different CD137+ T cell subsets (Additional file 1: Figure S1C).
CD137+T cell subsets correlated with longer survival
The levels of the different CD137+ T cell subsets together with the three soluble immune mediators and several clinical parameters such as TPS, age, sex, PS, and smoking status were analyzed by univariate analysis (UVA) to predict survival. The identified cut-off values for each biological parameter were reported in Additional file 1: Tables S1 and S2. Results depicted in Fig. 2 demonstrated that patients who showed a longer survival in terms of OS and PFS were characterized by high levels of CD137+ (> 1.1%), CD137+PD1+ (> 0.65%), CD8+CD137+ (> 0.8%), or CD8+CD137+PD1+ (> 0.7%) T cells. Moreover, the univariate analysis of clinical parameters demonstrated that both the female sex and PS = 0 correlated with a prolonged PFS (female vs. male: HR:1.78, 95% CI (1.0536–3.1015), p = 0.03; PS = 0 vs. PS > 0: HR:0.39, 95% CI (0.1818–0.5518), p < 0.0001) and OS (female vs. male: HR:1.87, 95% CI (1.1068–3.2408), p = 0.02; PS = 0 vs. PS > 0: HR:0.4, 95% CI (0.1972–0.5859), p < 0.0001) (Additional file 1: Tables S1 and S2).
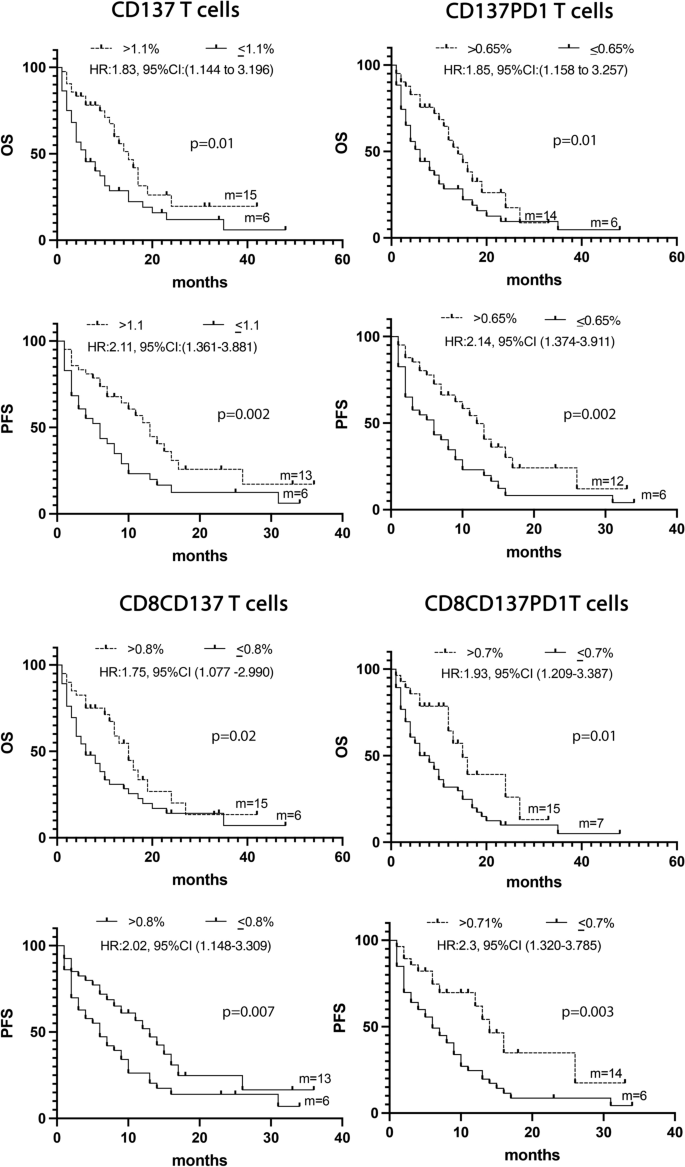
A Kaplan -Meier curves for PFS and OS were used to determine 1.1%, 0.65% 0.8%, and 0,7 as the cut-off of CD137+, CD137+ PD1+, CD137+CD8+, and CD8+CD137+ PD1+ T cells, respectively. Long-rack test was used to analyze the differences between the two groups. m = months, p values < 0.05 were considered significant
Multivariate analysis confirmed that the immunological markers CD137+ and CD137+PD1+ T cells and the clinical parameters PS = 0, and female sex represented four positive prognostic factors of OS (p = 0.0001). All these parameters, except for CD137+ T cells, resulted also as positive prognostic factors of PFS (Additional file 1: Tables S3 and S4).
CD137+ T cell subsets were associated with response to therapy and longer survival in patients treated with ICIs as first-line treatment
The predictive and prognostic role of the different CD137+ T cell subsets were further analyzed in the 55 NSCLC patients treated with immunotherapy ± chemotherapy as first-line treatment (Fig. 3). This analysis is particularly important because PD1 axis blockade as monotherapy or in combination represents the standard of care for metastatic non-oncogene addicted NSCLC patients [6,7,8].
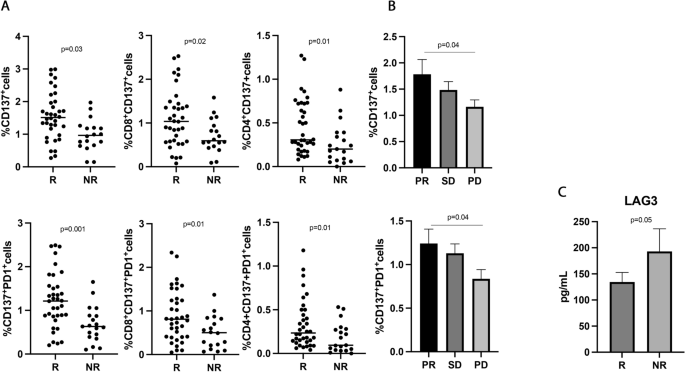
CD137+ T cell subsets and sLAG3, were associated with response to ICIs in 55 NSCLC patients treated with immunotherapy as upfront treatment. A The scattered dot plots display the values of CD137+ (total, CD8+, and CD4+) and CD137+ PD1+ T cells in responder (R) and non-responder (NR) patients. B The histograms represent the median values of CD137+ and CD137+ PD1+ in patients with partial response (PR, in black), stable disease (SD, in dark grey), and progression (PD, in light grey) ± standard error of the mean (SEM). C The histograms showed the median values expressed in pg/mL of soluble LAG3 in R (black histograms) and NR (gray histograms) patients ± SEM. p values < 0.05 were considered significant
Results partially confirmed the data obtained in the entire population of NSCLC patients. Indeed, the CD137+ and CD137+PD1+ T cells, both CD8 and CD4, were associated with response to ICIs (Fig. 3A) (CD137+ T, R vs. NR 1.56 ± 0.7 vs. 0.97 ± 0.4, p = 0.03; CD137+PD1+ T, R vs. NR 1.22 ± 0.63 vs. 0.68 ± 41 and p = 0.001), and patients with a partial response had higher levels of both T cell subsets compared to progressors (Fig. 3B) (CD137+ T: PR vs. PD 1.78 ± 1.2 vs. 1.1 ± 0.6, p = 0.04; CD137+PD1+ T: PR vs. PD 1.2 ± 0.7 vs. 0.8 ± 0.5, p = 0.04). No differences were observed between patients with SD and PD and between PR and SD. Among the soluble factors, only the immune suppressive molecule sLAG3 appeared to be higher in non-responder patients, even if this difference is not statistically significant (R vs. NR 112 ± 49.5 vs. 137 ± 44, p = 0.05) (Fig. 3C).
The UVA analysis, carried out considering the biological and clinical parameters, confirmed that the levels of CD137+ (> 1.29%), CD137+ PD1+(> 0.65%), CD8+CD137+ (> 0.71%) and CD8+CD137+PD1+ (> 0.71%) T cells together with PS = 0 and female sex were associated with a prolonged OS and PFS (Fig. 4 and Additional file 1: Tables S5 and S6).
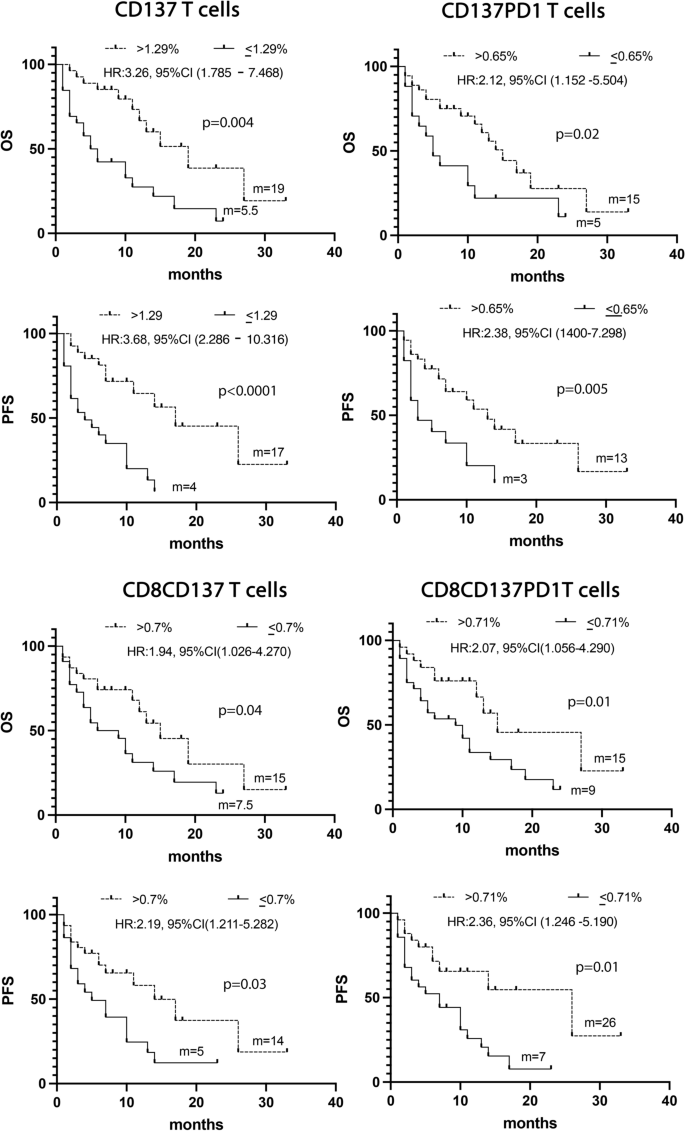
Kaplan -Meier curves for PFS and OS were used to determine 1.29%, 0.65%, 0.7%, 0.71% as the cut-off of CD137+, CD137+ PD1+, CD137+CD8+, and CD8+CD137+ PD1+ T cells. Long-rack test was used to analyze the differences between the two groups m = months, p values < 0.05 were considered significant
Combining all these significant data in a multivariate analysis confirms the CD137+T cell subset as a positive prognostic factor of survival (Additional file 1: Tables S7 and S8).
Low levels of immune suppressive PMN(Lox1+)-MDSCs were associated with response to immunotherapy in naïve NSCLC patients
To understand the impact of the immunosuppressive cells in the response to ICIs, the percentage of MDSCs, both PMN(Lox1+)- and M-MDSCs, was evaluated in 30 NSCLC patients treated with ICIs as first-line treatment (Fig. 5). Results showed that the PMN(Lox1+)-MDSCs were higher in non-responder patients (R vs. NR 0.33 ± 0.3 vs. 2.1 ± 2, p = 0.02) (Fig. 5A), while the M-MDSCs seemed not to impact the response to therapy. However, no association with PFS or OS was found for the two MDSC subsets (data not shown), thus apparently suggesting that ICI treatment did not affect these two cellular subsets regarding survival.
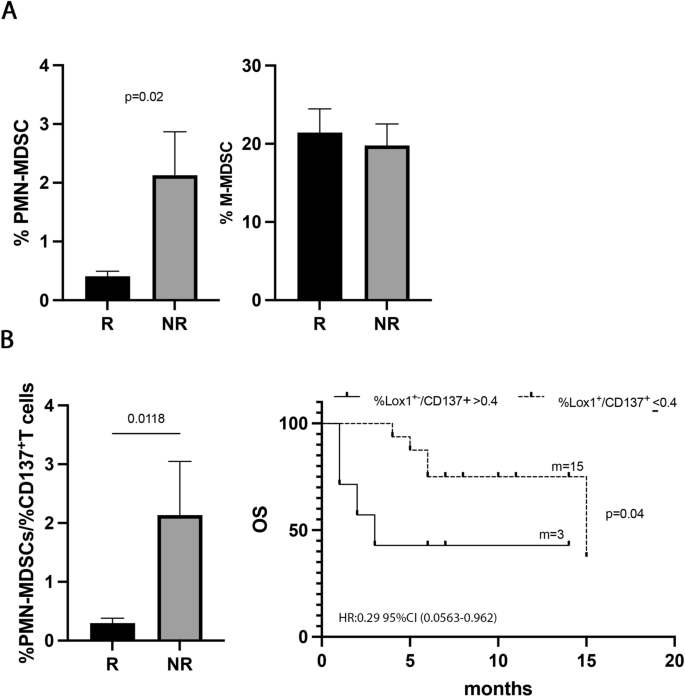
PMN (Lox1+)-MDSCs correlated with response to ICIs in naïve patients. A Histograms showed the percentage of PMN(Lox1+)-MDSCs and M-MDSCs in 30 naïve NSCLC patients. Black histograms represented the values of these cells in responders (R) and gray histograms represented the PMN (Lox1+)-MDSCs and M-MDSCs values in non-responders (NR). B Histogram displayed the % PMN(Lox1+)-MDSCs/%CD137+ T cell ratio in R (black) and NR (grey) naïve patients; Kaplan–Meier curves for OS were used to determine 0.4% as the cut-off of % PMN(Lox1+)-MDSCs/%CD137+T cell ratio. m = months, p values < 0.05 were considered significant
Interestingly, the PMN(Lox1+)-MDSCs appeared to be associated with the clinical response when we evaluated the balance between this immune suppressor myeloid subset and the activatory CD137+T cells (Fig. 5B). Indeed, a low %PMN(Lox1+)-MDSCs/%CD137+T cells ratio identified responder patients (R vs. NR 0.29 ± 0.3 vs. 2.1 ± 2.2, p = 0.01) and patients with a longer OS (ratio ≤ 0.4; p = 0.04). All these data suggested that the levels of immunosuppressive PMN(Lox1+)-MDSCs alone were not critical for survival, however, the balance between PMN(Lox1+)-MDSCs and CD137+ T cells is relevant in determining the clinical outcome.
The levels of circulating Tregs affected the survival of naïve NSCLC patients
To analyze the role of Treg cells in NSCLC, the percentage of Tregs, (total, non-suppressive, resting, and active) was evaluated in all the naïve patients (Fig. 6). Tregs and their subpopulations appeared not to affect the response to immunotherapy (Fig. 6A). However, when these populations were analyzed regarding survival, a high percentage of total Tregs (> 6.2%) appeared to be correlated with longer survival in terms of OS and PFS (p = 0.02 and p = 0.01, respectively) (Fig. 6B, Additional file 1: Tables S5 and S6). Combining these significant results in the multivariate analysis emerged that Tregs is another favorable prognostic factor of survival in this setting of patients (Additional file 1: Tables S7 and S8).
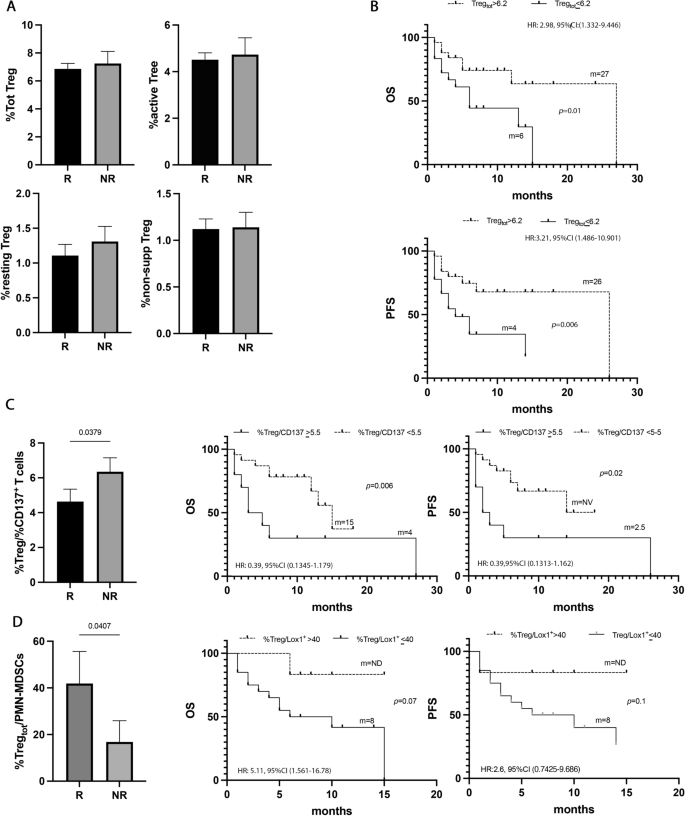
Tregs did not correlate with response to ICIs, but with survival. A Histograms represent the percentage of total, active, resting, and non-suppressive Tregs in NSCLC patients under immunotherapy treatment as the first line. Black histograms showed the median levels of the different populations of Tregs in responder patients (R), and the gray histograms represented the median values of non-responders (NR). B Kaplan Meier curves of PFS and OS of total Tregs evaluated at baseline using as cut-off a value of 6.2%. Long-rank test was used to analyze the differences between the two groups. C Histogram represented the ratio of %total Treg/%CD137+ Tcells in responders (black histogram) and non-responders (gray histogram); Kaplan Meier curves of OS and PFS of %total Treg/%CD137+Tcells ratio evaluated at baseline using as cut-off a value of 5.5%. Long-rank test was used to analyze the differences between the two groups. D Histogram represented the ratio of %total Treg/%CD137+ T cells in responders (black histogram) and non-responders (gray histogram); Kaplan Meier curves of OS and PFS of %total Treg/%PMN(Lox1+)-MDSC ratio evaluated at baseline using as cut-off a value of 40%. Long-rank test was used to analyze the differences between the two groups. m = months. p values < 0.05 were considered significant
Moreover, analyzing the %Tregs/%CD137+ T cells ratio (Fig. 6C), non-responders showed a more pronounced state of immune suppression compared to responders (NR vs. R vs. 6.3 ± 2.5 vs. 4.6 ± 3.4 p = 0.04). These data were confirmed by the analysis of survival in which patients with a %Tregs/%CD137+ T cells ratio > 5.5% showed poor OS (p = 0.006) and PFS (0.02).
The Treg levels were also analyzed as a ratio in combination with the PMN(LOX1+)-MDSCs levels. Results showed that responder patients had a higher ratio compared to non-responders (R vs. NR 41.8 ± 58 vs. 16.8 ± 25.7, p = 0.04) suggesting that the levels of Tregs in the responding group prevailed among the immunosuppressive cells (Fig. 6D). Survival analysis displayed a longer OS in patients with a %Treg/%PMN(Lox1+)-MDSCs ratio > 40, even if this difference is not statistically significant (p = 0.07). No significant differences were observed for PFS.
Add Comment