1 Introduction
Poly (methyl methacrylate) (PMMA) resin is the material of choice in dentistry to make removable partial and full dentures as well as orthodontic appliances (Alqutaibi et al., 2023). The reasons for selecting PMMA resin are mainly related to its unique combination properties, such as ease to handle in the laboratory, lightweight nature, cost-effectiveness, durability, pleasing aesthetic appearance and colour match, repairability and biocompatibility (Zafar, 2020). However, there are concerns regarding the mechanical properties of PMMA resin, for example, due to the inadequacy of its mechanical properties, such as flexural strength, impact strength, microhardness (HV) and compressive strength, the PMMA resin is highly susceptible to fracture during use (Gad et al., 2017).
It has been reported that augmenting PMMA resin by incorporating nanoparticle (NP) fillers can improve the resin’s mechanical properties (Apimanchindakul et al., 2022). NPs possess a considerably greater surface area-to-volume ratio compared to larger particles, resulting in more robust interactions with the polymer matrix consequently improving in the mechanical properties of the PMMA resin (Abdulrazzaq Naji et al., 2018). NPs provide extra connective bonding to link polymer chains together, forming an interconnected structure within the PMMA resin. These extra links within the PMMA resin improve the transmission of loads and promote a more even distribution of stresses across the PMMA resin, thereby resulting in better strength and rigidity in the formed PMMA-NP nanocomposite (Naznin et al., 2021).
NPs exhibit energetic instability due to elevated surface energy and the aggregation of these NPs causes a decrease in surface energy through an increase in particle size. Employing chemical surface treatment on metal oxide NPs proves to be an effective and crucial method for minimizing surface energy and preventing NP aggregation such as Silane compounds, serving as bifunctional modifiers, possess the ability to establish a stable bond between organic and inorganic materials (Ahangaran and Navarchian, 2020).
Many studies reported that the incorporation of MgO-NPs and Ag-NPs enhances the mechanical properties of PMMA resin. A notable enhancement in flexural strength was observed at a lower MgO-NPs concentration (1.25%). However, with higher concentrations (2.5% and 5%) of MgO-NPs, there was a marked decrease in the flexural strength (Altaee and Al-Ali, 2022). Furthermore, 2% and 4% MgO-NPs content in PMMA had favorable effects on the surface hardness. However, any further increase in MgO-NPs concentration negatively affect on surface hardness (Abdulsattar, 2023). Adding Ag-NPs at 0.2%–2% into PMMA resulted in a significant increase in compressive strength (Ghaffari et al., 2014) while 0.8% and 1.6% Ag-NPs in PMMA nanocomposite revealed decreased flexural strength, but decreasing concentration to 0.3% had no effect on flexural strength (Köroğlu et al., 2016).
It is important to acknowledge that the mechanical properties of the PMMA-NPs nanocomposite can be influenced by various factors associated with NPs, such as size, shape, dimensions, bonding, and their distribution within the PMMA resin matrix (Gad et al., 2019).
The effect of introducing Ag-NPs into PMMA resin on flexural strength has been shown to vary depending on the concentration and size of the NPs. It was reported that a lower concentration of Ag-NPs of larger size is associated with higher flexural strength (Oyar et al., 2018). Furthermore, the use of an ultrasonic device to ensure uniform mixing and prevent aggregation of NPs increased flexural strength when MgO-NP was incorporated with PMMA resin (Altaee and Al-Ali, 2022).
On the other hand, the effects of adding NPs into PMMA on impact strength, HV and compressive strength have been shown to vary according to the shape, size and concentration of the NPs (Salman et al., 2017; Alhotan et al., 2021; Earar et al., 2021; Azmy et al., 2022; Barbur et al., 2023; Nabhan et al., 2023).
It is worth noting that the impact of using different methods for mixing NPs into PMMA resin on the latter’s mechanical properties has yet to be examined. Ag-NPs and MgO-NPs are the NPs most commonly used to improve the resin’s mechanical properties, using various concentrations and shapes (Bacali et al., 2019; Sadeq et al., 2023; Aldabbagh et al., 2021; Hilal et al., 2019).
The dispersion of NPs within PMMA resin has been shown to be affected by mixing methods (Sui et al., 2022). Even the dispersion of NPs within the PMMA enhances the desired material properties and performance (Sodagar et al., 2012). Our previous study showed that ethanol-assisted mixing of NPs within PMMA resin is associated with better dispersion and homogeneity in PMMA-NP nanocomposite (Arf et al., 2023). Then, based on this observation, the current study aimed to elucidate the effect on the flexural strength, impact strength, HV and compressive strength of using non ethanol-assisted and ethanol-assisted mixing methods and adding MgO-NPs and Ag-NPs into PMMA.
2 Material and methods
2.1 Material
The clear orthocryl (self-curable acrylate) PMMA (powder: Poly (methyl methacrylate), REF 160-300-00 and liquid: Methylmethacrylate, REF 161-150-00) was used in this study (DENTAURUM). Furthermore, Ag-NPs (20nm, Spherical, 99.99%, metal basis CAS No.:7440-22-4, Hongwu International Group Ltd- China), MgO-NPs (MgO, 99.9%, 10–30nm, SkySpring Nanomaterials, Inc), absolute ethanol (CAS-No: 64-17-5, Sigmaaldrich, Darmstadt-Germany) and separating medium (Cold mould seal) REF 14002, Jammu-India was used.
2.2 Methods
2.2.1 Study groups
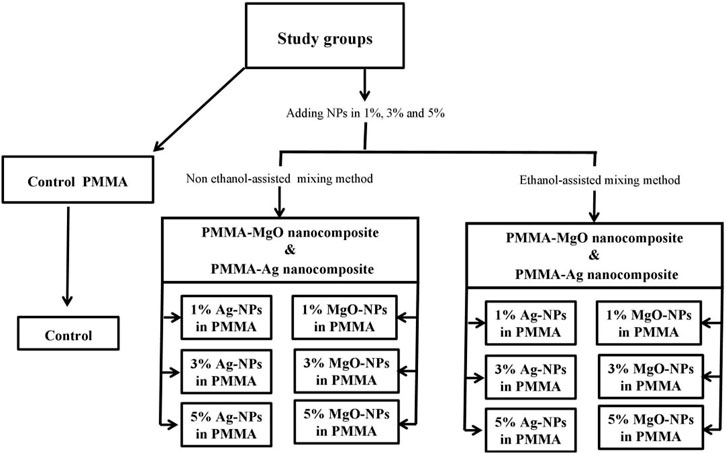
Different weights of MgO-NPs and Ag-NPs were incorporated separately into PMMA powder (Table 1) using non ethanol-assisted and ethanol-assisted mixing techniques (Arf et al., 2023). The study groups comprised 1%, 3% and 5% of both MgO-NPs and Ag-NPs using non ethanol-assisted and ethanol-assisted mixing methods with PMMA powder as a control (Figure 1).
2.2.2 Mixing NPs with PMMA powder
2.2.2.1 Non ethanol-assisted mixing of NPs with PMMA powder (without ethanol)
The defined amount of NPs was dissolved in 10 mL of absolute ethanol using a sensitive balance. Next, the solution was subjected to sonication (UP100H ultrasonic processor, Hielscher Ultrasound Technology) for 5 min to disperse and break apart any NP aggregates which usually formed during transport and storage (Yeap, 2018; Estrada-Monje et al., 2019). Then, the absolute ethanol was evaporated (Hot dry oven, Memmert GmbH + Co. KG, Schwabach, Germany) at 50°C for 48 h. The remaining NPs were further processed by grinding with a mortar and pestle until they formed a fine powder. This powder was then blended with PMMA powder and stirred (Hot plate magnetic stirrer, BIBBY, Stone, United Kingdom) for 30 min at 400 rpm to achieve homogeneity (Gad et al., 2021).
2.2.2.2 Ethanol-assisted mixing of NP with PMMA powder (with ethanol)
Following the sonication of the NPs in ethanol (as described in the above section), they were combined with the PMMA powder, creating a thick solution. Next, evaporation of ethanol was performed using magnetic stirring at 400 rpm for 2 h at 50°C. The resulting mixture was then manually ground using a mortar and pestle. To ensure complete ethanol evaporation, the PMMA-NP powder was placed in an oven at 50°C for 4 h (Boulerba and Zoukel, 2021).
2.2.3 Preparation of samples
The samples were constructed for each study group using a stainless steel mould (prepared by Hongniu fiber laser cutting machine, Jinan, China). The mould was painted with a cold mould seal separating medium and then sandwiched between two glass pads (Sun et al., 2021). PMMA powder and monomer (2.5:1 ratio) were mixed according to the manufacturer’s instruction. The samples were subsequently placed in a polyclave containing water and kept under pressure of 2.2 bar at 50°C for 25 min. Following removal from the mould, the specimens were polished (using 150-, 300-, and 600- grit sandpapers) and stored in distilled water at 37°C for 48 h.
2.2.4 Mechanical tests
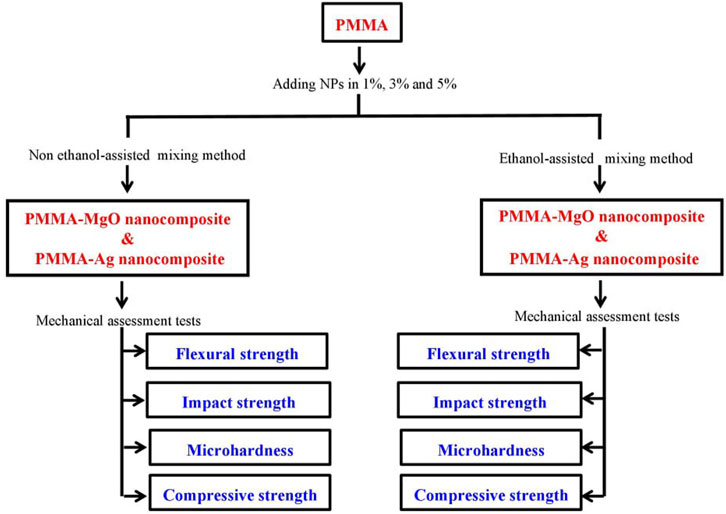
The following flowchart describes the mechanical assessment of PMMA-MgO and PMMA-Ag nanocomposite (Figure 2).
2.2.4.1 Flexural strength
A total of 91 (7 samples per group) bar-shaped specimens (65 mm × 10 mm × 3 mm) were fabricated per group using a stainless steel mould: non ethanol assisted (1%, 3%, 5%), ethanol assisted (1%, 3%, 5%) and control. The flexural strength of the specimens was determined according to ISO 20795-1 (Shahabi et al., 2021) using a universal testing machine (AI 3000, GOTECH) at a crosshead speed of 5 mm/min and a span length of 50 mm. The force leading to the specimen fracture was recorded and the flexural strength was calculated using the following formula:
Where σf is the flexural strength, F is the load at fracture, l is the distance between the supporting points, w is the specimen width and h is the specimen height (Abdelraouf, Bayoumi and Hamdy, 2022).
2.2.4.2 Impact strength
A total of 91 (7 samples per group) bar-shaped specimens (80 mm × 10 mm × 4 mm) were fabricated per group using a stainless steel mould: non ethanol-assisted (1%, 3%, 5%), ethanol-assisted (1%, 3%, 5%) and control. The samples were notched in the middle to a depth of 2.0 ± 0.2 mm with a notch angle of 45° facing opposite to the pendulum of the Charpy impact tester (Zidan, 2020) (XJJD-50 Series).
The machine testing pendulum in the form of a heavy metal disc fell and struck the specimen in the middle of the un-notch side, while the notched side of the sample was facing opposite to the pendulum. Here, the pendulum was set at a weight of 5 N to fall with a velocity of 5.5 mm/s and the energy absorbed by the impact test sample and the resulting fracture were recorded in Joules.
The Charpy impact strength of notched specimens was calculated in KJ/m2 using the following formula:
Where E is the energy absorbed to break the specimen, b is the width of the specimen in mm, and d is the thickness of the specimens in mm (Wally, AL-Khafagy and Al-Musawi, 2014).
2.2.4.3 Microhardness
A total of 91 specimens (7 samples per group) were tested for HV. The specimens were highly polished using 150, 300-, 600- and 1,200 grit sandpapers. HV measurements were then carried out, using the Vickers hardness tester (T-TEST, Golden Time Technology). Three indentations were made on each sample and the mean value was recorded as the Vickers hardness (Al-Dwairi et al., 2023).
2.2.4.4 Compressive strength
A total of 91 (7 samples per group) cylindrical specimens (6 mm height and 4 mm diameter) were fabricated according to the ASTM D695-02a (ISO 604) standard, using a stainless steel mould: non ethanol-assisted (1%, 3%, 5%), ethanol-assisted (1%, 3%, 5%) and control. The samples were subjected to a compressive strength test in a universal testing machine (AI 3000, GOTECH) at a crosshead speed of 5 mm/min (Shahabi et al., 2021).
The compressive strength was calculated using the following equation:
Where P is the compressive load and r is the radius of the specimen.
2.3 Statistical analysis
The Shapiro-Wilk test was used to check the normality of the data. One-way ANOVA was used to find the effects of different types of NP, different concentrations and mixing methods on impact strength and HV, while Kruskal–Wallis was used for flexural strength and compressive strength. Furthermore, statistical analysis was performed using SPSS statistical software (SPSS, Chicago, Il, USA, V.25) and the level of significance was set at p ≤ 0.05.
3 Results
3.1 Flexural strength test
Comparisons between the control and all test groups (both non ethanol-assisted and ethanol-assisted mixing) with median and interquartile range (IQR) for the flexural strength test are presented in Figure 3. It is apparent that the flexural strength of all ethanol-assisted groups was higher than for non ethanol-assisted groups for corresponding NPs and concentrations. Comparison of all non ethanol-assisted and ethanol-assisted tested groups with the control group revealed flexural strength of non ethanol-assisted of both MgO-NPs (3% and 5%) and Ag-NPs (3% and 5%) groups had decreased significantly, with p values = 0.044, 0.000, 0.040 and 0.0001, respectively. Whereas, flexural strength of ethanol-assisted groups of both MgO-NPs (1% and 3%) and Ag-NPs (1% and 3%) had increased significantly, with p-value = 0.0001, 0.007, 0.0001 and 0.01, respectively.
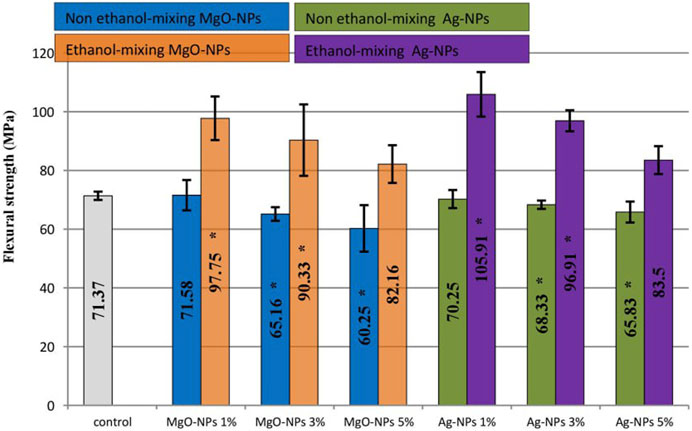
FIGURE 3. Comparison of flexural strength between control and all tested groups (*: Statistically significant).
Furthermore, no statistical difference in the flexural strength was observed between Ag-NPs and MgO-NPs when using the same concentration and mixing method. When non ethanol-assisted groups were compared against ethanol-assisted groups at the same NPs and concentration, there were significant differences between all non ethanol-assisted and ethanol-assisted groups except MgO-NPs 1%, for the same NPs and concentration (Table 2).
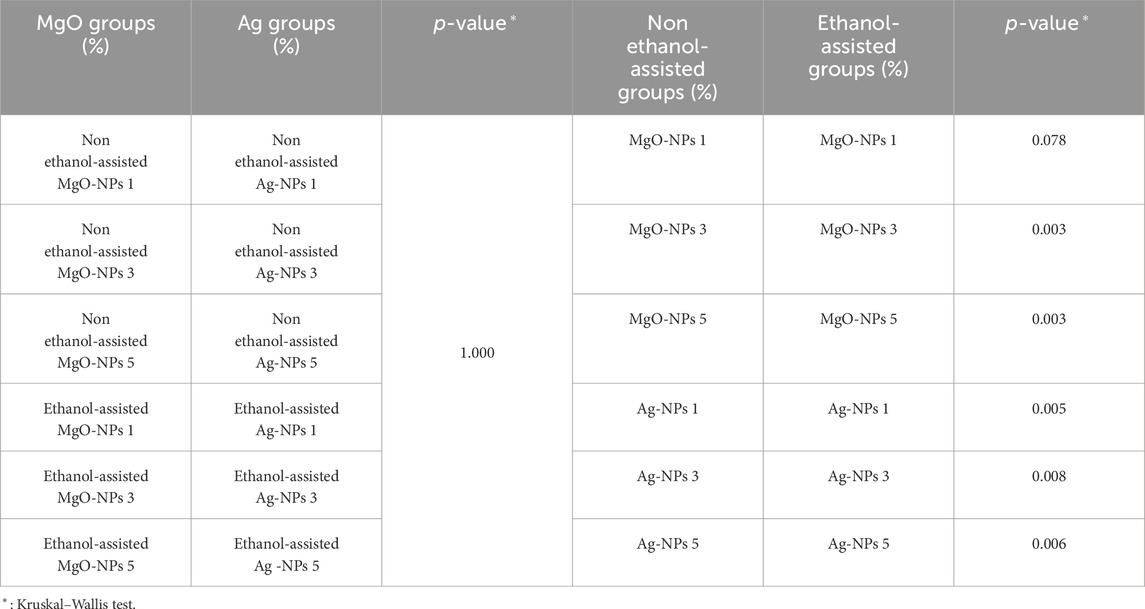
TABLE 2. Comparison of flexural strength between tested groups with different NPs using same mixing method and concentration. And for different mixing methods using the same NPs and concentration.
3.2 Impact strength test
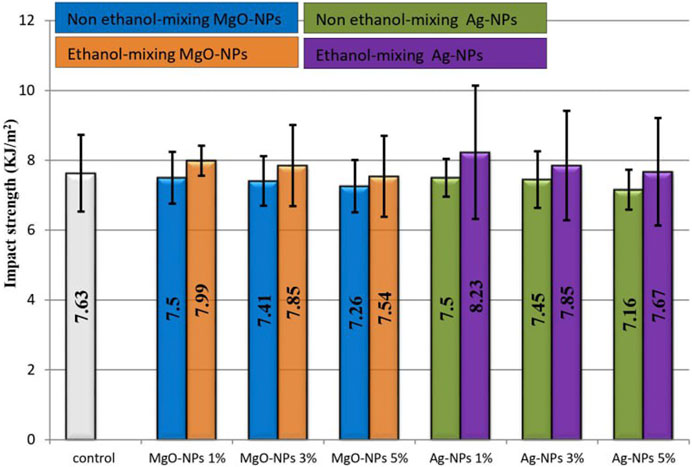
The mean and SD for the impact strength test for all test groups (both non ethanol-assisted and ethanol-assisted with control) and comparisons between all tested groups and control group are shown in Figure 4. While increases in impact strength were observed for all ethanol-assisted and non ethanol-assisted groups compared to the control group, no statistically significant differences were detected.
Moreover, when comparing the impact strength between tested groups of different NPs using the same concentration and mixing method, and different mixing methods using the same NPs and concentration, no statistically significant differences were identified (Table 3).
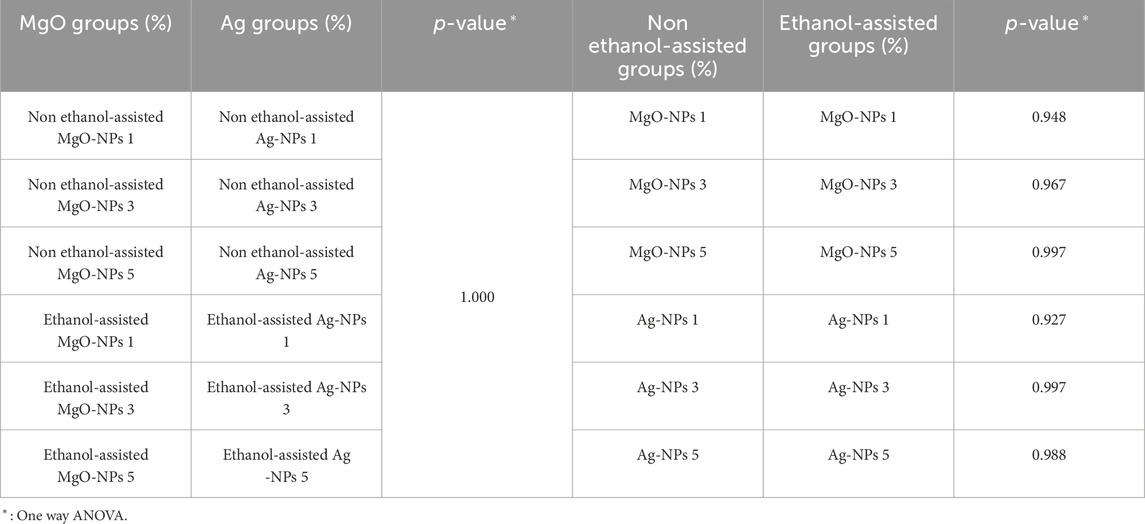
TABLE 3. Comparison of impact strength between tested groups with different NPs using the same mixing method and concentration. And for different mixing methods using the same NPs and concentration.
3.3 Microhardness test
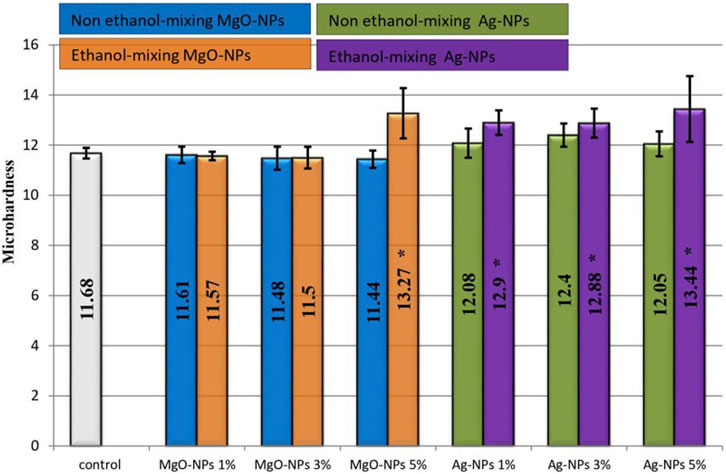
In the HV test, the mean and SD for the control and all test groups (both non ethanol-assisted and ethanol-assisted) were compared (Figure 5). The HV of all ethanol-assisted groups was higher than for non ethanol-assisted groups except for the 1% MgO-NPs group, for the same NPs and concentration. In addition, a comparison of the HV between the control group and non ethanol-assisted and ethanol-assisted groups showed statistically significant increases of HV for ethanol-assisted 5% MgO-NPs and all ethanol-assisted Ag-NPs concentrations (1%, 3% and 5%), with p-value = 0.0001, 0.028, 0.035 and 0.001, respectively. However, no statistically significant differences were found for non ethanol-assisted groups.
Additionally, comparing different NP groups, using the same concentration and mixing method, non ethanol-assisted 3% Ag-NPs, ethanol-assisted 1% and 3% Ag-NPs groups had statistically significantly higher HV compared to their corresponding MgO groups at the same concentrations. Moreover, a comparison between tested groups using different mixing methods and the same NPs and concentrations showed statistically significant differences in 5% MgO-NPs and 5% Ag-NPs, with p-value = 0.0001 and 0.007, respectively (Table 4).
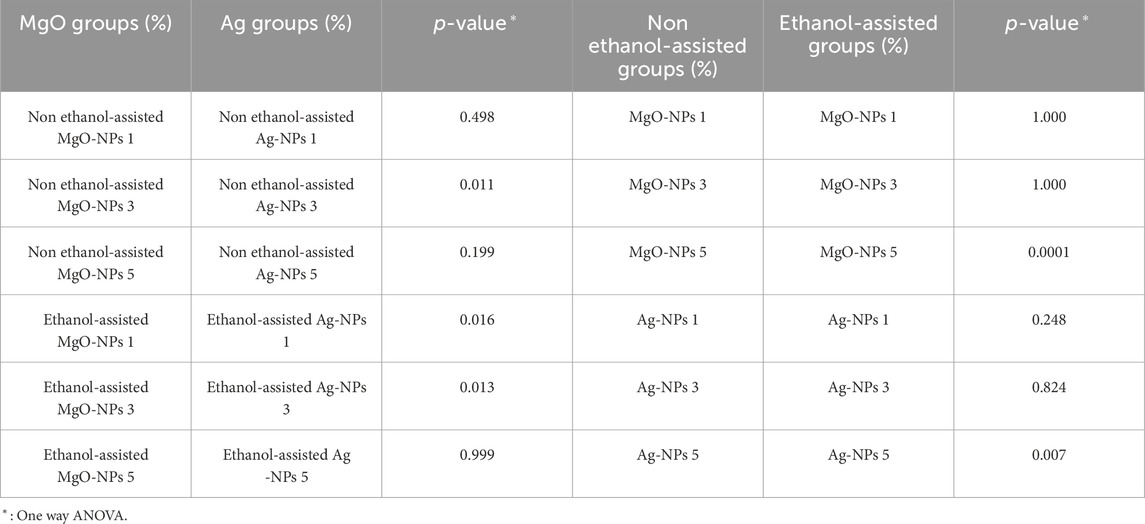
TABLE 4. Comparison of HV between tested groups with different NPs using the same mixing method and concentration and using different mixing methods and the same NPs and concentration.
3.4 Compressive strength test
Comparisons for the compressive strength test between the control and all tested groups (both non ethanol-assisted and ethanol-assisted) in terms of the median and IQR are presented in Figure 6. The compressive strength was higher in all ethanol-assisted groups than non ethanol-assisted groups for corresponding NPs and concentration, with statistically significant increases in the compressive strength of ethanol-assisted 3% MgO-NPs and 3% Ag-NPs, with p-value = 0.006 and 0.0001, respectively.
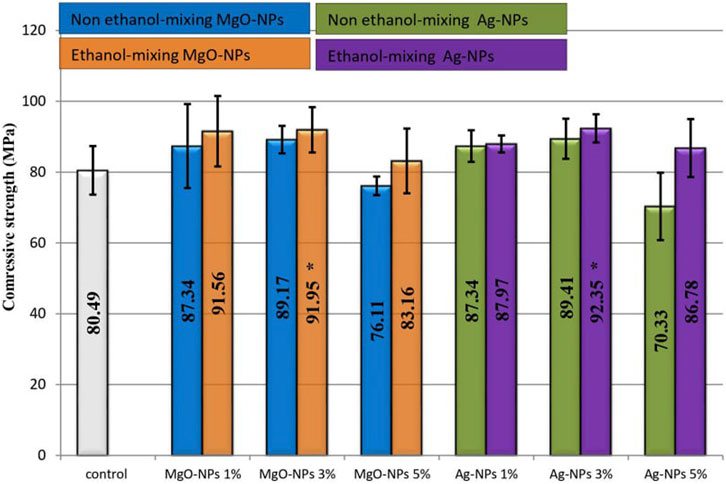
FIGURE 6. Comparison of compressive strength between control and all tested groups (*: Statistically significant).
Furthermore, no statistically significant differences in compressive strength were observed between tested groups with different NPs when using the same concentration and mixing method. Similarly, no statistically significant differences were found between tested groups using different mixing methods and the same NPs and concentration (Table 5).
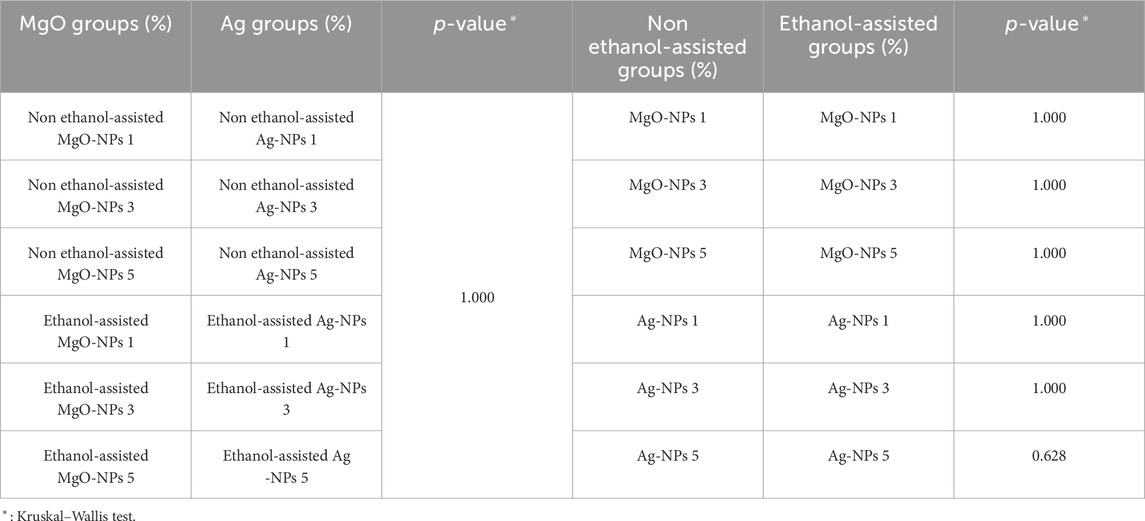
TABLE 5. Comparison of compressive strength between tested groups using different NPs and the same mixing method and concentration. And using different mixing methods and the same NPs and concentration.
4 Discussion
PMMA is a polymer resin commonly used in dentistry and has shown inadequate mechanical properties in terms of flexural strength (Mansour et al., 2013), impact strength (Arıkan et al., 2010), HV (Nandal et al., 2013) and compressive strength (Hamad, 2019). Therefore, NPs have been added to address these drawbacks (Ghaffari et al., 2014; Gad et al., 2019; Ali Sabri et al., 2021; Abdulsattar, 2023). The rationale behind the current study was based on the premise that the method used to mix NPs with PMMA can affect the mechanical properties of the produced nanocomposite material by achieving a uniform and homogeneous dispersion of NPs within the PMMA matrix (Alsayed and Aqeel Ashraf, 2021). Moreover, the agglomerated NPs within PMMA have been reported to act as stress concentration points and weaken the mechanical properties of PMMA (Zidan et al., 2019).
Ethanol-assisted mixing of NPs with PMMA resulted in a better dispersion and homogeneity of NPs within PMMA (Arf et al., 2023). To the best of our knowledge, no study has examined the effect of ethanol-assisted mixing of MgO-NPs and Ag-NPs with PMMA on the mechanical properties of PMMA. Thus, the current study aimed to evaluate the impact of ethanol-assisted and non ethanol-assisted mixing methods for MgO-NPs and Ag-NPs on the flexural strength, impact strength, HV and compressive strength of PMMA. The results show that in the cases of both tested NPs the ethanol-assisted mixing method improved the mechanical properties of flexural strength, HV and compressive strength at specific concentrations.
Flexural strength is one of the most important properties of PMMA resin; hence, many studies have investigated it (Somani et al., 2019). The present results showed that with ethanol-assisted mixing at 1% and 3%, both MgO-NPs and Ag-NPs significantly increased the flexural strength of PMMA. Additionally, no statistically significant differences were noticed between the examined NPs. Therefore, the increase in flexural strength could be mainly related to the mixing method.
The increase in flexural strength using ethanol-assisted mixing as compared to non ethanol-assisted mixing might be related to the fact that in non ethanol-assisted mixing, the NPs in PMMA resin are not homogeneous and act as impurities in the PMMA matrix, which usually decreases the flexural strength in PMMA resins (Sodagar et al., 2012). Or the NPs might have an adverse effect on the degree of conversion in polymerisation and lead to an increase in the amount of residual monomer that acts as a plasticiser (Shibata et al., 2007). Furthermore, in non ethanol-assisted mixing, the NPs agglomerate and the agglomerated NPs act as stress concentration centres in the PMMA resin matrix (Andreotti et al., 2014). Overall, these factors might decrease the flexural strength of modified PMMA when using the non ethanol-assisted mixing method. However, the ethanol-assisted mixing method improves in flexural strength due to better dispersion and homogeneity of MgO-NPs and Ag-NPs in the PMMA matrix (Stojanovic et al., 2009).
It is apparent that the concentration of the NPs might jeopardise the flexural strength of PMMA resin and this is in accordance with Ghaffari et al. (2014), who reported a decrease in the flexural strength with increasing concentration of NPs. The current study found the highest flexural strength in the 1% MgO-NPs NP concentration and the lowest flexural strength in the 5% MgO-NPs concentration. In line with our results, other studies have identified an inverse relationship between increased NP concentration and flexural strength (Ihab and Moudhaffar, 2011; Kul et al., 2016; Omer and Ikram, 2019).
Generally, oral appliances made from PMMA might fracture easily when suddenly struck or accidently dropped. Therefore, PMMA resins need sufficient impact strength to increase their durability and longevity. Our results revealed that with both mixing methods, modification of acrylic resin with MgO-NPs and Ag-NPs of up to 5% had no significant negative effects on the impact strength of acrylic resin, with better impact strength observed using the ethanol-assisted mixing method. It is worth mentioning that few studies have evaluated the effect on impact strength of adding NPs into PMMA. The results of these studies are inconsistent, with some studies showing no significant effect, which is in line with the result of this study (Shahabi et al., 2021; Zidan et al., 2019). While other studies showed a decrease (Al-Harbi et al., 2019) and an increase (Ghahremani et al., 2017) of impact strength. These conflicting results can be explained by the variation in the type and concentration of NPs used as well as the mixing methods. For example, adding Ag-NPs into PMMA at 0.8% and 1.6% did not affect impact strength (Köroğlu et al., 2016).
Wear resistance is a material’s capacity to endure surface harm or deterioration resulting from friction, abrasion or other mechanical forces over an extended period of time. HV is an important indicator of the wear of dental materials, including PMMA resin, since greater hardness reduces abrasive wear (Zidan et al., 2019). Low surface HV increases surface roughness and dental plaque retention, pigmentation, and compromises the material’s longevity and aesthetic appearance (Farina et al., 2012). The results of the current study showed that the addition of MgO-NPs and Ag-NPs using non ethanol-assisted mixing had no statistically significant effect on HV, which is in agreement with the result of another study that used non ethanol-assisted mixing (Abdelraouf et al., 2022). However, using the ethanol-assisted mixing method, significant improvements in HV were detected and this result is commensurate with another study that used ethanol-assisted mixing (Vojdani et al., 2012). This highlights the importance of the mixing method on the HV property of PMMA resin.
It is important to acknowledge that wear resistance is affected by chemical composition and structure of a material and environmental conditions such as temperature, humidity and oxidation. For example, PMMA nanocomposites with 3% TiO2-NPs exhibited the highest resistance to wear and revealed smoother surfaces (Zhang, 2014) and the inclusion of SiO2 and TiO2 fillers enhanced the wear resistance of artificial teeth (Muhammad et al., 2011). In this study, the impact of environmental factors on wear resistance was not examined as it was beyond the scope of the study.
The compressive strength of PMMA resins is vital to ensure the longevity, functionality and safety of dentures for patients. The present study indicated that ethanol-assisted mixing of the tested NPs (at 3% for both NPs) will improve the compressive strength of PMMA compared to non ethanol-assisted mixing method. Similar to this study, previous studies have also reported an increase in the compressive strength property of PMMA resin and this improvement was probably due to the uniform distribution of metal particles within the PMMA matrix. (Hamedi-Rad et al., 2014; Abdulridha et al., 2022).
The present study has limitations that include solely examining the mechanical properties of PMMA-NPs nanocomposite without examining the chemical and clinical aspects of the PMMA resin. Nevertheless, this is the first study to evaluate the effect of different methods of mixing MgO-NPs and Ag-NPs into PMMA resin on the four main important mechanical properties of PMMA resin; furthermore, to examine the combined effects of NP and mixing methods at the same time.
5 Conclusion
The results of this study indicate that using ethanol-assisted mixing of MgO-NPs and Ag-NPs with PMMA resin increases the mechanical properties of flexural strength, HV and compressive strength compared to non ethanol-assisted, whereas no improvement in the impact strength property of PMMA was detected. Furthermore, the concentration of NPs was also shown to affect the examined mechanical properties. More studies are recommended to test the impact of these mixing methods for these NPs on the chemical and aesthetic properties of PMMA resin.
Data availability statement
The raw data supporting the conclusions of this article will be made available by the authors, without undue reservation.
Author contributions
AA: Data curation, Formal Analysis, Investigation, Methodology, Writing–original draft. FK: Conceptualization, Project administration, Supervision, Visualization, Writing–review and editing. SG: Project administration, Supervision, Visualization, Writing–review and editing.
Funding
The author(s) declare that no financial support was received for the research, authorship, and/or publication of this article.
Acknowledgments
The authors would like to thank Soran University for their kind help.
Conflict of interest
The authors declare that the research was conducted in the absence of any commercial or financial relationships that could be construed as a potential conflict of interest.
Publisher’s note
All claims expressed in this article are solely those of the authors and do not necessarily represent those of their affiliated organizations, or those of the publisher, the editors and the reviewers. Any product that may be evaluated in this article, or claim that may be made by its manufacturer, is not guaranteed or endorsed by the publisher.
References
Abdelraouf, R. M., Bayoumi, R. E., and Hamdy, T. M. (2022). Influence of incorporating 5% weight titanium oxide nanoparticles on flexural strength, micro-hardness, surface roughness and water sorption of dental self-cured acrylic resin. Polymers 14 (18), 3767. doi:10.3390/polym14183767
Abdulrazzaq Naji, S., Jafarzadeh Kashi, T. S., Behroozibakhsh, M., Hajizamani, H., and Habibzadeh, S. (2018). Recent advances and future perspectives for reinforcement of poly (methyl methacrylate) denture base materials: a literature review. J. Dent. Biomaterials 5 (1), 490–502.
Abdulridha, W. A. M., Almusawi, R. A. M., Al-Jubouri, O. M., Wally, Z. J., Zidan, S., Haider, J., et al. (2022). Studying the effect of adding Titanium Dioxide (TiO2) nanoparticles on the compressive strength of chemical and heat-activated acrylic denture base resins. Adv. Mater. Process. Technol. 8 (1), 1058–1070. doi:10.1080/2374068X.2020.1838135
Abdulsattar, M. H. (2023). Assessment the mechanical and color changes properties of denture base material after reinforcement with nanoparticles material. Tikrit J. Dent. Sci. 11 (1), 10–16. doi:10.25130/tjds.11.1.2
Ahangaran, F., and Navarchian, A. H. (2020). Recent advances in chemical surface modification of metal oxide nanoparticles with silane coupling agents: a review. Adv. Colloid Interface Sci. 286, 102298. doi:10.1016/j.cis.2020.102298
Aldabbagh, B., Jawad, H., and Mahdi, R. (2021). “Study of the properties of MgO/Poly methyl methacrylate Nano-composites,” in Journal of Physics: Conference Series, Istanbul, Turkey, January 2021, 12039. doi:10.1088/1742-6596/2114/1/012039
Al-Dwairi, Z. N., Al Haj Ebrahim, A. A., and Baba, N. Z. (2023). A comparison of the surface and mechanical properties of 3D printable denture-base resin material and conventional polymethylmethacrylate (PMMA). J. Prosthodont. 32 (1), 40–48. doi:10.1111/jopr.13491
Al-Harbi, F. A., Abdel-Halim, M. S., Gad, M. M., Fouda, S. M., Baba, N. Z., AlRumaih, H. S., et al. (2019). Effect of nanodiamond addition on flexural strength, impact strength, and surface roughness of PMMA denture base. J. Prosthodont. 28 (1), 417–425. doi:10.1111/jopr.12969
Alhotan, A., Yates, J., Zidan, S., Haider, J., and Silikas, N. (2021). Flexural strength and hardness of filler-reinforced PMMA targeted for denture base application. Materials 14 (10), 2659. doi:10.3390/ma14102659
Ali Sabri, B., Satgunam, M., Abreeza, N. M., and Abed, N. (2021). A review on enhancements of PMMA denture base material with different nano-fillers. Cogent Eng. 8 (1), 1875968. doi:10.1080/23311916.2021.1875968
Alqutaibi, A. Y., Baik, A., Almuzaini, S. A., Farghal, A. E., Alnazzawi, A. A., Borzangy, S., et al. (2023). Polymeric denture base materials: a review. Polymers 15 (15), 3258. doi:10.3390/polym15153258
Alsayed, A. F. M., and Aqeel Ashraf, M. (2021). “Synthesis of polymer nanocomposite films,” in Handbook of polymer and ceramic nanotechnology (Berlin, Germany: Springer), 157–176. doi:10.1007/978-3-030-40513-7
Altaee, N. W., and Al-Ali, A. A. (2022). The effects of magnesium oxide nanoparticles addition on flexural strength of cold-cured acrylic resin material. Al-Rafidain Dent. J. 22 (1), 101–112. doi:10.33899/rdenj.2022.129392.1085
Andreotti, A. M., Goiato, M. C., Moreno, A., Nobrega, A. S., Pesqueira, A. A., and dos Santos, D. M. (2014). Influence of nanoparticles on color stability, microhardness, and flexural strength of acrylic resins specific for ocular prosthesis. Int. J. Nanomedicine 9, 5779–5787. doi:10.2147/ijn.s71533
Arf, A. N., Kareem, F. A., and Gul, S. S. (2023). Dispersion and homogeneity of MgO and Ag nanoparticles mixed with polymethylmethacrylate. Polymers 15 (6), 1479. doi:10.3390/polym15061479
Arıkan, A., Ozkan, Y. K., Arda, T., and Akalın, B. (2010). Effect of 180 days of water storage on the transverse strength of acetal resin denture base material. J. Prosthodont. Implant, Esthetic Reconstr. Dent. 19 (1), 47–51. doi:10.1111/j.1532-849x.2009.00495.x
Azmy, E., Al-Kholy, M. R. Z., Al-Thobity, A. M., Gad, M. M., and Helal, M. A. (2022). Comparative effect of incorporation of ZrO 2, TiO 2, and SiO 2 nanoparticles on the strength and surface properties of PMMA denture base material: an in vitro study. Int. J. Biomaterials 2022, 1–10. doi:10.1155/2022/5856545
Bacali, C., Badea, M., Moldovan, M., Sarosi, C., Nastase, V., Baldea, I., et al. (2019). The influence of graphene in improvement of physico-mechanical properties in PMMA denture base resins. Materials 12 (14), 2335. doi:10.3390/ma12142335
Barbur, I., Opris, H., Colosi, H. A., Baciut, M., Opris, D., Cuc, S., et al. (2023). Improving the mechanical properties of orthodontic occlusal splints using nanoparticles: silver and zinc oxide. Biomedicines 11 (7), 1965. doi:10.3390/biomedicines11071965
Boulerba, D., and Zoukel, A. (2021). Poly (methyl methacrylate)/SiO2 nanocomposites: effects of the molecular interaction strength on thermal properties. Polym. Polym. Compos. 29 (9), 49–56. doi:10.1177/0967391120985710
Earar, K., Solomon, O., Topor, G., Constantin, I., Beznea, A., Ciprian, D., et al. (2021). Comparison study on the influence of Al2O3Nanoparticle size and ternary hybrid on several properties of a PMMA denture composite. Mater. Plast. 58 (2), 119–129. doi:10.37358/MP.21.2.5483
Estrada-Monje, A., Zitzumbo-Guzman, R., Banuelos-Diaz, J. A., and Zaragoza-Contreras, E. A. (2019). Ultrasonic dispersion and activation of TiO2 nanoparticles and its effect on bacterial inhibition in EVA films. Mater. Chem. Phys. 235, 121760. doi:10.1016/j.matchemphys.2019.121760
Farina, A. P., Cecchin, D., Soares, R. G., Botelho, A. L., Takahashi, J. M. F. K., Mazzetto, M. O., et al. (2012). Evaluation of Vickers hardness of different types of acrylic denture base resins with and without glass fibre reinforcement. Gerodontology 29 (2), 155–160. doi:10.1111/j.1741-2358.2010.00435.x
Gad, M. M., Abualsaud, R., Alqarawi, F. K., Emam, A. N. M., Khan, S. Q., Akhtar, S., et al. (2021). Translucency of nanoparticle-reinforced PMMA denture base material: an in-vitro comparative study. Dent. Mater. J. 40 (4), 972–978. doi:10.4012/dmj.2020-296
Gad, M. M., Al-Thobity, A. M., Rahoma, A., Abualsaud, R., Al-Harbi, F. A., and Akhtar, S. (2019). Reinforcement of PMMA denture base material with a mixture of ZrO 2 nanoparticles and glass fibers. Int. J. Dent. 2019, 11. doi:10.1155/2019/2489393
Gad, M. M., Fouda, S. M., Al-Harbi, F. A., Näpänkangas, R., and Raustia, A. (2017). PMMA denture base material enhancement: a review of fiber, filler, and nanofiller addition. Int. J. nanomedicine 12, 3801–3812. doi:10.2147/IJN.S130722
Ghaffari, T., Hamedirad, F., and Ezzati, B. (2014). In vitro comparison of compressive and tensile strengths ofacrylic resins reinforced by silver nanoparticles at 2% and0. 2% concentrations. J. Dent. Res. Dent. Clin. Dent. prospects 8 (4), 204–209. doi:10.5681/joddd.2014.037
Ghahremani, L., Shirkavand, S., Akbari, F., and Sabzikari, N. (2017). Tensile strength and impact strength of color modified acrylic resin reinforced with titanium dioxide nanoparticles. J. Clin. Exp. Dent. 9 (5), 661–665. doi:10.4317/jced.53620
Hamad, Q. A., and Kadhim, N. (2019). Study compression, hardness and density properties of PMMA reinforced by natural powder used in denture base applications. Eng. Technol. J. 37 (12), 522–527. doi:10.30684/etj.37.12A.5
Hamedi-Rad, F., Ghaffari, T., Rezaii, F., and Ramazani, A. (2014). Effect of nanosilver on thermal and mechanical properties of acrylic base complete dentures. J. Dent. 11 (5), 495–505. https://www.ncbi.nlm.nih.gov/pmc/articles/PMC4290768/.
Ihab, N. S., and Moudhaffar, M. (2011). Evaluation the effect of modified nano-fillers addition on some properties of heat cured acrylic denture base material. J. Bagh Coll. Dent. 23 (3), 23–29. https://www.iasj.net/iasj/article/1588.
Köroğlu, A., Şahin, O., Kürkçüoğlu, I., Dede, D. Ö., Özdemir, T., and Hazer, B. (2016). Silver nanoparticle incorporation effect on mechanical and thermal properties of denture base acrylic resins. J. Appl. Oral Sci. 24, 590–596. doi:10.1590/1678-775720160185
Kul, E., Aladağ, L. İ., and Yesildal, R. (2016). Evaluation of thermal conductivity and flexural strength properties of poly (methyl methacrylate) denture base material reinforced with different fillers. J. Prosthet. Dent. 116 (5), 803–810. doi:10.1016/j.prosdent.2016.03.006
Mansour, M. M., Wagner, W. C., and Chu, T. G. (2013). Effect of mica reinforcement on the flexural strength and microhardness of polymethyl methacrylate denture resin. J. Prosthodont. Implant, Esthetic Reconstr. Dent. 22 (3), 179–183. doi:10.1111/j.1532-849x.2012.00923.x
Nabhan, A., Taha, M., and Ghazaly, N. M. (2023). Filler loading effect of Al2O3/TiO2 nanoparticles on physical and mechanical characteristics of dental base composite (PMMA). Polym. Test. 117, 107848. doi:10.1016/j.polymertesting.2022.107848
Nandal, S., Ghalaut, P., Shekhawat, H., and Gulati, M. S. (2013). New era in denture base resins: a review. Dent. J. Adv. Stud. 1 (03), 136–143. doi:10.1055/s-0038-1671969
Naznin, H., Mallik, A. K., Hossain, K. S., Shahruzzaman, M., Haque, P., and Rahman, M. M. (2021). Enhancement of thermal and mechanical properties of PMMA composites by incorporating mesoporous micro-silica and GO. Results Mater. 11, 100203. doi:10.1016/j.rinma.2021.100203
Omer, R. A., and Ikram, F. S. (2019). Effect of addition of silver nanoparticles on flexural and impact strength of heat cure acrylic resin. Erbil Dent. J. (EDJ) 2 (2), 243–250. doi:10.15218/edj.2019.16
Oyar, P., Asghari Sana, F., and Durkan, R. (2018). Comparison of mechanical properties of heat-polymerized acrylic resin with silver nanoparticles added at different concentrations and sizes. J. Appl. Polym. Sci. 135 (6), 45807. doi:10.1002/app.45807
Sadeq, J. A., Hussain, R. K., and Majeed, A. M. A. (2023). Study the structural and mechanical properties of HAP-MgO-NPs-PMMA nano-composite. Al-Mustansiriyah J. Sci. 34 (2), 121–128. doi:10.23851/mjs.v34i2.1288
Salman, A. D., Jani, G. H., and Fatalla, A. A. (2017). Comparative study of the effect of incorporating SiO2 nano-particles on properties of poly methyl methacrylate denture bases. Biomed. Pharmacol. J. 10 (3), 1525–1535. doi:10.13005/bpj/1262
Shahabi, M., Movahedi Fazel, S., and Rangrazi, A. (2021). Incorporation of chitosan nanoparticles into a cold-cure orthodontic acrylic resin: effects on mechanical properties. Biomimetics 6 (1), 7. doi:10.3390/biomimetics6010007
Shibata, T., Hamada, N., Kimoto, K., Sawada, T., Sawada, T., Kumada, H., et al. (2007). Antifungal effect of acrylic resin containing apatite-coated TiO2 photocatalyst. Dent. Mater. J. 26 (3), 437–444. doi:10.4012/dmj.26.437
Sodagar, A., Kassaee, M. Z., Akhavan, A., Javadi, N., Arab, S., and Kharazifard, M. J. (2012). Effect of silver nano particles on flexural strength of acrylic resins. J. Prosthodont. Res. 56 (2), 120–124. doi:10.1016/j.jpor.2011.06.002
Somani, M. V., Khandelwal, M., Punia, V., and Sharma, V. (2019). The effect of incorporating various reinforcement materials on flexural strength and impact strength of polymethylmethacrylate: a meta-analysis. J. Indian Prosthodont. Soc. 19 (2), 101–112. doi:10.4103/jips.jips_313_18
Stojanovic, D., Orlovic, A., Markovic, S., Radmilovic, V., Uskokovic, P. S., and Aleksic, R. (2009). Nanosilica/PMMA composites obtained by the modification of silica nanoparticles in a supercritical carbon dioxide–ethanol mixture. J. Mater. Sci. 44, 6223–6232. doi:10.1007/s10853-009-3842-8
Sui, Y., Cui, Y., Meng, X., and Zhou, Q. (2022). Research progress on the correlation between properties of nanoparticles and their dispersion states in polymer matrix. J. Appl. Polym. Sci. 139 (19), 52096. doi:10.1002/app.52096
Sun, J., Wang, L., Wang, J., Li, Y., Zhou, X., Guo, X., et al. (2021). Characterization and evaluation of a novel silver nanoparticles-loaded polymethyl methacrylate denture base: in vitro and in vivo animal study. Dent. Mater. J. 40 (5), 1100–1108. doi:10.4012/dmj.2020-129
Vojdani, M., Bagheri, R., and Khaledi, A. A. R. (2012). Effects of aluminum oxide addition on the flexural strength, surface hardness, and roughness of heat-polymerized acrylic resin. J. Dent. Sci. 7 (3), 238–244. doi:10.1016/j.jds.2012.05.008
Wally, Z. J., Al-Khafagy, M. T., and Al-Musawi, R. M. (2014). The effect of different curing time on the impact strength of cold and hot-cure acrylic resin denture base material. Med. J. Babylon 11 (1), 188–194. https://www.iasj.net/iasj/pdf/bbceee439792640c.
Yeap, S. P. (2018). Permanent agglomerates in powdered nanoparticles: formation and future prospects. Powder Technol. 323, 51–59. doi:10.1016/j.powtec.2017.09.042
Zhang, J. G. (2014). Study on friction and wear behavior of PMMA composites reinforced by HCl-immersed TiO2 particles. J. Thermoplast. Compos. Mater. 27 (5), 603–610. doi:10.1177/0892705712453153
Zidan, S., Silikas, N., Alhotan, A., Haider, J., and Yates, J. (2019). Investigating the mechanical properties of ZrO2-impregnated PMMA nanocomposite for denture-based applications. Materials 12 (8), 1344. doi:10.3390/ma12081344



Add Comment