Basic characteristics of the study participants
A total of 26 ERI and 31 TORI patients were enrolled in this study. According to the r-AFS score, 8 patients were diagnosed with stage I -II EM and 18 patients with stage III- IV EM. In the analysis of microbial abundance and diversity, we divided the samples into three groups: stage III-IV EM (group 1), stage I-II EM (group 2), and TORI group (group 3). The basic characteristics of the patients in each group are shown in Table 1. Mean ages were 31.06 years in group 1, 28.75 years in group 2, and 30.97 years in group 3. There were no significant differences in basic demographic and clinical characteristics including age, infertility category, infertility time, endometrial thickness and visual analogue scale (VAS) between the groups. But the body mass index (BMI) was higher in group 3 and CA125 was higher in group 1.
Comparison of microbial abundance and diversity in PF
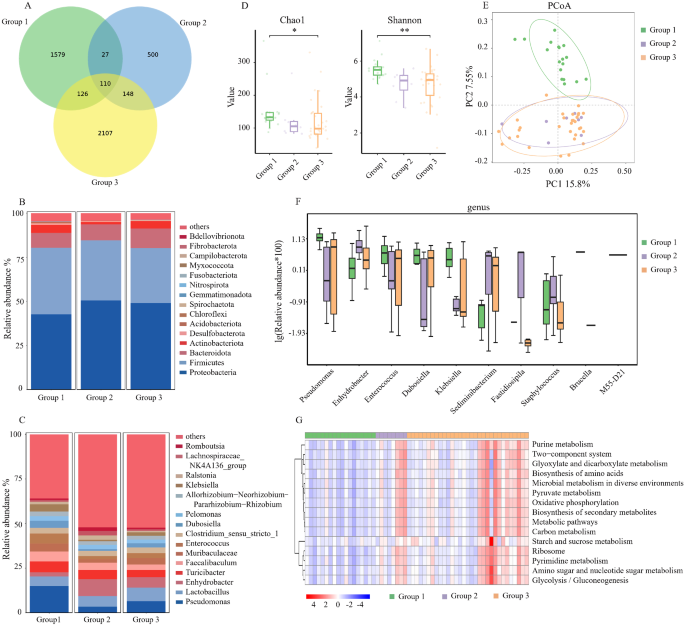
A total of 57 samples of PF were collected (18 cases of group 1, 8 cases of group 2 and 31 cases of group 3). Additionally, 55 cases of UF samples were collected (18 cases of group 1, 8 cases of group 2 and 29 cases of group 3). There were 55 paired PF and UF samples. As a result, 112 samples were subjected to the 16 S rRNA gene amplicon sequencing. Based on pyrosequencing of barcoded 16 S rRNA genes (V4-V5), we evaluated 57 PF samples and acquired 3,831,184 qualified sequences (median = 67,782) and 4597 Amplicon Sequence Variants (ASVs). A Venn diagram was used to identify the 110 out of 4597 ASVs shared by the three groups (Fig. 1A). Proteobacteria and Firmicutes were the dominant phyla in the abdominal cavity, together accounting for more than 75% of the phyla in the PF (Fig. 1B). Figure 1C depicted the top 15 bacterial community compositions at the genus level. The main genera of bacteria include Pseudomonas, Lactobacillus, Enhydrobacter, and Turicibacter. Compared to the other two groups, the abundance of Pseudomonas and Turicibacter experienced an upsurge, while the abundance of Lactobacillus and Enhydrobacter underwent a decline in group 1. The Chao1 and Shannon indices, which describe the richness and diversity of the microbiota, were significantly different among the three groups (Fig. 1D). The results revealed that the alpha diversity differences were mainly observed between Group 1 and Group 3, while no significant differences were found between Group 2 and Group 3. The microbial community structure of Group 1 was different from group 2 and group 3, according to principal co-ordinates analysis (PCoA) based on variance decomposition to represent the variations in composition (Fig. 1E).
Comparison of Microbial Abundance and Diversity in peritoneal fluid. (A). Venn diagram. (B). The barplot of phylum community structure in the three groups (group 1: stage III ~ IV EMs, group 2: stage I ~ II EMs, group 3: TORI). (C) The barplot of genus community structure in the three groups. (D) The Chao1 and Shannon indices. (E) The principal co-ordinates analysis (PCoA). (F) Relative abundance in top-10 species in the three groups was indicated by ANOVA test at the genus level. (G) The gene functional classifications of the top 15 assembled genes in three comparative groups were demonstrated using the KEGG database. EMs: endometriosis, TORI: tubal obstruction-related infertility. ** p < 0.01; * p < 0.05
Then, we performed ANOVA tests to analyze the differences in PF in the three groups at the genus level. Additionally, the top 10 differences in the bacterial community were shown in Fig. 1F. The abundance of Pseudomonas, Enterococcus, Dubosiella and Klebsiella was significantly higher in group 1 compared to the other two groups. Further, based on the KEGG database, the differences in gene functional classifications of assembled unigenes were shown in Fig. 1G. The pathways such as purine metabolism, two-component system, glyoxylate and dicarboxylate metabolism, biosynthesis and amino acids, microbial metabolism in diverse environments and so on were significantly different in these groups (P < 0.01).
Comparison of microbial abundance and diversity in UF
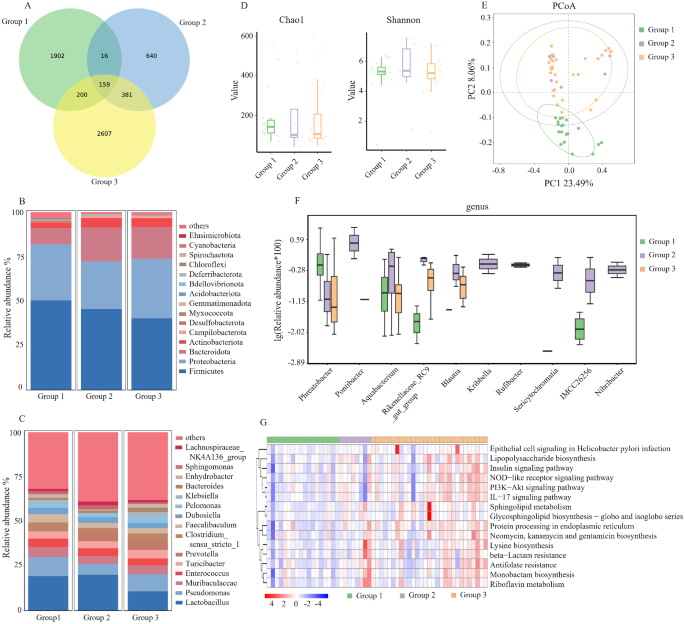
In the analysis of microbial community structure in UF, we also divided the samples into three groups: stage III-IV EM (group 1), stage I-II EM (group 2), and TORI group (group 3). 55 samples were evaluated. And we acquired 198,553 qualified sequences (median = 66,167) and 5905 ASVs. A Venn diagram was used to identify the 159 out of 5905 ASVs shared by the three groups (Fig. 2A). The dominant phyla were Firmicutes, Proteobacteria and Bacteroidota (Fig. 2B). Figure 2C depicted the top 15 bacterial community compositions at the genus level. Different from PF, the genus of intracavitary bacteria had the highest abundance of Lactobacillus. The proportion of lactobacilli was significantly higher in EM patients (19.9%) than TORI patients (10.9%) (Fig. 2C). However, in the analysis of UF microorganisms, there was no significant difference in alpha diversity among the three groups (Fig. 2D). But in the analysis of PCoA, the microbial community structure of Group 1 was different from the other two groups (Fig. 2E). This result was similar to the comparison of microbial community structures in PF.
Comparison of Microbial Abundance and Diversity in uterine fluid. (A) Venn diagram. (B) The barplot of phylum community structure in the three groups (group 1: stage III ~ IV EMs, group 2: stage I ~ II EMs, group 3: TORI). (C) The barplot of genus community structure in the three groups. (D) The Chao1 and Shannon indices. (E) The principal co-ordinates analysis (PCoA). (F) Relative abundance in top-10 species in the three groups was indicated by ANOVA test at the genus level. (G) The gene functional classifications of the top 15 assembled genes in three comparative groups were demonstrated using the KEGG database. EMs: endometriosis, TORI: tubal obstruction-related infertility. ** p < 0.01; * p < 0.05
Then, we conducted a comparison of microbial community structures in the three groups. The top 10 differences in the bacterial community were shown in Fig. 2F. The abundance of Phreatobacter was higher in group 1. The abundance of Pontibacter, Aquabacterium, Rikenellaceae, Blautia, Kribbella, Rufibacter, Sericytochromatia, IMCC26256 and Nibribacter at the genus level was significantly enriched in the EM patients with stage I-II (P < 0.05). Further, based on the KEGG database, the differences in gene functional classifications of assembled unigenes were shown in Fig. 2G. Only the top 15 differences in gene function are shown in the figure. Pathways such as NOD-like receptor signaling pathway, IL-17 signaling pathway, PI3K − Akt signaling pathway, Insulin signaling pathway and so on were different in the three groups (P < 0.05) (Fig. 2G).
The abundance of Pseudomonas and lactobacillus in EM patients of different stages and in patients with different types of infertility
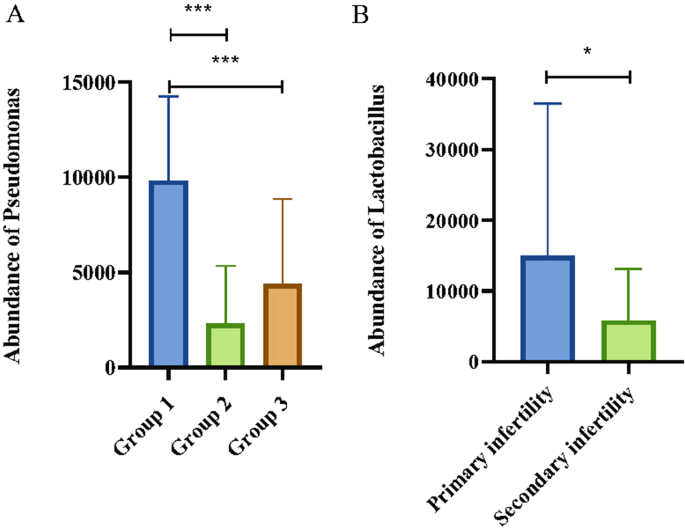
We assessed the relationship between the variations in Pseudomonas and Lactobacillus abundances and the clinical stages of EM as well as associated infertility. A closer examination of the genus in PF revealed that patients suffering from moderate to severe EM exhibit a significant increase in Pseudomonas abundance (Fig. 3A). In contrast, Lactobacillus levels did not differ markedly. Furthermore, no significant correlation was discerned between the stages of endometriosis and the abundance of either Pseudomonas or Lactobacillus in the UF. Subsequent analyses investigating the link between changes in the predominant microbial communities within UF and PF and the categories of infertility identified that Lactobacillus concentrations were comparatively elevated in the uterine cavities of patients with primary infertility compared to those with secondary infertility (Fig. 3B).
Abundance of Pseudomonas and Lactobacillus. (A) The abundance of Pseudomonas in the three groups in PF (group 1: stage III ~ IV EMs, group 2: stage I ~ II EMs, group 3: TORI). (B) The abundance of Lactobacillus in primary and secondary infertility patients in UF. PF: Peritoneal fluid; UF: Uterine fluid. *** p < 0.001; * p < 0.05


Add Comment