De novo assembly of two Chinese local pig breeds
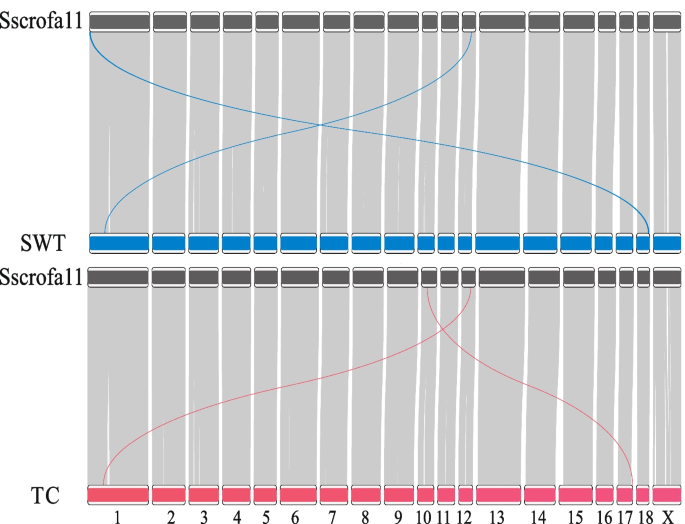
The genomic sequences of two local Chinese pig breeds, Shawutou (SWT) and Tunchang (TC), were obtained with an approximate coverage depth of 36X and 26X, respectively. The two de novo assemblies consisted of 169 and 216 contigs with a contig N50 length of 77.3 Mb and 64.7 Mb, and had 96.15% and 96.36% BUSCO completeness scores respectively (see assembly details in Table 2). Compared with the recently assembled genomes of Ningxiang pig (418 contigs; N50 = 26.1 Mb), Meishan pig (1,430 contigs; N50 = 33.65 Mb), the genomes of TC pig and SWT pig achieve a comparable quality (Fig. S1). The collinearity analysis showed the two de novo genomes have a high collinearity with the reference genome, expect two inter-chromosomal alignments (Fig. 1). An inter-chromosomal alignment with close physical proximity occurred in each genome: A sequence spanning from 41.12 to 41.20 Mb on chromosome 12 of the SWT pig genome, aligns with a region from 75.12 to 75.04 Mb on chromosome 1 of the reference genome. Similarly, in the TC pig genome, a segment from 41.11 to 41.20 Mb on chromosome 12 aligns with a region from 76.16 to 76.07 Mb on chromosome 1 of the reference genome.
Variants discovery from the two novel assemblies
In total, we identified over 15 million variants in the genomes of SWT and TC pigs. Specifically, these variants encompassed 12,367,163 and 12,483,441 SNPs, 3,057,303 and 3,064,290 INDELs, as well as 62,636 and 62,563 structure variants, respectively. The VEP revealed a similar distribution of coding variants in SWT and TC pigs, with approximately 62% are synonymous, 32% are missense and 4% are frameshift mutations. A total of 2,082 and 1,995 genes are affected by deleterious variants for SWT and TC pigs, respectively, with only 1,125 genes were common. The enrichment analysis of affected genes shows that 13 and 12 significant (adjusted P value < 0.05) KEGG pathways were identified for SWT and TC pigs, among which 8 KEGG pathways were common (Table S2). Additionally, a total of 68 significant GO terms were identified for either SWT or TC pigs (Table S2).
Construction of the pig pangenome graph
We constructed the pig graph genome using 21 curated pig assemblies from 20 pig breeds, including 10 Asian domestic breeds, 7 European breeds, 2 crossbreds and 1 African breed (Table 1). First, we anchored the 15 genomes (13 publicly available genomes and 2 genomes assembled in this study) that were not assembled at chromosome level to chromosome, with an average of 96.68% anchoring rates ranging from 95.72% to 97.94% (Table S3). We then estimated the assembly-wise genetic distances using Mash (Table S4) and used them to construct a phylogenetic tree (Fig. S2). We found these pig breeds majorly clustered into three groups: (1) 2 miniature pigs (WZS and EGM); (2) 9 Asian pig breeds, and (3) 8 European pigs, 1 African pig, and the US crossbred USMARC pig.
The Sus scrofa 11.1 was set as the backbone of the graph, with the remaining 20 genomes added incrementally according to their genetic distance to Sus scrofa 11.1. The pig pangenome graph consisted of 999,426 nodes linked by 1,415,311 edges, integrating a total of 2,581,065,767 bases, with 94.35% (2,435,262,063) originating from the reference genome. In comparison to the previously published pig pangenome (552,018 nodes, 664,789 edges and 2,705,225,506 bases) [24], our pangenome contains fewer bases, while featuring a higher count of nodes and edges. The increased number of nodes and edges in our pan-genome can be attributed to the incorporation of a larger number of diverse pig breeds, resulting in increased genetic variants and complexity within the pangenome. Conversely, the reduced number of bases in our pan-genome can be primarily ascribed to our deliberate focus on including only autosomes and sex chromosomes.
Detection of NRSs
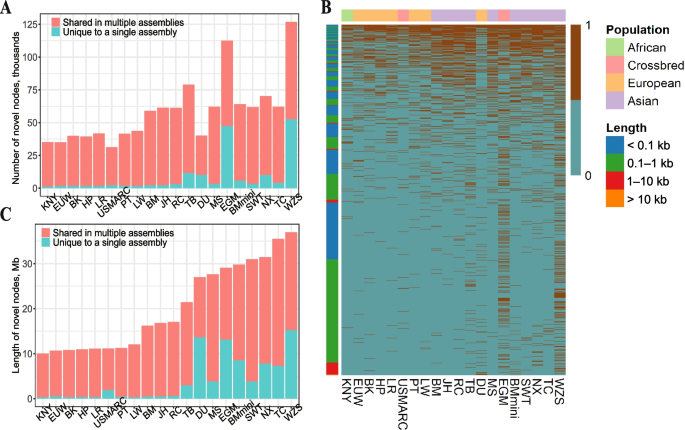
After removing 4,453 skeptical nodes, a total of 348,770 credible non-reference nodes (with a cumulative length of 144 Mb) were identified. Among them, 812 NRNs were present in all 20 non-reference genomes, while 171,660 NRNs were present in only one genome (Table S5). Notably, Eastern pigs possessed a higher number of NRNs (ranging from 59,015 to 126,932) than Western pigs (ranging from 35,048 to 43,690) (Fig. 2A and B). In particular, the miniature pigs (WZS, EGM) exhibited a greater quantity and cumulative length of NRNs in comparison to other pigs. The WZS genome supported the largest number of NRNs (126,932) with a total cumulative length of 30.93 Mb (Fig. 2C). In general, the number of NRNs from a given genome was found to increase as the genetic distance from the reference genome increased. We also attempted to analyze the relationship between gender and NRN lengths. We found that although the average NRN length in boars was greater than in sows, the overall difference was not statistically significant (Fig. S3).
Distribution of non-reference nodes (NRNs). A and B Total length and number of NRNs in specific assemblies or shared by multiple assemblies. C Heatmap of the presence/absence variation (PAV) of NRNs within 20 assemblies, with colored blocks on the left representing different lengths of NRNs and blocks on top representing different pig populations
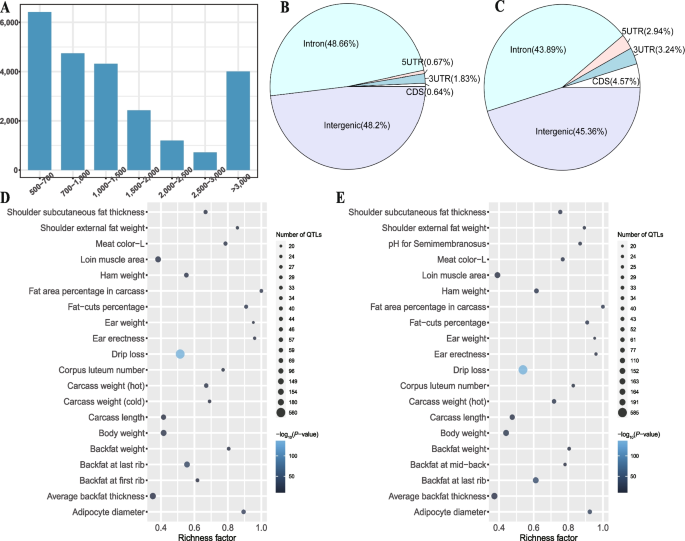
After filtering out redundant NRSs (7,866) and reference-like NRSs (10,231) from the 41,928 raw NRSs, we identified 23,831 high-quality NRSs with a total length of 105.16 Mb (Table S6). The high-quality NRSs had an N50 of 29.97 kb, but only 16.81% of them had a length larger than 3 kb (Fig. 3A). We classified NRSs into 8,060 cNRSs and 15,771 pNRSs according to whether they contained reference nodes. We found that these NRSs evenly distributed across all chromosomes except for the Y chromosome, which has fewer NRS insertion events (Fig. S4). The observed reduction in the number of NRSs on the Y chromosome could be attributed to the limited representation of male samples. Moreover, the majority of NRS insertion events occurred in the genomic region of intergenic (46.27%) and intron (45.42%), and a smaller proportion of them located in CDS regions (0.64% for cNRSs and 4.57% for pNRSs, Fig. 3B and C).
Functional features of NRSs
A total of 35 and 356 unique genes whose CDS regions overlapped with cNRS and pNRS insertions, respectively. The GO enrichment analysis revealed that cNRS-affected genes were not significantly enriched in any GO terms with an adjusted P value ≤ 0.2. In contrast, pNRS-affected genes significantly enriched in five GO terms. Specifically, three biological processes were enriched: antimicrobial humoral response (adjusted P = 0.02), defense response to bacterium (adjusted P = 0.096), and antibacterial humoral response (adjusted P = 0.183). Additionally, two molecular functions were enriched: metallopeptidase activity (adjusted P = 0.138) and olfactory receptor activity (adjusted P = 0.151) (Table S7). The GO enrichment analysis results imply that pNRS insertion events may impact the biological processes and molecular functions of genes related to immunity reinforcement, such as ACP5, PI3, DEFB1, LTF, WFDC2, PR39, SPAI-2, NPG4 and NPG1.
The cNRS and pNRS insertions showed similar overlapping proportions in different economic traits (Fig. S5, S6), the majority of them (approximately 65%) located in genomic regions related to meat and carcass QTLs. A total of 146 and 143 economic traits were significantly enriched for cNRSs and pNRSs (Table S8, S9), and the top enriched QTL was drip loss (Fig. 3D and E).
Discovery of the PAV-NRSs (presence/absence variation of NRSs)
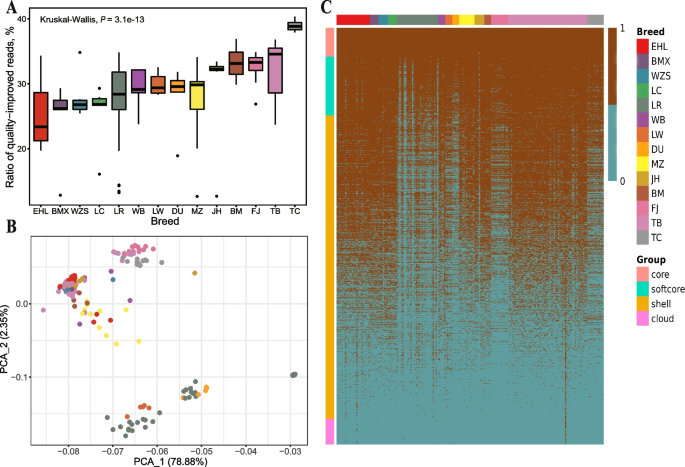
On average, approximately 30% of unmapped and low-quality mapped reads obtained a higher mapping quality (MQ > 10) when mapping to the NRSs (Table S10). The ratios of quality-improved reads varied significantly among different breeds (P = 1.8e-13) and the TC pigs exhibited a notably higher ratio of quality-improved reads (average of 38.94%) compared to other pigs (average of 29.22%) (Fig. 4A). We classified NRSs into five categories based on their presence frequencies. We identified a total of 733 core NRSs, 1,502 softcore NRSs, 7,754 shell NRSs, 659 cloud NRSs and 13,183 skeptical NRSs (Table S11). After removing skeptical NRSs, 10,648 NRSs were used for downstream PAV analysis and gene annotation. The PCA plot (Fig. 4B) showed distinct two clusters representing European pigs (Duroc, Landrace and Large White) and other pigs. As expected, European pigs have a noticeably lower number of NRSs than that of other pig breeds due to their closer genetic distance with reference genome (Fig. 4C).
Identification of the associations between NRSs and pig environmental adaptation
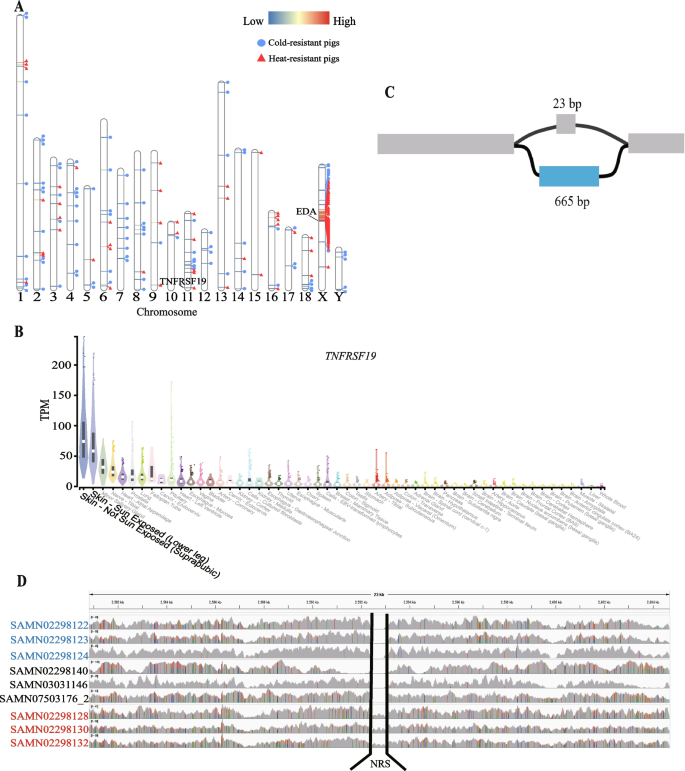
We compared the frequency of NRSs in three comparisons (European pigs vs. Asian pigs, cold-resistant pigs vs. heat-resistant pigs, and high-altitude pigs vs. low-altitude pigs) to explore their potential associations with pig environment adaptation (Table 3 and Table S1). We detected a total of 2,496, 193 and 303 NRSs with significantly different frequencies after Bonferroni correction in these three groups, respectively (Table S12, 13, 14). Moreover, 2,280, 102 and 213 NRSs had significantly higher frequencies in Asian pigs, cold-resistant pigs and high-altitude pigs, respectively (Table 3). Interestingly, in the comparison of cold-resistant pigs vs. heat-resistant pigs, 47 PAV-NRSs with significantly different frequencies are located on an 11.6 Mb region of Chromosome X, spanning from 45,231,666 to 56,875,949. The 47 NRSs have an apparently lower P-value, and most of which have a higher frequency in heat-resistant pigs (Fig. 5A). This region might have experienced strong selection during their adaptation to tropical environments. There are 59 known protein coding genes located in the 11.6 Mb genomic region according to the annotation of the Ensemble BioMart database (version Ensembl Genes 108) (Table S15). KOBAS annotation shows that the 59 protein coding genes are significantly enriched (with adjusted P value < 0.05) in nine GO terms, including basolateral plasma membrane, methylated histone binding, O-acyltransferase activity, lipid metabolic process, gamete generation, nucleoplasm, base-excision repair, endonuclease activity and actin cytoskeleton organization.
Comparison of frequencies of NRSs in cold-resistant pigs and heat-resistant pigs. A Distribution of NRSs with significant high frequencies in cold-resistant pigs and heat-resistant pigs. The horizontal lines in the chromosome represent NRSs, with the red color indicating a higher significant difference of the NRS between cold-resistant pigs and heat-resistant pigs. The blue circles next to the NRS indicate a higher frequency of the NRS in the cold-resistant pigs, while the red triangles indicate a higher frequency of the NRS in the heat-resistant pigs. B Graph structure of a 665 bp NRS in TNFRSF1 that may contribute to the heat tolerance of pigs. C Overexpression of TNFRSF1 in skin in human GTEx data, produced through GTExPortal (https://gtexportal.org/). D Comparison of read coverage on the 665 bp NRS of cold-resistant pigs (Min), heat-resistant pigs (Bamaxiang) and three other pigs (Erhualian, Landrace and Bamei). The sample IDs on the left side of the figure are the BioSample IDs of these sample in NCBI. The sample IDs in red font represent Bamaxiang pigs, while the sample IDs in blue font represent Min pigs. The sample IDs in black font are from other pig breeds
We performed GO enrichment analysis using the genes that overlapped with the significant NRSs. No significant GO term was found for the comparisons of European pigs vs. Asian pigs and high-altitude pigs vs. low-altitude pigs. Genes overlapped with the 91 NRSs, which were more prevalent in heat-resistant pigs, showed significant enrichment in six GO terms related to skin or hair development (hair follicle development, molting cycle process, hair cycle process, molting cycle, hair cycle and skin epidermis development). Specifically, TNF Receptor Superfamily Member 19 (TNFRSF19) and Ectodysplasin A (EDA) genes are involved in all six GO terms. The human GTEx dataset also shows that TNFRSF19 gene is obviously over-expressed in skin (Fig. 5B), implying TNFRSF19 gene may impact the heat-resistance ability of animals through affecting the development of an animal’s skin and fur. However, the EDA gene exhibits no specific expression in any tissue in the human GTEx dataset (Fig. S7). We further examined the graph structure of the TNFRSF19 where the significant NRS occurred. Our investigation revealed that this bubble occurred in the fourth intron of the TNFRSF19 gene, and consisted of two distinct paths: a reference path positioned at chr11:2,592,452–2,592,475, and an NRS path spanning 665 bp (see the partial graph structure of TNFRSF19 in Fig. 5C). This NRS shows significantly different frequency between cold-resistant pigs and heat-resistant pigs (P = 2.08e-6), presents in 5/68 cold-resistant pigs and 16/32 heat-resistant pigs. The five cold-resistant pigs that have the NRS are all Tibetan pigs. After checking the PAV-NRSs of all 192 samples, we found that only these 21 pigs contain the NRS among all 192 pigs. That is to say, except for 5 Tibetan pigs, only 16 (2 Luchuang pigs, 4 Bamaxiang pigs, 8 TC pigs and 2 Wuzhishan pigs) heat-resistant pigs contains this NRS in our PAV analysis. Furthermore, we used minimap2 to align this 665 bp NRS against both our assembled TC pig genome and the reference genome. The results indicated that this sequence could only be successfully aligned to the TC pig genome. To further verify the PAV of this NRS, we generated a modified reference genome by replacing the 26 bp sequences in the original reference genome with the 665 bp NRS and checked the reads coverage of this region. We randomly selected three cold-resistant pigs, three heat-resistant pigs and three other pigs as control (one for each breed of Erhualian, Landrace and Bamei) and then mapped them to the modified reference genome using all their clean reads. Interestingly, only the three heat-resistant pigs’ reads can cover the NRSs embedded in the reference genome (Fig. 5D). Therefore, we strongly speculated that the 665 bp NRS within TNFRSF19 might have a big effect on the heat-resistant ability of southern pigs in China.
Functional annotation of novel predicted genes in NRSs
We conducted repeat annotation for NRSs and found 67.68% (71.20 Mb) of them were repeat sequences (Table S16). The repeat sequences are mainly composed of interspersed repeats (59.70%), including the long interspersed nuclear elements (LINEs, 39.85%), short interspersed nuclear elements (SINEs, 14.17%), Long terminal repeat (LTR, 4.18%), DNA transposons (1.5%). Conversely, the simple repeats and satellites only account for 1.90% and 3.74% of repetitive non-reference bases, respectively.
We predicted a total of 244 high-confident novel genes by removing 3,861 (85.18%) repeat-abundant genes, 314 reference-liked genes (6.93%), and 114 redundant genes (2.51%) from raw 4,533 novel genes predicted in masked NRSs. To verify high-confident predicted novel genes, we examined their expression profile using 145 RNA-seq data. Surprisingly, 88.52% (216 genes) of high-confident novel genes expressed in at least one of the samples. Moreover, 67 of high-confident novel genes expressed in more than 90% of the samples, indicating their potentially important role in the cellular processes, and 68 of them expressed in less than 10% of the samples, implying they were more likely to play role in specific biology functions or be involved in rare or specific biological processes.
We further investigated the functional annotation of high-confident novel genes based on homology alignment by InterProScan, Swissprot and KOBAS tools, and a total of 96, 139 and 133 different entries were annotated by InterProScan, Swissprot and KOBAS respectively (Table S17). The IPR000725 (Olfactory receptor), with 20 annotations, is the most frequently annotated entries in the InterPro database (Fig. S8). We also found that multiple immunity-related entries were annotated, including IPR013106 (Immunoglobulin V-set domain), IPR003597 (Immunoglobulin C1-set), IPR013151 (Immunoglobulin domain). A total of 139 different Swissprot entries in the Swissprot database were annotated by 158 novel genes, among which 75 entries were sourced from human genome. A total of 133 different KEGG entries were annotated by 156 novel genes. Moreover, the KOBAS enrichment analysis revealed high-confident novel genes significantly enriched in 189 terms including 124 GO terms, 24 KEGG pathway terms, 14 KEGG disease terms, and 27 GWAS catalog terms (Table S18). The most significant GO terms are olfactory receptor activity.


Add Comment