


Study site
Up to 88.8% of the malaria cases in the Philippines is due to P. falciparum followed by P. vivax (12.1%). From 2015 to 2019, 92.2–99.0% of malaria cases in the country, repectively, were reported from Palawan alone [7]. Palawan, thus, is a priority province for malaria elimination. In 2019, up to 62.0% of malaria cases were from the municipality of Rizal [26]. Rizal is a first-class municipality with a population of 56,162 and is 230 km south of Puerto Princesa City, the provincial capital of Palawan (Fig. 1). More than 80% of its land is timberland, 15% is agricultural, and the rest is built-up area. Subsistence farming, swidden agriculture, and fishing are the major sources of income for the residents. Almost 40% of the population is below the age of 15, the median age is 20 years, and the male to female ratio is 1.13 [27]. Rizal has 14 barangays (villages). Four, which we will call Barangay A, Barangay B, Barangay C, and Barangay D, where up to 47.2% of malaria cases were observed in 2016 [4], were selected for this study. Because reducing the number of malaria cases in Palawan is a high priority for the Department of Health, each barangay in Rizal has at least one health worker trained to diagnose malaria (by blood film microscopy or a rapid diagnostic test) and treat malaria at the point of contact. Individuals who consult for fever or who have a history of fever are tested for malaria. The Ospital ng Palawan (ONP) is the national referral hospital of the Philippines’ Department of Health and is located more than 200 kms away in Puerto Princesa City.

Study site and the distance to Ospital ng Palawan, the largest tertiary hospital in Palawan
Source documents and data sets used
Maternal records from 2015 to 2019 archived in the Palawan provincial health office (PHO), BHS of barangays A, B, C, and D in Rizal, and Ospital ng Palawan (ONP) were reviewed. Table 1 lists these documents and the variables they contain. The Maternal and Child Health (MCH) program’s forms that were reviewed were the target client list for nutrition and the EPI program for under-fives (TCLNE) and the target client list for pregnant women (TCLP). The barangay health workers (also known as community health workers, or BHWs) are in charge of managing these forms within the BHS. In addition to the variables in Table 1, the TCLNE contains information that tracks the child’s development and immunization. Scanned copies of these were obtained after written permission was secured from the appropriate health authorities. From the PHO, we obtained the malaria electronic data sets for the period under study. Administrative records of all pregnant women between the ages of 15 and 49 who resided in Rizal and who were admitted to the Obstetric Department of ONP for any reason were also used. These documents were the hospital admission logbook, obstetrics and gynecology admission history form and clinical cover sheet. The paper-based target client lists were used to know the outcome of pregnancy for the MiP patients admitted to the ONP and who were admitted for reasons other than the delivery of their baby. The malaria surveillance data and hospital admission log are in electronic form and were the data sets used in the analysis. The source data used for record linkage were first name, last name, birth date, and address as a mutual variable. The following data were used for MiP and non-MiP pregnant patient characteristics: admission date, discharge date, admitting and final diagnosis from the hospital data, and the date of consultation, body weight on admission, and malaria parasite species in the surveillance data.
Record linkage
Patient matching was explored using a probabilistic approach between hospital administrative and surveillance data. A fuzzy string-matching algorithm based on the Levenshtein distance formula (1) was employed [28]. After merging the two data sets using probabilistic record linkage, a unique nine-digit (two string and seven numeric: XX1234567) identification code was applied for further analysis. Patients with missing data such as all parts of the name (i.e., no entry for any of the name parts—first and last name), birthdate, or address were excluded (Fig. 2).
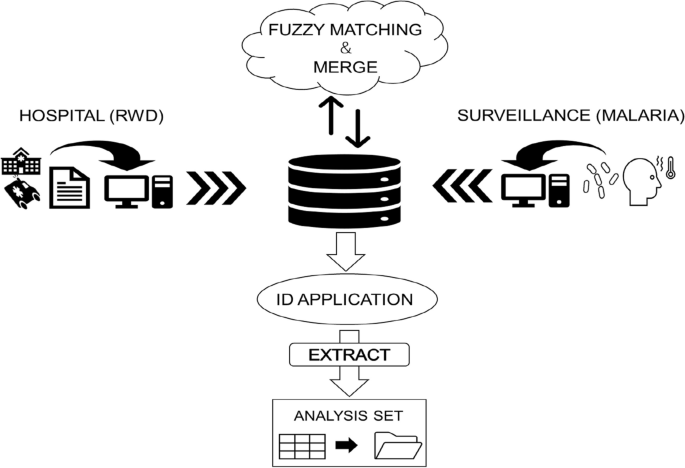
Concept of record linkage using fuzzy-matching for database development
The principle of Levenshtein distance involves two string parameters and yields a numerical score that denotes the similarity between the two strings. This score is determined by calculating the Levenshtein distance (Leva,b) between strings a and b, which represents the minimum number of insertions, deletions, or substitutions necessary to transform one string into the other. The lengths of strings a and b are denoted as i and j, respectively:
$${{\text{Lev}}}_{a,b}\left(i,j\right)= \{\left(i,j\right) \{{{\text{Lev}}}_{a,b}\left(i-1,j\right)+1 {{\text{Lev}}}_{a,b}\left(i,j-1\right)+1 {{\text{Lev}}}_{a,b}\left(i-1,j-1\right)+{1}_{\left({a}_{i}\ne {b}_{j}\right)} \,\, \mathrm{if }\left(i,j\right) =0, \,\,{\text{Otherwise}}.$$
(1)
The foundation of the score between the two strings is normalized between 0 and 100 by dividing the length of the longer string and subtracting the Levenshtein distance from 1 (2). To perform record linkage with fuzzy string matching, a threshold was implemented in necessitating a minimum similarity score for a match to be deemed valid. The highest score within the two strings across the data set was considered a match if it surpassed the threshold ranging from 0 to 100. This formula was used by applying a “Zlookup” function based on the following code provided for free on GitHub: < script src = “https://gist.github.com/andrei-m/982927.js”></script> This function searches for the nearest string from the two data sets, and scores can be obtained between them (Fig. 3). The JavaScript of the fuzzy matching was applied to the extension of Google Sheets for analysis.

Example of the probabilistic record linkage at 70% threshold
$${\mathrm{Lev Score}}_{a, b}=\left(\frac{{1-{\text{lev}}}_{a,b} }{{\text{max}}\left(i,j\right)}\right)100>{\text{Threshold}}$$
(2)
Main analysis
Probabilistic fuzzy matching was conducted by looking up aggregated strings of full names (last name and first name), followed by birthdate (year, month, and day), and address (barangay and sitio) from the hospital and surveillance databases. The score of each variable was calculated using the aforementioned formula, and the overall score was determined by dividing aggregated score with the number of variables. The score from the observed variables was plotted in three dimensions, and the frequency of the overall score was distributed within each patient. The proportion of true positives and false positives was calculated at thresholds ranging from 0 to 100 for both data sets. Three authors conducted the record linkage for validation and confirmation (TK, RB, and SE).
For the descriptive analysis, the background characteristics of the mutual variables used for the record linkage were compared between the non-matched patients from the hospital and surveillance. The mean of the patient’s full name string length and age were examined with 95% confidence intervals, respectively. In addition, the proportion of the four barangays and the registered year were investigated. For non-comparison variables, background characteristics obtained from hospital and surveillance data were described within matched and non-matched patients. From the hospital data, proportions of primigravida, miscarriage, multiple births, gestational weeks, readmission, comorbidities, and mean duration of hospitalization days were examined. From the surveillance data, these were the mean weight/kg, proportion of malaria parasite species (P. falciparum, P. vivax, or mixed), days until re-consultation, and weight change (kg).
Statistical analysis
Data were analyzed in March 2023 and revised in April 2023. The Kolmogorov–Smirnov normality test was used to test if the null hypothesis of the matched scores from each patient distributed a normal distribution overall and for false positive patient scores. Then, the Shapiro–Wilk test was then applied for sensitivity analysis. Pearson’s Chi-square test was applied for comparing proportions, and Mann–Whitney’s U test was applied for comparing the means of the two individual data sets. A two-tailed test was applied to compare the two characteristics, with the criterion for statistical significance established at α = 0.05. P value less than 0.05 suggested that the observed difference between the characteristics was statistically significant. IBM SPSS version 28 was used for the analysis.
Add Comment