Literature review and research selection
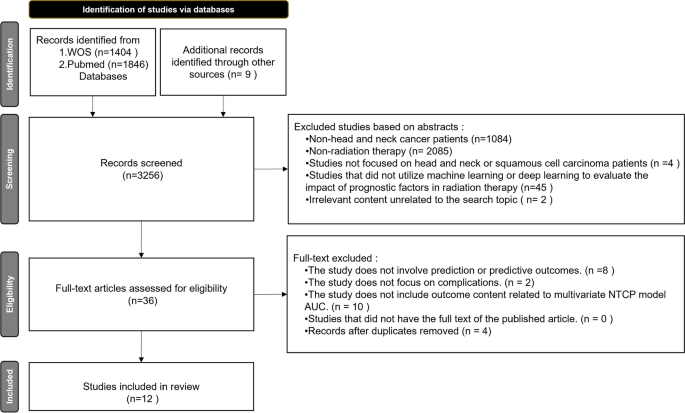
After searching the WOS and PubMed databases, this study initially identified 3,256 potentially relevant articles, as illustrated in Fig. 3. The first round of screening, based on titles, eliminated studies unrelated to head and neck cancer or radiation therapy, leaving 87 articles for the second round. The second round, focused on abstracts, further excluded studies not involving head and neck or squamous cell cancer patients, or those not utilizing machine learning or deep learning as evaluation tools, resulting in 36 articles for full-text review. During this phase, articles not addressing predictions, not focusing on complications, or lacking AUC-related outcomes for multivariate NTCP models were also excluded, along with duplicates. Ultimately, 12 articles were included for review [16,17,18,19,20,21,22,23,24,25,26,27].
Performance of the CNN-NLP model
After comparing nine different optimizers, our study opted for Adamax (see Additional file 1: Table S2). With 50 epochs, Adamax achieved a Loss value of 0.51, an accuracy of 0.85, and an F1-Score of 0.75, along with a precision of 0.71. When the epochs were increased to 100, the accuracy and F1-Score improved to 0.87 and 0.79, respectively, while the precision reached 0.84. At 200 epochs, both accuracy and F1-Score peaked at approximately 0.94, clearly demonstrating the superior performance of the Adamax optimizer in the model.
After optimizer fine-tuning, as shown in Table 1, we evaluated coverage performance, which measures the overlap of identified studies under specific search subset conditions and assesses the efficacy of automated processing. We conducted tests on four different subsets, from WOS T1 to Pubmed T4, and compared the coverage rates when using Adam and Adamax optimizers across training cycles of 200, 100, and 50 epochs. In WOS T1, coverage was generally 0/9 regardless of the optimizer or training cycle, with Adam reaching a peak of 1/7 and low recognition frequency. In Pubmed T2, coverage was mostly 0/7, but a few articles were identified at epochs 100 and 50, not exceeding two in total. In WOS T3, Adam achieved a 3/4 coverage rate at 50 epochs, similar to Adamax. For Pubmed T4, Adam reached a 3/4 coverage rate at 100 epochs, while Adamax showed more stable performance across all training cycles, peaking at 2/4.
In the aspect of words per minute (wpm) for literature review, our study introduces a more objective method for time quantification. Beyond providing a standardized metric for future research, we also employ unit conversion and a deep learning-based Natural Language Text Classifier for temporal comparisons. In Table 2, we also calculated and compared the time spent on alternative tasks, converting wpm results to seconds, the details for the screening speed measured in WPM can be seen in Additional file 1: Table S3. We then contrasted this with the average time needed for text recognition during preprocessing in T1-T4 test sets using an Adamax-optimized CNN-NLP model. As shown in Table 1, despite considerations like text recognition capabilities, the time efficiency gained through NLP shows a significant, intuitive difference. (Code for WPM Calculation Algorithm captured from the monitor is shown in Additional file 1: Figure S1).
Features and model methods: systematic review
As shown in Table 3, the “studies-included” feature table aligns with the three dimensions of the MA issue discussed in our Materials and Methods section. In addition to the authors and publication years, the table also encompasses demographic characteristics, complications, types of radiation therapy techniques, algorithmic combinations in predictive models, predictive performance, and selected predictive factors. The systematic review ultimately included a total of 12 studies [16,17,18,19,20,21,22,23,24,25,26,27].
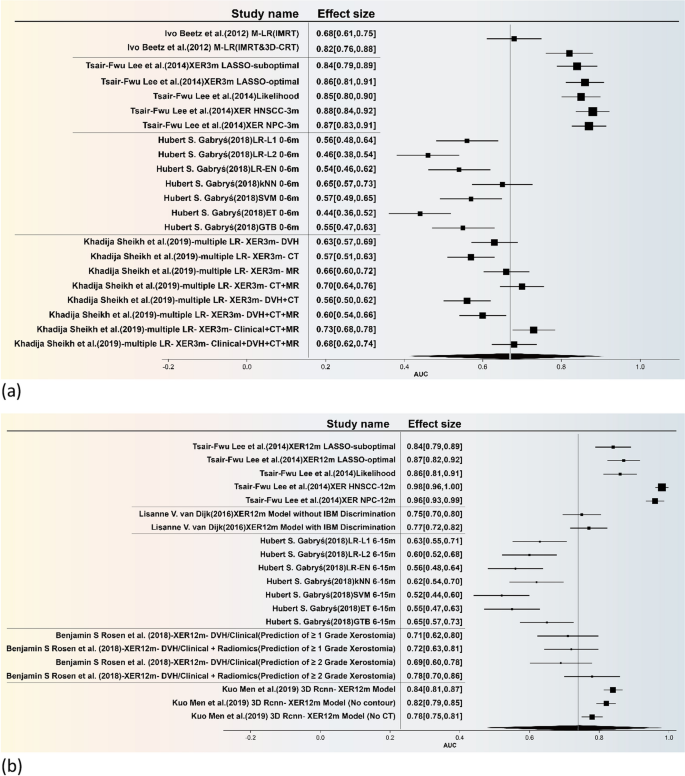
The forest plot is illustrated in Fig. 4, the present study undertakes a comprehensive and rigorous meta-analysis, focusing specifically on predictive models for xerostomia. Utilizing a feature table, we meticulously integrated the models employed across various studies and further stratified them into early and late phases for sub-group analysis. The combined effect sizes for these sub-groups are visually represented through forest plots (The funnel plot is included in Additional file 1: Figure S2). The temporal demarcation for these phases was set at six months, based on the seminal work of Hubert S. Gabryś [16].
Statistically speaking, the overall effect size for the Area Under the Curve (AUC) of early-effect xerostomia models (Fig. 4a) was 0.67, with a 95% Confidence Interval (CI) ranging from 0.40 to 0.91. This indicates that these models possess moderate predictive accuracy for early-effect xerostomia. However, the high heterogeneity, as evidenced by an I2 value of 80.32% and a Q-statistic of 5.34, suggests significant variability across different studies. For late-effect xerostomia (Fig. 4b), the overall AUC effect size was 0.74, with a 95% CI of 0.46 to 0.98. This result further corroborates the models’ relatively high predictive efficacy for late-effect xerostomia. Nevertheless, the exceedingly high heterogeneity (I2 = 97.99%, Q-statistic = 52.48) implies that the applicability of these models may be limited across different research settings or patient populations.
In Table 4, titled “Prediction model Risk of Bias in Included Studies,” the output for each question represents distinct focal points of work, encompassing a comprehensive evaluation of all critical stages in the development and application of prediction models as assessed by PROBAST. The assessment content is divided into four domains: 1. Participants, 2. Predictive Factors, 3. Outcomes, and 4. Analysis. These domains are further categorized based on three assessment outcomes, primarily labeled as “High Risk,” “Low Risk,” and “Unclear or Ambiguous.”
Although the overall assessment reveals that only four studies exhibited low risk of bias in their data, with the remainder falling under high risk or unclear categories, it is noteworthy that in terms of applicability, only two included studies were assessed as having a higher risk, while two were categorized as unclear or ambiguous. This suggests that while there may be a pervasive issue of data bias, the applicability of these studies is less frequently compromised, thereby indicating a need for more rigorous methodological scrutiny to enhance the reliability and utility of future prediction models.


Add Comment