Generation and verification of FAP Nbs
Briefly, purified hFAP Nbs were obtained following a previously reported procedure [19, 41,42,43], and a schematic diagram is shown (Fig. 1A). First, we obtained the first-step PCR products of the VHH-CH2 fragment (a target band of ~ 700 bp) (Additional file 1: Figure S2A), which was then used as a template for the second-step PCR, from which we obtained a ~ 400 bp VHH fragment (Additional file 1: Figure S2B). An immune Nb phage display library was constructed after endonucleases digestion. Then, the VHH genes were cloned into pMECS plasmids and then electrotransferred into E. coli TG1 cells, and the FAP Nb library capacity was 2.25 × 10⁸ CFU/mL (Additional file 1: Figure S2C), which was calculated by counting the number of colonies in gradient dilution plates. The correct insertion rate was estimated by 24 randomly selected after PCR analysis (Additional file 1: Figure S2D). After three rounds of panning, the positive colonies were enriched in FAP-specific Nbs compared to the control colonies (+/−) (Additional file 1: Figure S2E). Ninety-six randomly selected colonies were screened by phage ELISA, and 24 clones were selected as positive (ratio higher than 3) (Additional file 1: Figure S2F). Subsequently, we selected six different amino acid sequences of specific Nbs, and the purified hFAP Nbs showed a target band of ~ 15 kDa by SDS‒PAGE (Fig. 1B). Flow cytometry analysis demonstrated that all selected FAP Nbs bound specifically to FAP-positive target cells (HepG2-FAP and U87), while they did not bind to FAP-negative target cells (HepG2) (Fig. 1C). The SPR analysis results showed that FAP Nbs have good affinity with dissociation constants (KD) of 10−8–10−9 M (Fig. 1D). Therefore, our results showed that the FAP-specific Nbs immune library was successfully constructed, and FAP Nb4 was selected for further research due to its high yield of expression and good affinity.
Construction of the Nb library and screening for hFAP-specific Nbs. A Schematic flow of the general procedure for the preparation of hFAP-specific Nbs. B SDS‒PAGE gel analysis for six hFAP Nbs. C Flow cytometry analysis of hFAP Nbs that strongly bind to FAP+ HepG2-FAP cells and U87 cells but not to FAP− HepG2 cells. D The binding affinity index KD (M) value of hFAP Nbs was measured by SPR analysis
Design, generation and identification of the Nb-TriTE and Nb-BiTE
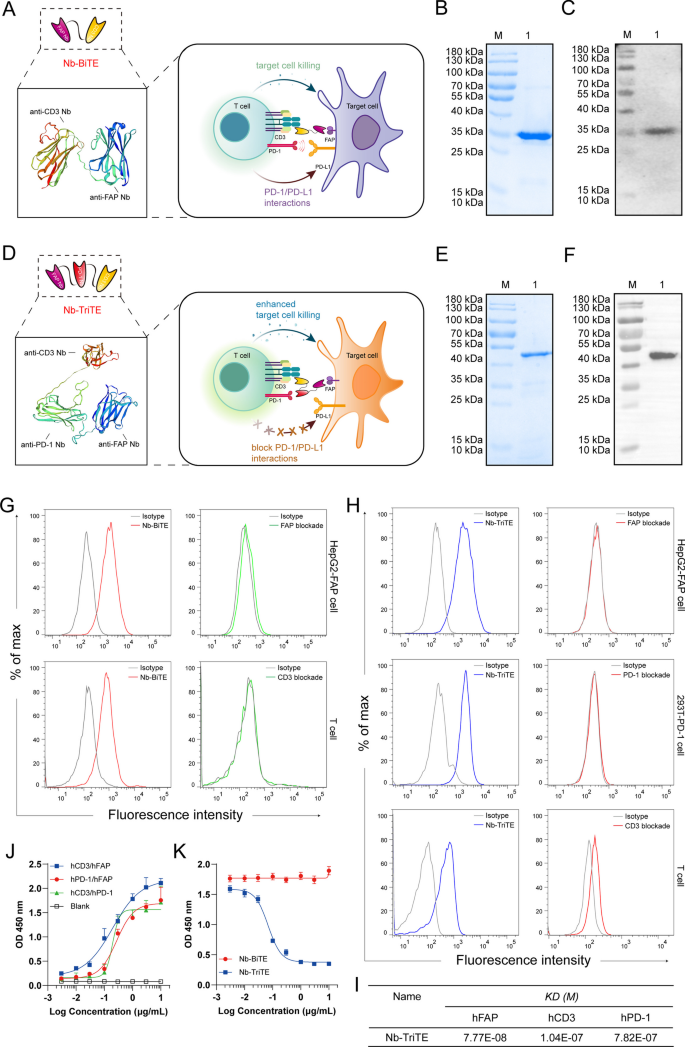
To specifically redirect T cells to FAP+ tumor cells supplied with a T cell-restricted PD-1/PD-L1 blockade, we developed a Nb-TriTE antibody by fusing an anti-PD-1 Nb to a Nb-BiTE molecule targeting FAP with a flexible (Gly4Ser)3 linker. A nontargeting irrelevant Nb-BiTE/TriTE (Irrelevant ctr) was used as a control group. Protein homology modeling of the Nb-TriTE and Nb-BiTE was performed using the SWISS model (https://swissmodel.ExPASy.org) (Fig. 2A, D). In terms of molecular formats, the Nb-TriTE format differs from conventional TriAbs [46] and recently modified TriTEs [47], and the same is true for the Nb-BiTE format (Additional file 1: Figure S1A). A construct of Nb-TriTE was expressed in transformed E. coli BL21 (DE3), and Coomassie-stained SDS‒PAGE showed that 0.5 mM IPTG, 16 °C, and 16 h were the best expression conditions. The Nb-TriTE was then isolated from insoluble inclusion bodies and purified by a Ni2+–NTA column (Additional file 1: Figure S3A–D). Coomassie-stained SDS‒PAGE and SEC analysis showed the purified Nb-BiTE and Nb-TriTE proteins with single bands (> 90% purity) (Fig. 2B, E, Additional file 1: Figure S3E–F). Furthermore, the identity of the purified proteins was verified by Western blot analysis, which confirmed a specific protein band consistent with the molecular weights with predicted molecular weights of ~ 35 kDa and ∼ 50 kDa, respectively (Fig. 2C,F). To determine the optimal configurations of PD-1 Nb and CD3ε Nb in alternative positions of the Nb-TriTE, we evaluated them by cytokine release assays in vitro. T cell stimulation was determined based on the secretion levels of IL-2 and IFN-γ (Additional file 1: Figure S4A–B) in the supernatant after 24 h measured by ELISA. The results showed that proximal-PD-1 Nb × distal- CD3ε Nb was identified as the optimal positioning, and thus, this configuration was then selected for pairing with a FAP Nb in the Nb-TriTE format.
Generation of Nb-TriTE and Nb-BiTE. Schematic drawing of a Nb-BiTE molecule (A), a Nb-TriTE molecule (D) and the protein model for them was proposed by using the SWISS-MODEL website tool. (www.ExPASy.org/resources/swiss-model). The Nb-BiTE molecule consists of a FAP Nb that targets CAFs and a CD3ε Nb that engages T cells. The Nb-TriTE molecule was based on the Nb-BiTE molecule with the addition of a PD-1 Nb that blocks the PD-1/PD-L1 axis. B SDS‒PAGE analysis of purified Nb-BiTE protein was visualized by Coomassie blue staining. Lanes: M- molecular weight marker, 1- Nb-BiTE protein. C Western blot identification of purified Nb-BiTE protein was probed with anti-His-tag antibody, M- molecular weight marker; 1- Nb-BiTE protein. E SDS‒PAGE analysis of purified Nb-TriTE protein was visualized by Coomassie blue staining. Lanes: M- molecular weight marker, 1- Nb-TriTE protein. F Western blot identification of purified Nb-TriTE protein was probed with anti-His-tag antibody, M- molecular weight marker; 1-Nb-TriTE protein. G Binding analysis of Nb-BiTE to FAP-expressing HepG2-FAP cells and CD3-expressing human T cells at a concentration of 2 μg/mL measured by flow cytometry. H Binding analysis of Nb-TriTE to FAP-expressing HepG2-FAP cells, PD-1-expressing 293T-PD-1 cells and CD3-expressing human T cells at a concentration of 2 μg/mL measured by flow cytometry. Blocking assay using recombinant target antigens that substantially interfere with binding ability, representative histograms for each group. I The binding affinity of the Nb-TriTE was determined by SPR analysis. J Nb-TriTE simultaneous binding ability to two target antigens (hCD3ε/hFAP, hPD-1/hFAP and hCD3ε/hPD-1) was assessed by a two-step sandwich ELISA assay. K The effect of Nb-TriTE on blocking PD-1/PD-L1 interaction was assessed by ELISA. All data represent the mean ± standard deviation from 3 independent experiments
Binding properties of the Nb-TriTE and Nb-BiTE
Binding assays were performed to examine the binding of the Nb-TriTE and Nb-BiTE to various target cells by flow cytometry and SPR assay, respectively. Our results demonstrated that the Nb-BiTE can specifically bind to HepG2-FAP and T cells but not to HepG2 cells (Fig. 2G, Additional file 1: Figure S5A-B and S5I). Moreover, the results also showed that the Nb-TriTE specifically bound to HepG2-FAP and 293T-PD-1 cells but not to parental HepG2 or 293T cells (Fig. 2H, Additional file 1: Figure S5C-D and S5J). In addition, the Nb-TriTE was also found to specifically bind to CD3-expressing T cells and Jurkat cells (Fig. 2H, Additional file 1: Figure S5G-H). Importantly, we performed a blocking assay with associated recombinant proteins that interfered with Nb-TriTE and Nb-BiTE binding. We observed that the PD-1 recombinant protein was able to block the binding of Nb-TriTE to 293T-PD-1 cells, and similar results were observed when the FAP or CD3ε recombinant proteins were used in a blocking assay (Fig. 2G, H, Additional file 1: Figure S5A–D and S5G–H). Interestingly, CD3ε blockade was not as efficient compared to PD-1 blockade or CD3ε + PD-1 co-blockade, in which the Nb-TriTE was able to interact with PD-1 molecules on T cells (Additional file 1: Figure S5E, F). Furthermore, we measured the affinity constants of the Nb-TriTE against recombinant hFAP, hPD-1 and hCD3ε antigens by SPR assay, indicating that the KD (M) for Nb-TriTE binding to individual antigens was 10−7 ~ 10−8 M (Fig. 2I). Notably, results showed that Nb-TriTE can simultaneously bind to two target antigens that do not preclude binding of another due to steric hindrance effects (Fig. 2J). In addition, Nb-TriTE can block PD-1/PD-L1 interaction in a dose-dependent manner compared with Nb-BiTE (Fig. 2K). Collectively, these results demonstrated the important biological property of binding specificity of the Nb-TriTE and Nb-BiTE.
Nb-TriTE-mediated T cell activation and proliferation and cytokine secretion
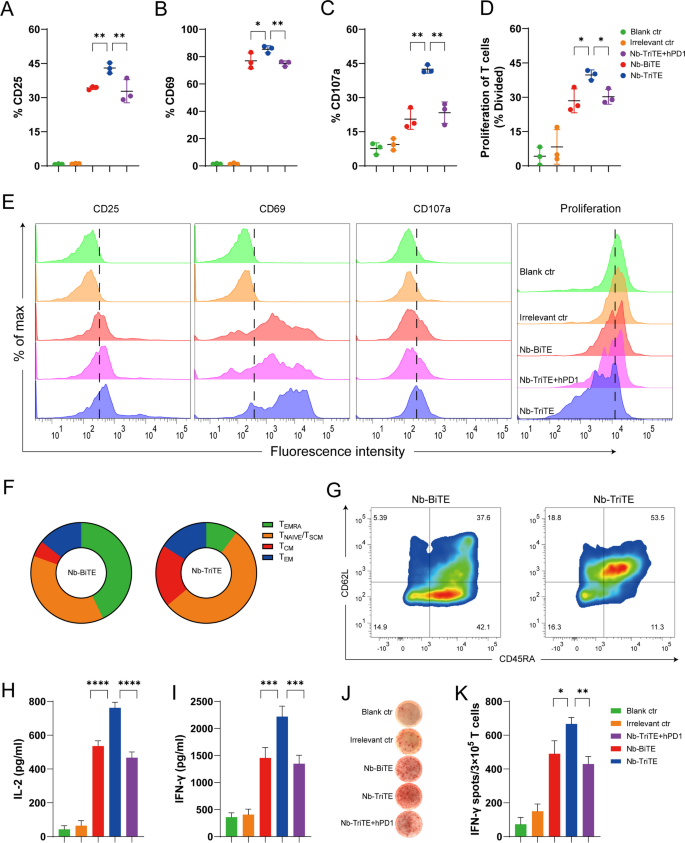
We next investigated the effects of the Nb-TriTE and Nb-BiTE on T cell activation and proliferation and cytokine production. Nb-TriTE- and Nb-BiTE-mediated T cell activation depends on the formation of immunological interaction between T cells and target cells expressing target antigens, and we used the activation markers CD25 and CD69 to assess their ability to activate T cells in vitro. As displayed in Fig. 3, we incubated T cells with the Nb-TriTE and Nb-BiTE in the presence of target HepG2-FAP cells. Strikingly, compared to Nb-BiTE and Nb-TriTE + hPD-1, Nb-TriTE-induced T cells exhibited upregulated surface expression of CD25 and CD69 (Fig. 3A, B). Indeed, the irrelevant control group did not exhibit significant T cell activation. Moreover, the expression level of the degranulation indicator CD107a was higher in the Nb-TriTE-induced group than in the other groups (Fig. 3C). These results confirmed that as expected for Nb-TriTE engagement, the activation signal was prominent, which consequently generated a proper T cell response. Another important hallmark of activated T cells is their proliferative capacity. The ability of the Nb-TriTE to induce the specific proliferation of T cells was evaluated by flow cytometry after 5 days of coculture. T cells underwent multiple rounds of proliferation only when cocultured with Nb-TriTE and mitomycin C-treated, nonproliferating tumor cells together. In FAP+ tumor cells, compared to Nb-BiTE and Nb-TriTE + hPD-1 group, Nb-TriTE group led to significant cell divisions (Fig. 3D). Indeed, T cells cocultured with Irrelevant ctr and the blank control (Blank ctr), showed no T cell proliferation. Representative raw flow cytometry data of CD25, CD69, CD107a and proliferation between groups are shown in Fig. 3E. These analyses indicated that Nb-TriTE can significantly induce T cell-specific activation upon target cell stimulation. We further determined the expression of CD62L and CD45RA to define Nb-TriTE-or Nb-BiTE-induced T cell memory subsets and central memory T cells (TCMs, CD45RA− /CD62L+), which usually have a higher proliferative potential than naive cells, preferentially reside in lymphoid organs, and readily differentiate into effector cells in response to antigens. The results showed that compared to the Nb-BiTE, the Nb-TriTE increased the proportion of TCMs (Fig. 3F, G), suggesting that Nb-TriTE may enhance proliferation and induce a more persistent antitumor response.
Nb-TriTE enhances T cell activation and function compared with Nb-BiTE. Nb-TriTE-induced T cells upregulation of CD25 (A), CD69 (B) and CD107a (C) in comparison with controls as analyzed by flow cytometry in the presence of HepG2-FAP cells at a 2 μg/mL protein concentration after 24 h and an E:T ratio of 10:1. D Proliferation of T cells in response to Nb-TriTE in comparison with other groups was measured by flow cytometry in the presence of HepG2-FAP cells after 5 days and an E:T ratio of 10:1, shown as a percentage divided. E Representative histograms of CD25, CD69, and CD107a expression and proliferation indices are shown for each group. F–G Subpopulation analysis based on CD62L and CD45RA expression induced by the Nb-TriTE or Nb-BiTE after 14 days. CD45RA−CD62L−cells represent effector memory T (TEM) cells, CD45RA−CD62L+cells represent central memory T (TCM) cells, and CD45RA+CD62L+cells represent naive T cells. Pie chart for CD62L/D45RA expression (left). (H-I) Levels of IL-2 and IFN-γ secretion in the presence of HepG2-FAP cells upon addition of Nb-TriTE, Nb-BiTE or Irrelevant ctr and Nb-TriTE + hPD-1 at equimolar concentrations. (J-K) An ELISPOT assay was performed to measure the IFN-γ response of specific T cells for each group. All data represent the mean ± standard deviation from 3 independent experiments
Proinflammatory cytokines are mainly secreted by activated T cells and are involved in T cell cytotoxicity for tumor suppression. We also measured the secretion of IL-2, IFN-γ, GzmB and PRF1 after incubation with target cells upon T cell activation by Nb-TriTE and Nb-BiTE. As shown in Fig. 3H, I, Nb-TriTE induced higher secretion levels of IL-2 and IFN-γ than Nb-BiTE, Nb-TriTE + hPD-1 or control groups in the presence of FAP+ target cells. However, Nb-BiTE induced similar cytokine levels to those induced by Nb-TriTE + hPD-1, whereas the equimolar addition of control groups results in lower IL-2 and IFN-γ levels. Similar results were obtained by measuring IFN-γ production in ELISPOT assays (Fig. 3J, K). We also tested the levels of proinflammatory cytokines by ELISA and ELISPOT IFN-γ production after incubation with FAP− HepG2 tumor cells, and no significant changes in IL-2 or IFN-γ secretion (Additional file 1: Figure S6A, B) or the IFN-γ response (Additional file 1: Figure S6C, D) were observed. In addition, compared to Nb-BiTE or control group, Nb-TriTE induced higher GzmB and PRF1 secretion levels after incubation with FAP+ tumor cells, but no significant changes in FAP− HepG2 tumor cells (Additional file 1: Figure S6E, F). Therefore, these findings demonstrated that our Nb-TriTE is directly more effective in mediating T cell activation and proliferation. We hypothesize that this effect is likely due to PD-1/PD-L1 checkpoint blockade by the Nb-TriTE and that antigen-specificity is a key factor mediating this activity.
Nb-TriTE-mediated cytotoxicity to FAP-positive tumor cells in vitro
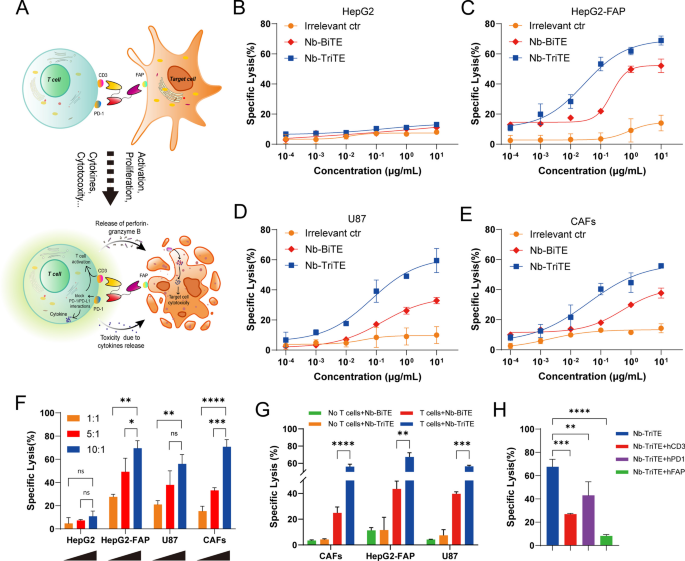
We investigated the ability of Nb-TriTE to induce antigen-specific cytotoxicity in vitro and postulated that the increased cytotoxicity of Nb-TriTE leads to an enhanced antitumor response through PD-1/PD-L1 checkpoint blockade (Fig. 4A). Firstly, tumor cells and tumor tissues were tested for FAP and PD-L1 expression by flow cytometry and public datasets showed that their variable expression levels (Additional file 1: Figure S10A–F). After T cells were cocultured with target cells at an E:T ratio of 10:1 in the presence of different concentrations of purified Nb-TriTE, Nb-BiTE or Irrelevant ctr, results showed that the Nb-TriTE efficiently induced T cell cytotoxicity against HepG2-FAP target cells with EC50 values of 0.63 nM compared to the Nb-BiTE (EC50 7.5 nM) (Fig. 4C), but it was inactive against the FAP− cell line HepG2, which was strictly antigen-specific and in a dose-dependent manner (Fig. 4B). Similarly, the Nb-TriTE also redirected the cytotoxicity of T cells toward other human FAP-expressing tumor cells compared with Nb-BiTE, including U87 cells (EC50 1.5 nM vs. 5.19 nM) (Fig. 4D) and primary CAFs (EC50 0.85 nM vs. 17.48 nM) (Fig. 4E). Consistent with the previous characterization, compared to the Nb-BiTE, the Nb-TriTE significantly enhanced target cell lysis. However, no obvious target cell lysis was observed upon incubation with an Irrelevant ctr.
Nb-TriTE enhances the specific lysis of FAP-expressing target cells by T cells in vitro. A Schematic diagram of enhanced tumor-specific cytotoxic T cells induced by Nb-TriTE due to PD-1 blockade. B–E Dose-dependent lysis of HepG2 versus HepG2-FAP cells, U87 cells and primary CAF cells by unstimulated T cells varies proportionally with Nb-TriTE concentration (E:T ratio 10:1; incubation time, 16 h). F Nb-TriTE-induced cytotoxicity assays of target HepG2, HepG2-FAP, U87 and CAF cells were carried out at E:T ratios of 1:1, 5:1, and 10:1 for 16 h. G Cytotoxicity assays of target HepG2-FAP, U87 and CAF cells in the presence of Nb-BiTE and Nb-TriTE or Nb-BiTE (no T cells) and Nb-TriTE (no T cells) were carried out at E:T ratios of 10:1 for 16 h. H Cytotoxic lysis of HepG2-FAP in the presence of Nb-TriTE and T cells at a concentration of 2 μg/mL at an E:T ratio of 10:1 after 16 h, which is significantly interfered in the presence of hCD3ε, hPD-1 and hFAP blockade, respectively
Our results also showed the E:T ratio-dependent FAP+ cell killing activity of the Nb-TriTE, which significantly induced the lysis of FAP+ target lines (HepG2-FAP, U87 and CAFs). In contrast, no enhanced killing effects on FAP− target HepG2 cells were observed, which demonstrated that the Nb-TriTE-induced T cell killing effect was target cell-specific and E:T ratio-dependent (Fig. 4F). As expected, none of the molecules induced cytotoxic effects without T cells, whereas the Nb-TriTE exhibited a significantly better killing performance in the presence of T cells compared to Nb-BiTE, underscoring that the killing was indeed Nb-TriTE-induced T cells dependent (Fig. 4G). To further investigate whether the possibility of Nb-TriTE either a “cis”-cross-linking event on the T cell surface or a “trans”- interaction between the T cell and the target cell, we generated additional control reagents (Nb-TriTE + hFAP, Nb-TriTE + hPD-1 and Nb-TriTE + hCD3), these data indicate that Nb-TriTE has better in vitro activity for enhancing T cell activity in a trans cell-dependent manner (Fig. 4H), Taken together, we conclude that Nb-TriTE-mediated cytotoxicity is against FAP+ target cells and efficiently counteract PD-1-mediated resistance mechanisms and induce the specific lysis of target cells through the synergy of PD-1/PD-L1 checkpoint blockade.
In vivo antitumor efficacy of the Nb-TriTE in mouse xenograft models
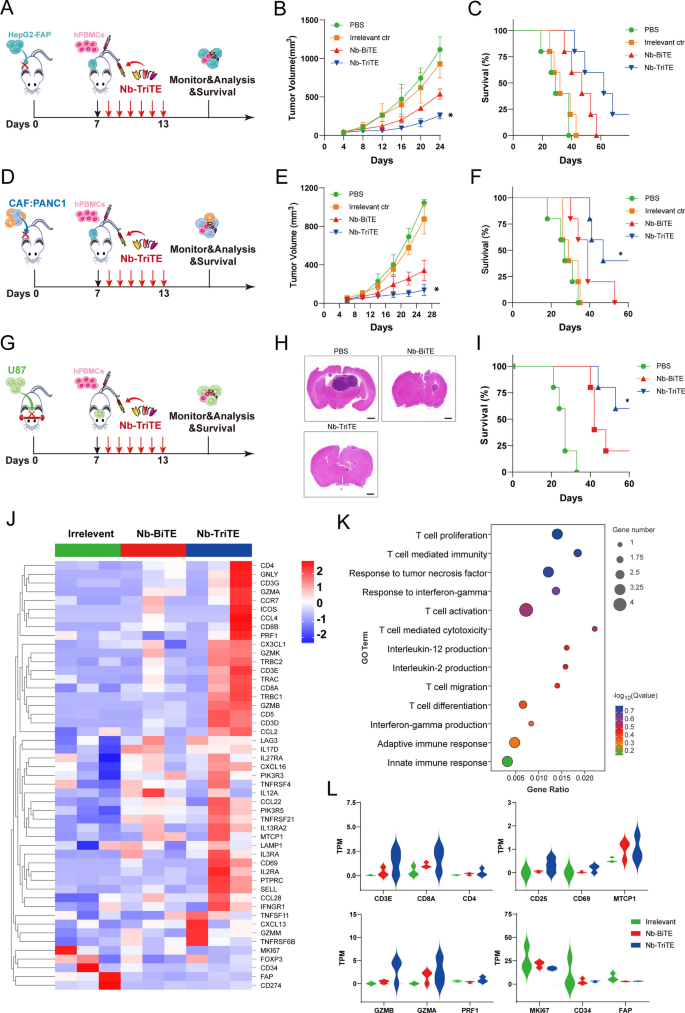
We then examined the therapeutic efficacy of the Nb-TriTE in vivo. We first established CDX models with cancer types that express FAP: HepG2-FAP cells and a mixture of CAFs and PANC1 cells. On day 0, 1 × 10⁶ tumor cells in 100 μL PBS were subcutaneously injected per tumor, and tumor-bearing mice were randomized into treatment groups and administered via tail vein injection with 1 × 10⁷ expanded T cells derived from PBMCs on day 7. After administration, mice were intravenously injected with the Nb-TriTE, Nb-BiTE, Irrelevant ctr, or PBS daily for 6 days (Fig. 5 A, D). As shown in Fig. 5B, E, the data showed that the tumor growth curves of the PBS and Irrelevant ctr groups were steeper than those of the Nb-TriTE and Nb-BiTE groups, which indicated the highest efficacy of Nb-TriTE in inhibiting tumor growth, and this treatment also resulted in significant improvements in overall survival rates (Fig. 5 C, F). Moreover, the orthotopic glioma CDX model was established by the intracranial implantation of U87 cells (Fig. 5G), and the Nb-TriTE-treated mice had smaller intracranial tumor sizes and improved survival rate (Fig. 5H, I) compare to those in the Nb-BiTE and PBS group, providing evidence for the therapeutic benefit of the Nb-TriTE in preclinical models. No significant differences in body weight were observed with any of the treatments in the three CDX models (Additional file 1: Figure S7A–C). Line graph depicting tumor volume in HepG2-FAP and CAFs: PANC1 tumor-bearing mice (Additional file 1: Figure S7E, F). Therefore, the Nb-TriTE is effective in inhibiting in vivo tumor growth and improving survival in mice. We further confirmed that Nb-TriTE has greater tissue penetration than conventional TriAbs, longer survival time and IHC staining analysis showed that Nb-TriTE is indeed more deeply distributed within tumor tissue compared with conventional TriAbs (Additional file 1: Figure S8A–C).
Nb-TriTE treatment enhances antitumor efficacy in multiple cancer types. A Schematic representation of the experimental timeline. NOD/SCID mice (n = 5 per group) were subcutaneously implanted with 1 × 10⁶ HepG2-FAP tumor cells on day 0, intravenously injected with human PBMCs at a ratio of 1:10 on day 7, and then treated with the Nb-TriTE or the indicated antibodies (20 μg) by daily intravenous infusion for a total of 6 doses. B Tumor volume growth curves. C Kaplan‒Meier survival curves. D Schematic experimental design of CAFs: PANC1 tumor xenograft studies. E Tumor volumes, F Survival curves of CAFs: PANC1 tumors in NOD/SCID mice treated with the indicated antibodies by daily intravenous infusion (n = 5 per group) G Operational diagram of the animal experiment, H HE staining of brain, I Survival curves of U87 tumors in NOD/SCID mice treated with the indicated antibodies by daily intravenous infusion. J Heatmap showed the expression levels of candidate genes in tumor tissues from Irrelevant ctr-treated mice, Nb-BiTE-treated mice or Nb-TriTE-treated mice. K GO enrichment analysis of genes in tumor tissues from Nb-BiTE-treated versus Nb-TriTE-treated mice. L TPM was used for relative assessment of gene expression levels, such as T cell activation, proliferation and T cell cytotoxicity-associated genes (n = 3 independent biological samples)
To further assess the ability of the Nb-TriTE to promote immune cell efficacy, RNA-seq from on the CAFs: PANC1 tumor tissues from the Nb-TriTE treatment group were performed to map the genomic landscape (Fig. 5J), and DEGs associated with the Nb-TriTE group were identified. Moreover, Gene Ontology (GO) enrichment analysis comparing the DEGs between the Nb-BiTE and Nb-TriTE treatment groups revealed that the DEGs associated with Nb-TriTE group were enriched in T cell proliferation and activation, T cell mediated immunity and cytotoxicity, and immune response-associated proinflammatory cytokines TNF, IFN-γ and IL-2 (Fig. 5K). GO enrichment analysis of the DEGs between the Nb-TriTE and control group, the Nb-BiTE and control group (Additional file 1: Figure S9A, B) were also depicted. Furthermore, gene signature analysis revealed that T cell activation, proliferation and cytotoxicity-related key genes in the Nb-TriTE group were upregulated compared with those in the Nb-BiTE and control group (Fig. 5L). For example, T cell types (CD3E, CD8A, CD4), T cell activation genes (CD25, CD69) and proliferation genes (MTCP1), and T cell cytotoxic effector molecules (GzmB, GzmA, PRF1). However, tumor-related genes (MKI67, CD34) and CAFs (FAP) were downregulated in the Nb-TriTE group compared with the other groups. Therefore, the Nb-TriTE is effective in inhibiting in vivo tumor growth and improving survival in mice by enhancing T cell activation and cytotoxicity.
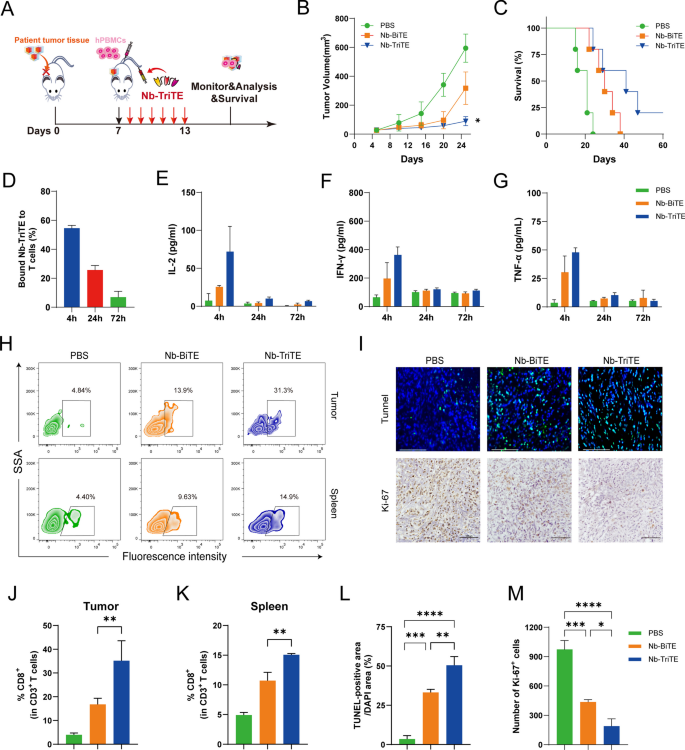
To better mimic the environment of tumor progression in vivo, a PDX model was established using patient liver cancer tissue (Fig. 6A). FAP and PD-L1 expression in PDX tumors was measured by flow cytometry showed that their high expression (Additional file 1: Figure S7H). In the liver cancer PDX model, we observed an inhibition of tumor growth and longer survival time in mice after daily Nb-TriTE administration compared to their counterparts receiving Nb-BiTE or PBS treatment (Fig. 6B, C). Neither mouse model showed obvious body weight changes before or after the treatment (Additional file 1: Figure S7D). The line graph depicts the tumor volume in the PDX model (Additional file 1: Figure S7G). Analysis of Nb-TriTE binding to the T cells from the animals showed a moderate percentage bound to T cells within 24 h (Fig. 6D). We also found that the dynamic serum levels of IL-2, IFN-γ and TNF-α in the Nb-TriTE-treated NOD/SCID mice showed a transient upregulation (Fig. 6E–G). To further assess the ability of the Nb-TriTE to promote immune cell infiltration. Compared to Nb-BiTE- and PBS-treated mice, Nb-TriTE-treated mice had an increased number of human CD3+ CD8+ T cells in the tumor and spleen after treatment (Fig. 6 H, J, K). We also analyzed the content of T cells in peripheral blood by flow cytometry. The percentage rate of CD3+ T cells was significantly higher in Nb-TriTE-treated mice within 2 weeks after injection (Additional file 1: Figure S7I, J). We then performed TUNEL staining and Ki67 IHC staining of tumor tissues from different groups (Fig. 6I). Interestingly, the Nb-TriTE-treated group exhibited a reduced number of Ki67-positive cells and an increased number of cells undergoing apoptosis according to TUNEL staining compared to those in Nb-BiTE and PBS groups (Fig. 6L, M). Overall, the PDX model experiment showed that the Nb-TriTE could be an effective strategy to treat cancer. Altogether, these results demonstrated that this novel Nb-TriTE format offers a favorable therapeutic platform and exert enhanced therapeutic effects.
Nb-TriTE treatment effectively inhibits the growth of PDX tumors. A Schematic experimental design of the PDX tumor model studies. Tumor growth (B), and survival curves (C) in PDX models (n = 5 per group) treated daily with either Nb-TriTE or Nb-BiTE for 6 consecutive days. D The dynamic changes in the proportion of T cells bound to Nb-TriTE within 72 h after treatment. E–G The levels of IL-2 (E), IFN-γ (F) and TNF-α (G) after treatment with the Nb-TriTE or Nb-BiTE. CD3+ CD8+ T cell infiltration in the tumor tissues and spleen based on flow cytometry analysis, representative flow cytometry density plots (H) and statistical bar chart (J, K). TUNEL and Ki67 staining of tumor tissues. Representative images (I) and statistical bar chart (L, M). TUNEL staining of tumor tissues. Scale bars, 125 μm; Ki67 IHC of tumor tissues. Scale bars, 100 μm. (n = 3 per group)
Safety profile of the Nb-TriTE
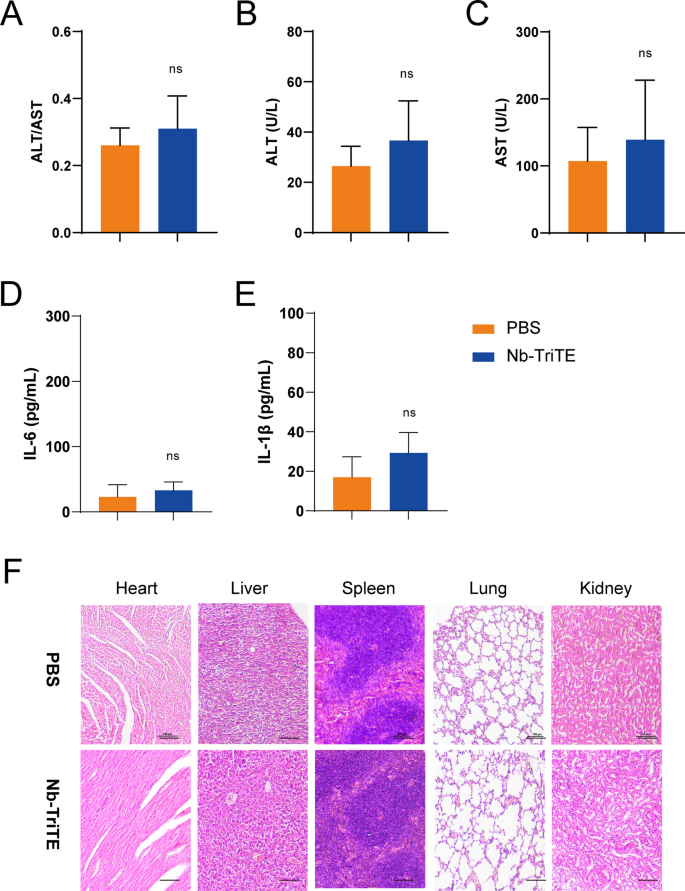
We then determined the safety profile of the Nb-TriTE. Despite the absence of any signs of discomfort or toxicity in the mice, we analyzed the major organs (heart, liver, spleen, lung, kidney) for cytopathy by HE staining, and no obvious lesions or organic injuries were present in the Nb-TriTE group compared to the PBS group (Fig. 7F). Moreover, there was no significant increase in the ALT or AST levels or the ratio of ALT/AST in the blood of mice treated with the Nb-TriTE (Fig. 7A–C). In addition, there were no significant differences in the IL-6 (Fig. 7D) and IL-1β (Fig. 7E) levels in the Nb-TriTE group compared with the PBS group, indicating that Nb-TriTE has a manageable safety profile in mice. In summary, these findings demonstrated that the Nb-TriTE is safe to use and support further clinical development.
The preliminary safety profile of the Nb-TriTE. ALT/AST ratios (A) and ALT (B) and AST (C) levels in the experiment. The levels of IL-6 (D) and IL-1β (E) after treatment. F Representative HE staining of the major organs (heart, liver, spleen, lung, kidney) of mice after different treatments. Scale bar, 100 μm. No obvious histological difference was observed after Nb-TriTE treatment


Add Comment