Identification of Differentially Expressed Genes (DEGs) between RF-Negative pJIA, oJIA, and control
We analyzed the DEGs between children with RF-negative pJIA, oJIA, and healthy individuals using the “limma” package. A total of 1438 DEGs were identified, with 355 upregulated and 1083 downregulated genes in pJIA (Fig. 1A). Similarly, in oJIA, we found 688 DEGs, including 282 upregulated and 406 downregulated genes (Fig. 1B).
Functional enrichment analysis
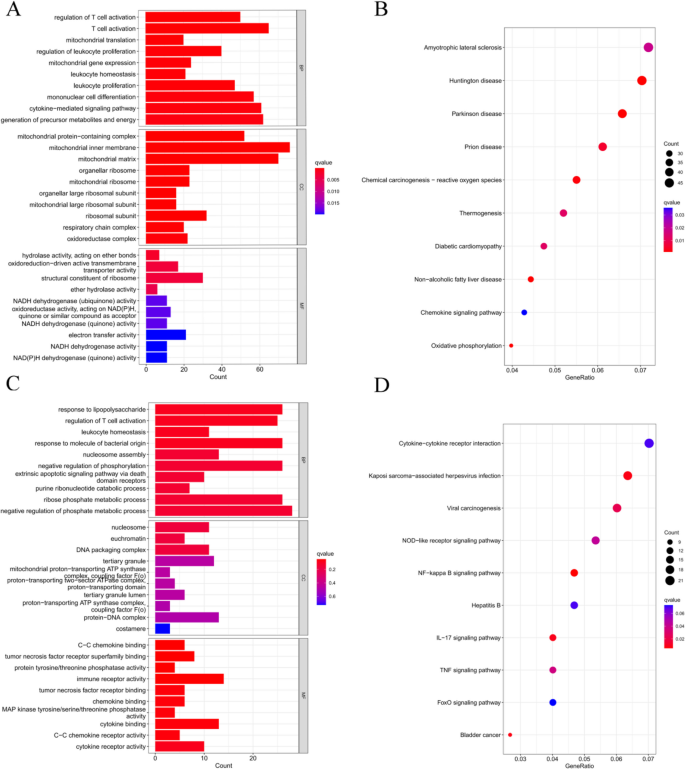
Functional enrichment analysis based on Gene Ontology (GO) and Kyoto Encyclopedia of Genes and Genomes (KEGG) was performed to understand the cellular mechanisms underlying RF-negative polyarticular juvenile idiopathic arthritis (pJIA) and oligoarticular juvenile idiopathic arthritis (oJIA). RF-negative pJIA was associated with key functions such as T-cell activation, leukocyte proliferation, mononuclear cell differentiation, and the chemokine signaling pathway (Fig. 2A, B). In oJIA, functions related to T-cell activation, leukocyte homeostasis, and the NF-kappa B, IL-17, and TNF signaling pathways were regulated (Fig. 2A, B). These functions play a role in adaptive immunity.
Functional enrichment analysis of DEGs. A The top 10 functional enrichment in BP, CC, and MF analysis between RF-negative pJIA and healthy individuals. B The KEGG analysis of DEGs between RF-negative pJIA and healthy individuals. C The top 10 functional enrichment in BP, CC, and MF analysis between oJIA and healthy individuals. D The KEGG analysis of DEGs between oJIA and healthy individuals
Construction of the weighted gene co-expression network
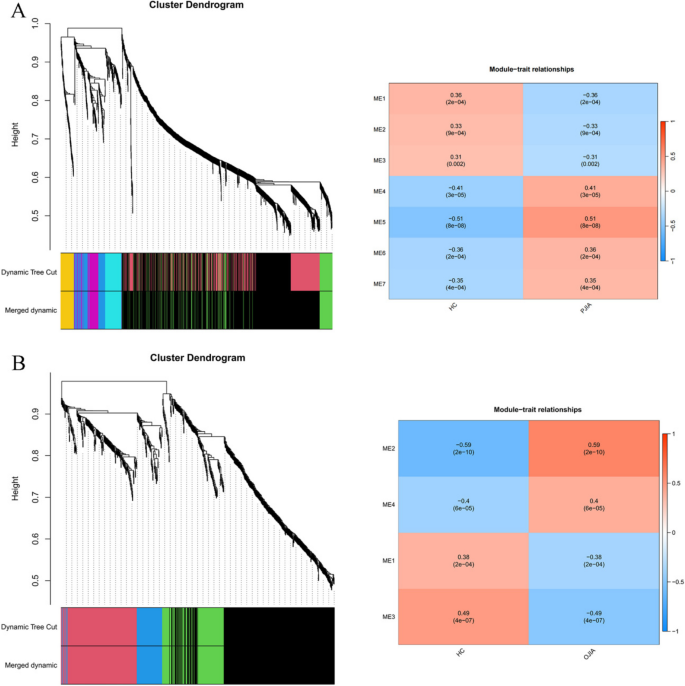
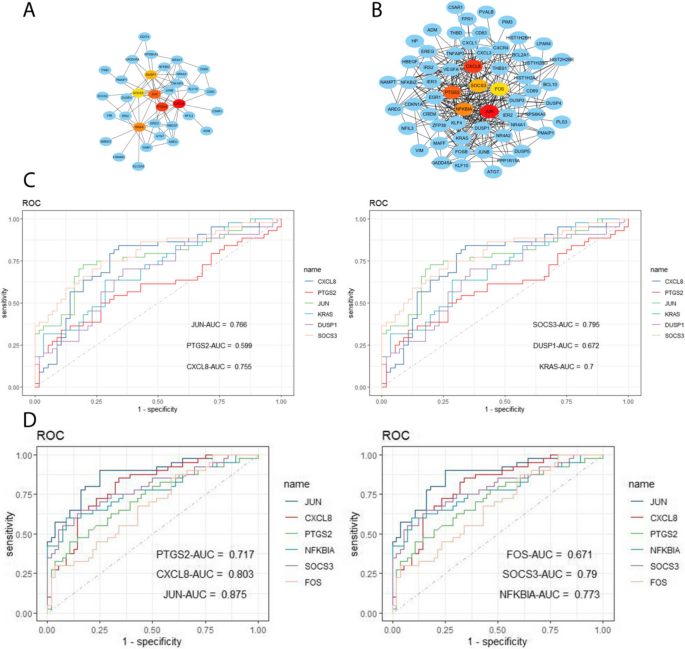
Using the WGCNA package in R software, we conducted a comprehensive analysis of RF-negative pJIA, oJIA, and healthy individuals. The initial co-expression network was established with a soft threshold power of 6, meeting the scale-free index of 0.8 and a favorable mean connectivity. The resulting cluster dendrogram (Fig. 3) revealed the formation of 6 modules in RF-negative pJIA. Among them, the ME5 module showed a significant correlation (cor = 0.51, p < 0.001) with RF-negative pJIA, indicating its importance in the disease’s pathogenesis. The PPI network constructed using Cytoscape software identified six hub genes, namely CXCL8, PTGS2, JUN, KRAS, DUSP1, and SOCS3, out of 87 analyzed genes (Fig. 4A).
Hub gene identification and diagnosis prediction analysis. A Networks of the six hub genes identified by “cytoHubba” between RF-negative pJIA and healthy individuals. The yellow-to-red color scale denotes the p-value calculated by the MCC method. B Networks of the six hub genes identified by “cytoHubba” between oJIA and healthy individuals. The yellow-to-red color scale denotes the p-value calculated by the MCC method. C Diagnostic utility of the six hub genes in the GSE20307 datasets between RF-negative PJIA and healthy individuals. D Diagnostic utility of the six hub genes in the GSE20307 datasets between oJIA and healthy individuals
Similarly, in oJIA, we identified 4 modules and calculated their correlations with the disease. The ME2 module exhibited a strong correlation (cor = 0.59, p < 0.001) with oJIA, indicating its significance. The corresponding PPI network identified six hub genes JUN, CXCL8, PTGS2, NFKBIA, SOCS3, and FOS, out of 185 analyzed genes (Fig. 4B). These findings shed light on the molecular mechanisms underlying RF-negative pJIA and oJIA, providing potential therapeutic targets.
Diagnostic efficacy of signature genes in RF-negative pJIA and oJIA
To evaluate the diagnostic value of the ME5 module for RF-negative pJIA, we performed ROC analysis on gene candidates using the GSE20307 dataset. JUN, CXCL8, KRAS, and SOCS3 showed superior performance in distinguishing RF-negative pJIA patients from healthy individuals, with AUC values of 0.755, 0.766, 0.7, and 0.795, respectively (Fig. 4C).
Additionally, we evaluated the diagnostic potential of the ME2 module in oJIA through ROC analysis of gene candidates’ sensitivity and specificity. Our analysis of the GSE20307 dataset identified CXCL8, JUN, PTGS2, NFKBIA, and SOCS3 as having the highest diagnostic value for differentiating oJIA patients from healthy controls. Notably, these hub genes in the GSE20307 training set demonstrated good sensitivity and specificity, with AUC values of 0.803, 0.875, 0.717, 0.773, and 0.79 for CXCL8, JUN, PTGS2, NFKBIA, and SOCS3, respectively (Fig. 4D).
Identification of overlapping hub genes and correlation with immune infiltration
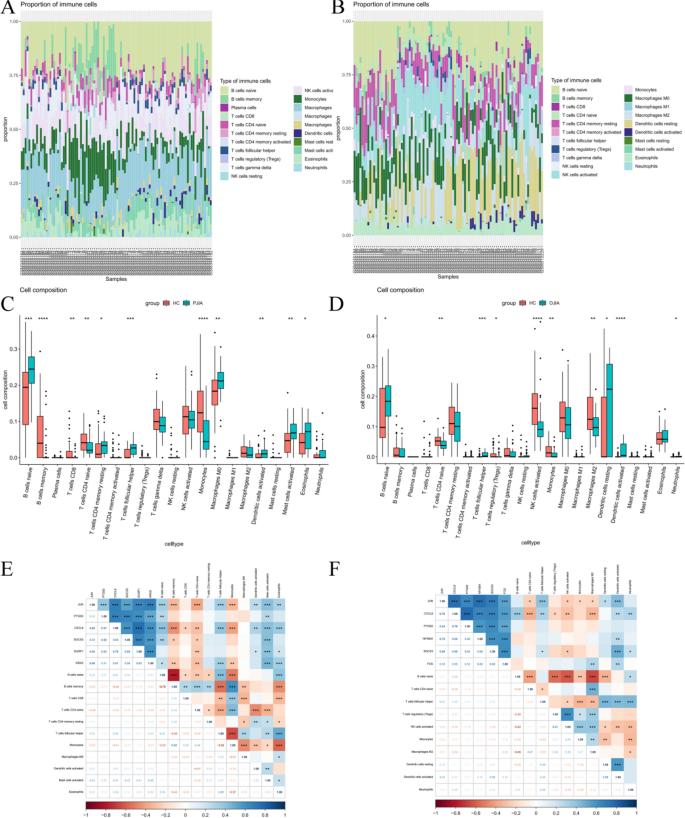
To further confirm the association between hub gene expression and immune infiltration, we utilized the CIBERSORT algorithm to assess the proportions of 22 immune cells in RF-negative pJIA (Fig. 5A) and oJIA (Fig. 5B). Our findings revealed that RF-negative pJIA patients had a higher abundance of naive B cells, resting memory CD4 T cells, follicular helper T cells, M0 macrophages, M1 macrophages, activated dendritic cells, activated mast cells, and eosinophils than healthy controls. Conversely, memory B cells, CD8 T cells, naive CD4 T cells, and monocytes were comparatively lower in RF-negative pJIA (Fig. 5C). Additionally, we observed significant correlations between five immune cell types and CXCL8 expression levels (P < 0.05). Specifically, naive B cells, follicular helper T cells, and mast cells exhibited positive correlations with CXCL8 expression, while memory B cells and monocytes displayed negative correlations (Fig. 5E).
Immune cell infiltration analysis of the GSE20307 datasets. The composition of immune cells in each sample was shown in a histogram between RF-negative pJIA and healthy individuals (A) and between oJIA and healthy individuals (B). The GSE20307 datasets were analyzed to determine differences in immune cell infiltration between RF-negative pJIA and healthy individuals (C) and between oJIA and healthy individuals (D). Correlation heat maps of immune cells between RF-negative pJIA and healthy individuals (E) and between oJIA and healthy (F)
Similarly, in oJIA patients, the proportions of naive B cells, follicular helper T cells, and activated dendritic cells were elevated compared to those in healthy controls, while the proportions of naive CD4 T cells, Tregs, activated NK cells, monocytes, and M2 macrophages were comparatively lower (Fig. 5D). Moreover, follicular helper T cells and activated dendritic cells showed positive correlations with JUN expression, and activated dendritic cells alone were positively correlated with SOCS3 expression (Fig. 5F). These observations suggest that CXCL8 might play a role in the pathogenesis of RF-negative pJIA, while JUN and SOCS3 may regulate immune cell infiltration in oJIA.
Validation of hub gene expression
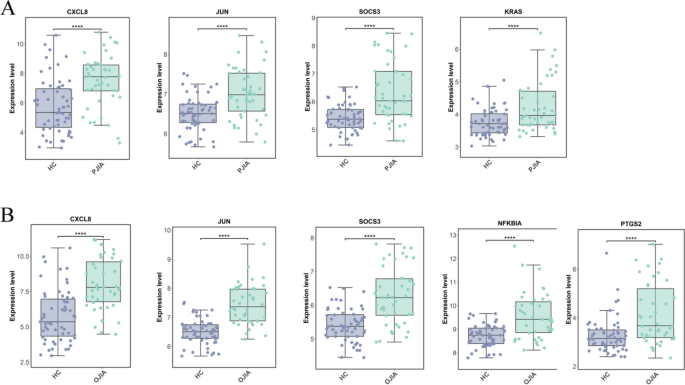
To validate the accuracy of the transcriptomic data, we conducted a validation study on hub genes using the GSE13501 dataset. The hub genes for RF-negative pJIA (JUN, CXCL8, KRAS, and SOCS3) exhibited significant differences in the validation dataset GSE13501 (Fig. 6A). Similarly, the hub genes for oJIA (CXCL8, JUN, PTGS2, NFKBIA, and SOCS3) also showed significant differences in the validation dataset GSE13501 (Fig. 6B). These findings suggest that the identified hub genes are reliable and may serve as potential biomarkers for the respective subtypes of JIA.





Add Comment