

We have previously developed the effectiveness of osteoconductive scaffolds with bicontinuous phases (i.e. channel phase and bioceramic phase) of 3D-printed bioceramic based on reverse negative thermo-responsive hydrogels (NTRH; poly(N-isopropylacrylamide)-co-(methacrylic acid)) bioceramic slurry and robotic deposition additive manufacturing (RDAM) [22]. The RDAM still has the following key disadvantages [22, 35,36,37]: (1) RDAM has a poor surface finish and cannot produce fine features structure. Because the hardness of ceramic slurry is insufficient, the RDAM will be more difficult to produce a pore structure in the printing x/y-axis direction. (2) Due to the poor interlayer bonding strength common and the NTRH molecular alignment directionality of ceramic slurry. Therefore, the RDAM has a high level of anisotropy in the XYZ direction leading to uneven sintering shrinkage and even cracks in larger samples.
Therefore, this study developed the DLP fabrication incorporated with the novel photocurable NTR bioceramic slurry. In addition to solving the above problems, this DLP is suitable for providing well-integrated subchondral bone scaffold approaches based on the exquisite and dense 3D-printed bioceramic skeleton process. However, the specimen of DLP shall be more isotropic since the green-body shrinkage evenly. The ingredient formulation of the novel photocurable NTR bioceramic slurry was developed based on the following rationale in this study: (1) Select some of the water-soluble monomeric cross-linking agents so that they can successfully 3D print stereoscopic structure specimens on a DLP machine. (2) The NTR monomer proportion of NIPPAm is as high as possible to achieve a better drainage shrinkage effect. (3) Because the HAp will decompose to β-TCP during 1000°C sintering, it can make the volume little increase can enhance the mechanical properties of the β-TCP sintered body that results [22, 38]. The sintered near pure β-TCP bioceramics can be obtained following the initial β-TCP/HAp mole ratio of 70/30 raw materials based on our previous experiments [22]. However, these weight ratios of 90.0/6.4/5.1/100.0 suitable ingredients of NIPPAm, PEGDA, TMPTA, and ethanol have been evaluated and confirmed at 30 vol% solids in β-TCP/HAp (70/30 molar ratio) powder because they can have obtained successful printable parameters under the DLP process system. The P.I. was also determined by 2.6 wt% I819 in this study. In addition, the feasibility confirmation of ingredient design, the NTR bioceramic slurry to form a 3D structure using the DLP process still needs consideration of other parameters comprising slurry viscosity (or flowability), ceramic solid content, exposure energy, curing depth, etc.… Due to these factors, final product characteristics will be evaluated to confirm the capabilities of photo-cured 3D structures and whether they will actually be successful.
Formulation and viscosity of optimal NTR bioceramic slurry for DLP 3D printing
How to prepare the low-viscosity photo-cured ceramic slurry is still a limitation or key factor of the current DLP 3D printing technology [27]. Literature showed that suitable for photo-cured 3D printing ceramic slurry generally shall have a viscosity of less than 3–5 Pa·s at a shear rate of 30 s−1 [27, 39]. To select an NTR ceramic slurry suitable for photo-cured printing of DLP in this study, Fig. 4 shows the results of the viscosity curves of the NTR bioceramic slurry with increasing shear rate, where three kinds of solid phase volume percent (30 vol%, 35 vol%, and 40 vol%) will be evaluated. Their results showed that the viscosity of NTR bioceramic slurry decreased with the increase in shear rate. In addition, these viscosities also only minor increase when the solids content increases from 30 vol% to 40 vol %. Among them, the viscosity was less than 3–5 Pa·s when the shear rate was greater than 5 s−1; it can be shown that its viscosity may meet the requirements of DLP 3D printing. Whatever, it is necessary to maintain a lower viscosity level at the beginning of action for the top-down DLP 3D printing system in our experience. In other words, if the viscosity of the NTR ceramic slurry increases by more than 3–5 Pa·s at the beginning, the successful printing under the DLP process system will easily fail. That says it will be difficult to maintain successful printing out 3D structures at the solid content level of 40 vol%. Therefore, we chose a solid content of 35 vol% as the stability parameter for the NTR bioceramic slurry to fabricate the concave-top disc sintered 3D-printed bioceramic of osteochondral graft and mechanical test sample.

The viscosity curves of the NTR bioceramic slurry with increasing shear rate, where loaded three kinds of solid phase volume percent (30 vol%, 35 vol%, and 40 vol%)
Determination of the drying condition and sintering temperature curve
After the as-received 3D-printed bioceramic green-body is obtained, the residual water in the sample must be removed by drying [40, 41]. Deformation and cracks of the sample can occur quite easily during the drying process with the traditional natural drying method [32, 40]. In particular, layer delamination and cracking can frequently occur due to the internal stress generated when materials such as solvents, residues, and polymers emerge from the objects during the drying and debinding processes [41]. Hence, it is critical to control the drying process to protect the sample from deformation and cracking. It is worth mentioning that our as-received 3D-printed bioceramic green-body can make the dehydration uniform and accelerate the drying in a 60°C oven for 1 h in this study, which is based on negative temperature responsive ceramic slurry characteristics and silicon oil enveloped show video of Supplemental information [16, 17, 20, 42].
The last challenge for sintered 3D-printed ceramic is whether the sintering conditions can obtain a highly densified and crack-free ceramic sintered body, and studying the thermal behavior of the 3D green-body of the bioceramic specimen is one of the key steps [43,44,45,46]. Therefore, the TGA test was performed to obtain the thermal debinding/degradation temperature, and the TGA curve result of the 3D-printed bioceramic green-body is shown in Fig. 5a. The first weight loss stage should be attributed to ethanol, water, minor monomers of NIPPAm, and lower molecule weight of PEGDA (< 500 Da), etc., which evaporate from 25.0°C to 146.5°C. Then, the percent weight loss in the first stage is about 15%. The second weight loss stage still shows a vaporization reaction between 146.5°C and 385.0°C, which should be comprised of silicone oil, trimethylolpropane triacrylate (TMPTA), and average molecular weight of PEGDA (~ 700Da), etc., the weight loss percentage of the second stage is about 5%. The third weight loss stage was the stronger endothermic decomposition reaction of between 385.0℃ and 500.0℃ and should be offered by the main weight of photo-crosslinking resin polymer and minor photo-initiator of I819.
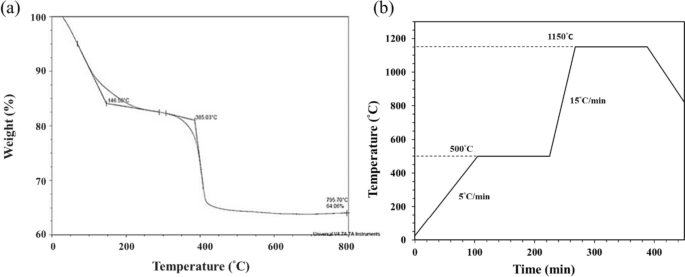
The thermogravimetric (TGA) analysis of the 3D-printed bioceramic green-body (a). The debinding and sintering temperature profile of 3D-printed bioceramic green-body in an atmosphere (b)
However, according to the TGA curve results, the sintering process is designed in a high temperature oven in the atmosphere, as shown in Fig. 5b. Which is mainly divided into the following two steps: the first step is to debinding and prevent the sintered specimen from cracking, and the heating rate is set from room temperature to 500°C at the rate of 5°C/min and kept at 500°C for 2 h. Subsequently, the second step is to sinter densification and enhance the mechanical properties of the sintered specimen. Therefore, the heating rate was set from 500°C to 1150°C at the rate of 15°C/min and kept at 1150°C for 2 h, and then the oven was naturally cooled to room temperature.
Physical and chemical property analysis of sintered 3D-printed bioceramic
Phase structure analysis
Figure 6 shows the XRD patterns of β-TCP powder, HAp powder, and the sintered 3D-printed bioceramic scaffold after sintering at 1150 ℃. The XRD peaks of all the diffraction patterns agree well with those of standard HAp and β-TCP in the powder diffraction file (standard XRD pattern of Card no. 9–432 and 9–169). However, each diffraction peak of the sintered 3D-printed bioceramic scaffold after sintering at 1150 ℃ was almost identical to β-TCP powder, such as the prominent peaks for (2, 1, 4), (0, 2, 10), and (2, 2, 0) planes of β-TCP were observed in line with the purpose of the phase structure to be achieved. The high-temperature treatment will lead to the HAp phase decomposing to β-TCP, resulting in a highly crystalline [22, 38, 47]. And the rationale for the 7/3 ratio of the β-TCP/HAp strategy wants to use an in-situ phase transition mechanism to increase its internal compressive stress. The reason is that the volume will have a small volume expansion based on the higher density of a small portion of HAp (3.16 g/cm3) crystal transit to the lower density β-TCP (3.14 g/cm3) [48].

XRD patterns of as-received HAp powder (a), as-received β-TCP powder (b), and (c) the sintered 3D-printed bioceramic scaffolds sintered at 1150 °C for 2h
The shrinkage, density and porosity analysis
Owing to the drying process should be to prevent deformation and cracks of the as-received 3D-printed bioceramic green-body. Therefore, the silicon oil film was used to seal the surface of the as-received 3D-printed bioceramic green-body can promote the uniform drainage of water to shrink these ceramic powders effectively under the 60 °C oven for 1 h in this study. This phenomenon is like vacuum packaging ceramic green bodies under envelop film in cold isostatic pressure (CIP) [22]. It should eventually make the sintered density of the sintered 3D-printed bioceramic scaffolds denser and increase the mechanical properties. However, we found that the shrinkage rate of the as-received 3D-printed bioceramic green-body from the drying and sintering process differs in the XY plane’s diameter and vertical direction’s height. The shrinkage analysis results in Table 1 showed that the shrinkage rate of the drying process from the diameter of XY plane and height of vertical direction is 10.2% and 5.6%, respectively. Then, the shrinkage rate of the sintering process from the diameter of the XY plane and the height of the vertical direction is 7.6% and 10.4%, respectively. Then, the XY plane diameter and vertical height shrinkage ratio between drying and sintering are very close, 17.8% and 16.0%, respectively. This means that the overall compactness of the vertical direction after sintering will also be a little bit lower than the diameter of the XY plane. Whatever, it still can be expected to avoid the serious formation of internal stresses and cracks resulting from uneven dehydration and the main photo-crosslinking polymer burn-off gases because each shrinkage rate step is slow and smaller than 12%. But, they still need to be evaluated by follow-up microscopic observation.
The apparent density was referenced to the Archimedes method of previous research [22, 49]; as previously mentioned, Eq. 1 was utilized, and the illustration in sFig. 1 of supplemental information, the average resulting in about 2.91 g/cm3 (compared with theoretical density up to 94.8%) as shown in Table 1. This suggests the higher degree of sintering densification achieved by the NTR-based bioceramic slurry at a relatively low ceramic powder volume of about 35 vol%. The bulk density results were also determined by the previously mentioned Eq. 2 and the illustration in sFig. 1 of supplemental information, the average resulting in about 1.37 g/cm3. In addition, the average bulk porosity of the concave-top disc sintered 3D-printed bioceramic scaffolds was about 56.47%. Because the bulk volume calculation of the concave-top disc sintered 3D-printed bioceramic scaffolds comprising the continuous channel volume was determined by Eq. 3, the illustration in sFig. 1 of supplemental information.
Microstructural observation and elemental semi-quantitative evaluation
The surface and cross-sectional microstructures of the concave-top disc sintered 3D-printed bioceramic were evaluated by SEM, as shown in Fig. 7. Morphological investigations of Fig. 7a and b showed that the 3D sintered β-TCP bioceramic was compactness on the XY plane than the lateral side of the vertical direction. Because there are microcracks between layers on the lateral side of the vertical direction, this result is consistent with the shrinkage result. It is speculated that if the interlayer polymerization time is adjusted a little longer, the monomer resin between the upper and lower layers will have a higher degree of crosslinking, which would result in better densification in the lateral side of the vertical direction [44]. In addition, Lin et al. also reported that increasing the photoinitiator concentration decreases print resolution due to excess radical production and diffusion [50]. In other words, the photoinitiator concentration decreases, and the penetration depth of the photons increases, where the free-radical initiation is not thus localized closer to the surface. Therefore, the depth of the light source of each layer can be increased, which could result in better densification in the lateral side of the vertical direction.

SEM morphologies of the concave-top disc sintered 3D-printed bioceramic scaffolds were evaluated, the bottom view on the x–y plane (a, c), lateral view on the side of the vertical direction (b, d)
Furthermore, based on the results reported by Murphy et al. in their study, a pore size of approximately 325 μm is considered the most suitable [51]. Final interconnected pore channel consists of circular pores with a diameter of 250–400 μm on the XY plane. The lateral view showed the elliptical pores have long and short axes of 400–500 µm and 200–300 µm, respectively. And the macropore size is in the range of 100 to 800 µm, which is optimal to allow diffusion of nutrients/removal of waste byproducts, bone cell colonization, blood vessel infiltration, and new bone regeneration [52]. Regardless, the micropores smaller than 10 µm still were observed from the interparticle in the higher magnification images, as shown in Fig. 7c and d. Each grain size was distributed in the range of about 2–5 µm, and most of the grain shapes were irregular. The microstructure of sintered bioceramic surface was also shown to be closed on the XY plane than the lateral side of the vertical direction because obvious microcracks can be observed on the lateral side of the vertical direction.
In addition, the SEM–EDS has proven to be a rapid investigation tool to detect which elements are present in the processed sintered 3D-printed bioceramic scaffolds. As can be seen in Table 2, the main elements of the silicone oil-sealed sintered 3D-printed bioceramic scaffolds were C, O, Si, P, and Ca. The Ca/P molar ratio was close to 1.41. In contrast, the mole percentage of elemental silica was about 2.29 atomic%. Furthermore, the increase of 2.29 atomic% silicon element from silicone oil-sealed 3D-printed bioceramic scaffolds was expected to be consistent with the current results in the kinds of literature, suggesting that silicate ions could be enhanced vascularization and osteogenic differentiation in vitro and in vivo [53], then promote repair of two different differentiated tissues in vivo (cartilage and bone) [54].
Compression strength evaluation
To analyze the compression strength of the sintered 3D-printed bioceramic scaffolds, typical compression data profiles are shown in sFig. 2 of the supplemental information using the initial external dimensions (ϕ 4.8 × height 12.0 mm) of each sample. The average compressive strength can reach 11.38 \(\pm\) 1.72 MPa. Therefore, the silicon oil film was used to seal the surface of the as-received 3D-printed bioceramic green-body to promote the uniform drainage of water to shrink these ceramic powders effectively under the 60 °C oven for 1 h. In addition, the overall shrinkage of the XY plane diameter and vertical height from the as-received 3D-printed bioceramic green-body to drying and sintering is about 17.8% and 16.0%, respectively. The newly developed denser sintered 3D printed bioceramic (β-TCP) scaffold process can be made using DLP technology and the novel photocurable negative thermo-responsive (NTR) bioceramic slurry. Furthermore, sealing the surface of the as-received 3D-printed bioceramic green-body with the silicon oil cover can avoid the serious formation of internal stresses and cracks resulting from uneven dehydration. Finally, better mechanical properties can be obtained after a proper sintering profile.
Cytotoxicity of 3D-printed bioceramic
Biocompatibility is a major requirement for implanted bilayer osteochondral graft substitutes. We have approved that the photo-cured hybrid biohydrogel system (HG + 0.5AFnSi) is non-cytotoxic and can provide a suitable environment for the chondrogenesis of hADSCs in the previous report [18]. However, the subchondral scaffolds of the sintered 3D-printed bioceramic (β-TCP) scaffolds still need to be further evaluated for cytotoxicity. Therefore, we assessed cell viability by the MTT assay following ISO 10993–5. The results in Fig. 8a and b show that these sintered 3D-printed bioceramic scaffolds exhibit well cell viability for NIH-3T3 cells after 24 h and 48 h of cell culture. For example, the blank controls are averaged and set to 100% cell viability by OD450-630 absorbance readings at 24 and 48 h. The following proportion of the negative control, positive control, and test extracts at 24 h are 22.18%, 108.00%, and 95.01%, respectively. And then, the results of cell viability at 48 h also indicated the positive control, negative control, and test extracts to be 7.38%, 97.12%, and 94.27%, respectively. Anyway, the negative control and test groups showed no significant changes in cell morphology compared to the blank group, while the positive control group showed severe growth inhibitory cells. Above cytotoxicity evaluation results show that the sintered 3D β-TCP bioceramic scaffolds with minor silicon elements (< 3 Atomic %) also have good cell biocompatibility.
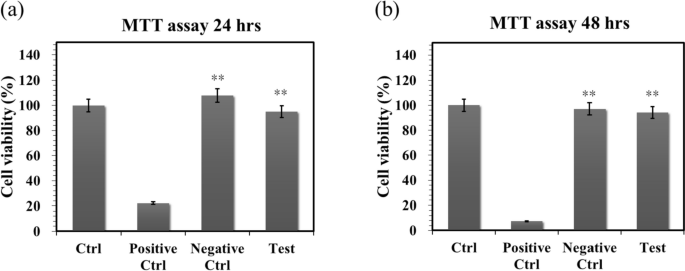
The cell viability of NIH-3T3 cells was evaluated by MTT assay on the sintered 3D-printed bioceramic scaffolds at 24 and 48 h. The SDS is used as a positive control, and a group consisting exclusively of cells and a group with only Al2O3 powders were used as blank controls and negative controls. The error bar represents ± SD (n = 6); *p < 0.05 and **p < 0.01 compared with the positive control group
The in vivo regeneration of osteochondral defects in rabbit
Soft X-ray radiograph analysis
As calcium phosphate is naturally radiopaque, especially all the dense sintered 3D-printed bioceramic scaffolds are more thus radiopaque, being visible on X-ray images as soon as they are until they are resolved and substituted by newly formed bone. The radiographs taken immediately after surgery clearly revealed osteochondral defects in all the animals. However, the sintered 3D-printed bioceramic scaffolds are still visible in the defects of the test groups, shown in sFig. 4 (b) (blue delta) at 8 weeks of supplemental information and Fig. 9 (b) (blue delta) at 12 weeks. Before sacrifice for 8 weeks and 12 weeks, it was evident that a blurred outline of osteochondral defect surrounded the defect site in the blank group. However, the chondral defect area in test groups also appeared blurry between after surgery and before sacrifice, as shown in sFig. 4 (a), (b) and Fig. 9 (a), (b) (blue delta). Preliminary radiographic examinations showed satisfactory results with low degradation rates for all samples and maybe a positive effect on the healing of the osteochondral defect. These findings suggest that the sintered 3D-printed bioceramic scaffolds with a stiff subchondral bony compartment would provide stable mechanical support for cartilage regeneration and enhance subchondral bone regeneration. The success of cartilage repair is closely related to the integrity of the subchondral bone tissue, and the primary purpose of the bioceramic scaffold is to provide support for cartilage growth and the environment for bone growth [55]. Therefore, as long as the degradation rate of the bone layer of the osteochondral scaffold is slower than that of the cartilage scaffold, it is considered acceptable in clinical practice.

Soft X-ray photographs of osteochondral defect of femoral trochlear in rabbit cartilage blank and experimental groups. Osteochondral defects immediately after the surgery (a) Osteochondral repair defect before sacrifice (b)
Gross examination and histological examination
In addition to examining whether hADSCs laden with the novel photo-cured hybrid biohydrogel system (HG + 0.5AFnSi) of the bilayer osteochondral graft can provide a suitable environment for the regeneration ability of osteochondral defect in the rabbit knee joint. It is worth observing whether 3D-printed bioceramic scaffolds of the bilayer osteochondral graft have the following advantages in osteochondral defect sites: (1) Whether the sintered 3D β-TCP scaffolds are expected to provide long-term stable support for the subchondral substrate can better restore the integrity of the osteochondral tissue. (2) Because the dense middle layer of the sintered 3D β-TCP scaffold separates ADSCs and BMSCs within the bilayer osteochondral graft. Does it affect the ability of the chondral layer to regenerate as a result? (3) Whether the sintered 3D β-TCP scaffold can promote the tissue regeneration of subchondral trabecular bone and whether the sintered 3D β-TCP scaffold will also gradually degrade and be replaced by autologous bone.
In the first-phase in vivo study, the visual inspection results of the appearance of the repaired osteochondral defect 8 weeks after surgery are shown in Fig. 10. Some neo-tissue formation of spontaneous regeneration was observed in the blank group, HG without hADSCs of the bilayer osteochondral graft (HG/3D β-TCP) group, and HG + 0.5% AFnSi without hADSCs of the bilayer osteochondral graft (HG + 0.5AFnSi/3D β-TCP) group. At the same time, some white newly grown tissues appeared in the HG with hADSCs of the bilayer osteochondral graft (hADSC + HG/3D β-TCP) group and HG + 0.5% AFnSi with hADSCs of the bilayer osteochondral graft (hADSC + HG + 0.5AFnSi/3D β-TCP) group. However, the defect area was significantly reduced while well-integrated glossy white tissues were detected. The osteochondral defect in all groups still had not healed well at the 8 weeks, and the osteochondral defect site still had a little defect area that failed to cover the defect surface.

After 8 weeks of surgery, the gross examinations were inspected by optical photos, and the biological and chemical composition of bilayer osteochondral grafts were assessed. The glycosaminoglycan (GAG) distribution analysis using Safranin-O staining (a). The HE stating is hematoxylin staining the nuclei in blue-purple, while eosin staining stains the cytoplasm and extracellular matrix pink (b). Red dashed line box: the chondral layer defect area; Black dashed line box: the subchondral layer defect area; Blue delta showed osteocyte
Subsequently, these histological specimens’ groups comprising of the blank, HG/3D β-TCP, HG + 0.5AFnSi/3D β-TCP, hADSC + HG/3D β-TCP, and hADSC + HG + 0.5AFnSi/3D β-TCP were obtained at 8 weeks after surgery and subjected to Safranin-O staining and HE staining in Fig. 10 a and b. The Safranin-O staining could appear red–orange and stains proteoglycans (PGs) present in the extracellular cellular matrix. The staining intensity reflects the number of PGs present, with darker staining indicating higher concentrations of PGs [56,57,58]. I In contrast, to responsible for the new bone formation at the subchondral layer, and Safranin-O staining is not typically used since the bone tissue does not contain PGs in the same way as cartilage. The first-phase group’s results of the integrity of the morphology and thickness of the cartilage-like layer were assessed using the Safranin-O staining and shown in Fig. 10a. Among them, the PGs concentrations of both groups with hADSCs are better than those without hADSCs, such as the hADSC + HG/3D β-TCP group and hADSC + HG + 0.5AFnSi/3D β-TCP group. And although the blank group and HG + 0.5AFnSi/3D β-TCP group without hADSCs seem to have more neo-tissue formation, the response from PGs is still less. Even though the defect area was significantly reduced while well-integrated glossy white tissues were detected, the formation of PGs in the extracellular matrix of the cartilage layer was still not seen in the two groups of HG-based osteochondral grafts without hADSCs and the blank group.
In addition to characterizing the ability of cartilage regeneration in these areas according to the biochemical components of the ECM as described above, further observation of the cell morphology and number between the cartilage layer and the subchondral layer can also be used as a screening condition for osteochondral regeneration [59, 60]. It is known from some of the literature that the morphology and number of chondrocytes in different regions of the knee cartilage layer are as follows [59, 61, 62]: the superficial zone is the outermost and thinnest of all layers of the joint cartilage. It is composed of a relatively high number of oval-shaped chondrocytes parallel to the surface of the joint [59, 61, 62]. The chondrocytes of the middle (or transitional) zone are spherical and have low density. And then, Chondrocytes in the deep zone are larger and are usually available in a columnar orientation and perpendicular to the surface [59, 61, 62]. The calcified cartilage zone plays an integral role in the fixation of cartilage to the bone by anchoring collagen fibrils from the deep zone to the subchondral bone. In this zone, the cell population is scarce, and chondrocytes are hypertrophic, which makes metabolic activity very low [59, 61, 62].
Therefore, the morphological and number analysis of chondrocytes in different areas of the chondral layer and subchondral trabecular bone at 8 weeks after surgery were shown in HE staining of Fig. 10b. Owing to hematoxylin stains nuclei blue-purple, while eosin stains the cytoplasm and extracellular matrix pink [63, 64]. Therefore, they appear blue-purple could be the presence of hADSCs and chondrocytes in the extracellular matrix for the chondral layer and the presence of BMSCs/osteoclasts/osteoblasts/bone cells in the extracellular matrix for the subchondral trabecular bone were shown in Fig. 10b. Besides, it also can appear pink due to the cytoplasm and the surrounding extracellular matrix for the chondral and subchondral layers. To check the morphology of chondrocytes from superficial to deep areas of the chondral layer of Fig. 10b. Only hADSC + HG/3D β-TCP group and hADSC + HG + 0.5AFnSi/3D β-TCP group had similar natural cartilage morphology when the chondral layer was regenerated due to the presence of hADSCs. In particular, the group of hADSC + HG + 0.5AFnSi/3D β-TCP showed the highest number of cells. In other words, a relatively high number of oval-shaped chondrocytes appeared parallel to the joint’s surface; the chondrocytes are spherical and have a low density in the middle zone. And then, chondrocytes are larger and are usually available in a columnar orientation and perpendicular to the surface in the deep zone. The morphology of these hADSCs differentiated into chondrocytes is consistent with the analysis results of PGs in Fig. 10a. In addition, the blank group and the other two groups of HG-based without hADSCs of the bilayer osteochondral graft, whose histological cell morphology showed non-chondrocytes in the chondral layer and may be derived from the synovial fluid or BMSCs in the bone marrow. Among them, the obvious defect appearance on the surface of HG/3D β-TCP may be the crosslinking not enough of its HG hydrogel.
Next, we are going to examine the regeneration of the cancellous bone area under the chondral layer. The results in Fig. 10b show that the blank group has no obvious collapse phenomenon. However, histological observations showed that the self-regeneration ability of the chondral layer was poor, the subchondral trabecular bone area was empty, and the repaired subchondral tissue was disordered bone tissue. The other groups of the bilayer osteochondral grafts further observe cell morphology within the subchondral trabecular bone area in Fig. 10b. It can be seen that the interconnected pore channels of a 3D-printed bioceramic scaffold can allow BMSCs and bone cells to conduct new bone formation after implant surgery. In addition, the structure of the 3D sintered β-TCP scaffolds remained stable, and the subchondral trabecular bone regions still showed no obvious degradation before 8 weeks. Although β-TCP belongs to the phase structure of in vivo biodegradation, this is attributed to the high densification of the 3D sintered bioceramic structure in this study, which also has stronger crystallinity, so it can resist rapid degradation in vivo.
Because the groups of hADSC + HG + 0.5AFnSi/3D β-TCP have better repair and regeneration performance of osteochondral defects for 8 weeks. In the second phase in vivo study at 12 weeks of animal experiment, we maintained the blank and hADSC + HG + 0.5AFnSi/3D β-TCP group experimental groups. In addition, a group of positive control of HAMA with hADSCs of the bilayer osteochondral graft (hADSC + HAMA/3D β-TCP) was added for animal experiment comparison of osteochondral defect regeneration. The visual inspection results of the appearance of the repaired osteochondral defect 12 weeks after surgery are shown in Fig. 11. The more neo-tissue formation of spontaneous regeneration was still observed in the blank group. Only, it appears more transparent tissue than other groups and normal cartilage surface. However, the positive group of HAMA/3D β-TCP also showed good coverage repair. Still, the defect area’s growing tissue was whiter and more opaque than the surrounding normal cartilage area. However, results with better osteochondral defect regeneration showed that in the group of hADSC + HG + 0.5AFnSi/3D β-TCP since newly grown tissues of glossy white can appear. Therefore, the osteochondral defect in all groups seems healed and covered the defect area at 12 weeks; just the osteochondral defect site had a little bit of color and difference in transparency.

After 12 weeks of surgery, the gross examinations were inspected by optical photos, and the biological and chemical composition of bilayer osteochondral grafts were assessed. The glycosaminoglycan (GAG) distribution analysis using Safranin-O staining (a). The HE stating is hematoxylin staining the nuclei in blue-purple, while eosin staining stains the cytoplasm and extracellular matrix pink (b). Red dashed line box: the chondral layer defect area; Black dashed line box: the subchondral layer defect area; Blue delta showed osteocyte
And then, the Safranin-O staining and HE staining for histological samples evaluation also continued at 12 weeks after surgery, and the results are shown in Fig. 11a and b. The Safranin-O staining results of Fig. 11a showed the morphology and thickness of the cartilage-like layer. The proteoglycans (PGs) concentrations of the group of hADSC + HG + 0.5AFnSi/3D β-TCP is still better than blank groups and hADSC + HAMA/3D β-TCP group. That is, the red–orange stains proteoglycans with darker staining indicating higher concentrations, which staining intensity reflecting the amount of proteoglycans present. In addition, although the blank group and the hADSC + HAMA/3D β-TCP group seem also to have more neo-tissue formation, the response from GAGs is still low amount or none.
Subsequently, the morphological and number analysis of chondrocytes in different areas of the chondral layer and subchondral trabecular bone 12 weeks after surgery was shown in the HE staining of Fig. 11b. To check the morphology of chondrocytes from superficial to deep areas of the chondral layer. The group of hADSC + HG + 0.5AFnSi/3D β-TCP was still the one with the most similar natural cartilage morphology when the chondral layer regenerated for 12 weeks due to the presence of hADSC + HG + 0.5AFnSi of the bilayer osteochondral scaffold. The group of hADSC + HG + 0.5AFnSi/3D β-TCP showed that the number of cells is the highest, and the chondrocyte morphology of each partition in the cartilage layer was closest to the natural cartilage layer. In other words, a relatively high number of oval-shaped chondrocytes appeared parallel to the joint’s surface. The chondrocytes are spherical and have a low density in the middle zone. And then, chondrocytes are larger and are usually available in a columnar orientation and perpendicular to the surface in the deep zone.
Then continue in Fig. 11b examines the regeneration of the trabecular bone area under the chondral layer at 12 weeks after surgery. It also can be seen that the blank group without 3D-printed bioceramic scaffolds has no obvious collapse phenomenon. However, histological observations of the blank group showed that the self-regeneration ability of the chondral layer was still poor, and the cancellous bone area was empty too. The other two groups of the bilayer osteochondral grafts (hADSC + HG + 0.5AFnSi/3D β-TCP and hADSC + HAMA/3D β-TCP) further to observe cell morphology within the subchondral trabecular bone area in Fig. 11b, it can be seen that the interpenetrating pore channels of 3D-printed bioceramic scaffold can have more new bone formation after implant surgery at 12 weeks. Regardless, the structure of the sintered 3D-printed β-TCP scaffold was still mostly preserved. However, the subchondral trabecular region showed more degeneration at 12 weeks than at 8 weeks. It did not demonstrate host-graft rejection from hADSCs laden with biohydrogel bilayer of osteochondral graft in the rabbit xenogeneic transplantation model from multi-nucleated cells (macrophages).
In addition, we also confirmed the type II collagen staining and Masson’s trichrome staining analysis for the bilayer osteochondral grafts at the 12-week, as demonstrated in sFig 3 and Fig. 12. It’s worth noting that Masson’s trichrome staining allowed us to define the bone and cartilage tissues effectively [65]. The collagen fibers in cartilage are typically thinner and more uniformly distributed in chondrogenic tissue, and they can appear blue [66]. Besides, the bone tissue has thicker and more irregularly distributed collagen fibers in bone tissue, and it will appear more reddish in color [67, 68]. The results of Masson’s trichrome staining at 8 weeks and 12 weeks are shown in Fig. 12. The lesion sites of the subchondral trabecular bone area were still visible histologically in all sample repair groups at 8 weeks of Fig. 12a. And the trabecular bone tissue repair of the blank group from the adjacent subchondral trabecular bone layer within the border is essentially empty. However, Fig. 12a can show that the appearance of the sintered 3D-printed bioceramic scaffold is still clearly visible in the subchondral trabecular bone area. In other words, the sintered 3D-printed bioceramic scaffolds had not been clearly degraded and transformed into the autologous cancellous bone at 8 weeks after surgery. However, the results of Masson’s trichrome staining indicated that the lesion sites of the bilayer osteochondral graft had gradually degraded and regenerated in the repair group of hADSC + HG + 0.5AFnSi/3D β-TCP at 12 weeks after surgery and shown in Fig. 12b. In particular, the border of the repair subchondral trabecular bone tissue from the adjacent layer could indicate that the 3D sintered bioceramic scaffold had an apparent transformation into autologous cancellous bone tissue. However, Masson’s trichrome staining also showed pale blue staining in all groups at 8 weeks but darker blue staining in the experimental groups at 12 weeks, indicating the presence of more collagen fiber distribution in the experimental groups. In general, the integration of the hADSC + HG + 0.5AFnSi/3D β-TCP group of the bilayer osteochondral scaffold into the defect site has good results from Fig. 12b.

Optical photos inspected the gross examinations, and the collagen composition of bilayer osteochondral grafts was assessed using Masson’s trichrome staining. At 8 weeks after surgery (a). At 12 weeks after surgery (b). Red dashed line box: the chondral layer defect area; Black dashed line box: the subchondral layer defect area
Masson’s trichrome staining indicated that the bilayer osteochondral scaffold showed improved osteochondral regeneration and integration, consistent with the Safranin-O and H&E staining results. It should be noted that the enhanced bone tissue turnover by the bilayer osteochondral scaffold was observed only in the subchondral bone region, demonstrating the essential role of the sintered 3D β-TCP in promoting new bone formation. In accordance with the Safranin-O staining results, it was observed that the bilayer osteochondral graft led to the formation of a border for tissue calcification beneath the superficial zone, which helped in maintaining an avascular environment of cartilage tissue.
In comparison, the HG + 0.5AFnSi with hADSCs of the bilayer osteochondral graft showed a much better osteochondral defect repair outcome. A thicker cartilage layer with a smooth surface and uniformly aligned chondrocytes were observed. A more amount of regenerated trabecular bones at the subchondral bone layer also demonstrated better tissue integration.
One of the reasons for this phenomenon should be that we have adopted an osteochondral scaffold design in which the upper hybrid biohydrogel layer of hADSC + HG + 0.5AFnSi and the other layer of subchondral trabecular bone of the sintered 3D β-TCP are separated. Then, the dense middle layer of β-TCP can avoid each other interference between the BMSCs of the subchondral bone of the knee joint and hADSC + HG + 0.5AFnSi of the bilayer osteochondral grafts. Literature research shows that the chondrocytes differentiated from BMSCs are often fibrocartilage rather than hyaline cartilage [69, 70]. Another possible reason that needs to be explained is that the main function of the acrylate-functionalized nano-silica (AFnSi) crosslinker in the chondral layer should be to enhance the mechanical properties of its hybrid biohydrogel, leading to the ability to enhance cartilage regeneration [71]. Therefore, there is no answer to whether it is because of the effect of minor silicon on cartilage ability. In addition, this study has not also discussed whether the subchondral scaffold of the sintered 3D β-TCP scaffolds with minor silicon elements (< 3 Atomic %) can promote bone repair. Still, it will not cause the phenomenon of inhibiting bone regeneration.
Add Comment