

Participants
We initially recruited 230 junior baseball players from six teams in Tokyo, Japan in April 2018. The inclusion criteria were males aged between 6 and 12 years. The exclusion criteria were injury and illness that prevented the measurements of the participant. Participants were categorized by age groups during the baseball season according to the little league eligibility rules—players were classified according to age as of July 31 of a given year. Next, the period up to July 31 of the second grade of elementary school was defined as Under 8 (U8), and after that, the period was divided by year up to U13. They played and practiced baseball for 3–6 h at least twice a week (Saturdays and Sundays). Before the examination, all participants completed a data questionnaire requesting the following information: birth, age when they first started playing baseball, and the side on which they bat. Additionally, all participants and their guardians received a detailed explanation of the experimental procedures and risks of the research before measurements were performed. Moreover, written informed consent was obtained from all participants and their guardians who assented to the study. This study was approved by the Ethics Committee of the Waseda University (No. 2018 − 208).
Batting procedure
Testing was conducted between 09:00 and 16:00 at an outdoor baseball field maintained under standard environmental conditions. In addition, testing was conducted between January and March, divided into 4 to 6 days per season. First, we measured the participant`s height and weight with their clothes on. Next, without their shoes on, height was measured to the nearest 0.1 cm without their shoes on using a stadiometer (YG200DN, Yagami Co., Nagoya, Japan); and weight was measured to the nearest 0.1 kg using a digital scale (BC622, TANITA Co., Tokyo, Japan). Next, the batting trial was performed after simple warm-up exercises, including dynamic stretching, jogging, light throwing, and swinging for approximately 20 min. Each participant received non-reflected white markers on the top of the head, both lateral acromion tips, and anterior and superior iliac spines. The trial involved toss batting with an automatic toss machine (FTM-240; Field Force Company, China). The toss machine was placed 0.7 m from the center of the home plate on the opposite side of the batter and 1.1 m toward the pitcher; it was positioned to launch obliquely in front of the batter. The height of the tossing machine was adjusted according to the participant’s height as follows: 45% of the height minus 52.5 cm. Then, actual testing was performed twice after one practice attempt, and the batting motion was captured at 240 Hz with three high-speed cameras (Ex-100PRO, Casio Co., Tokyo Japan) placed on the batter’s side, back, and front (obliquely). The environment of the batting trial setting was shown in Fig. 1.
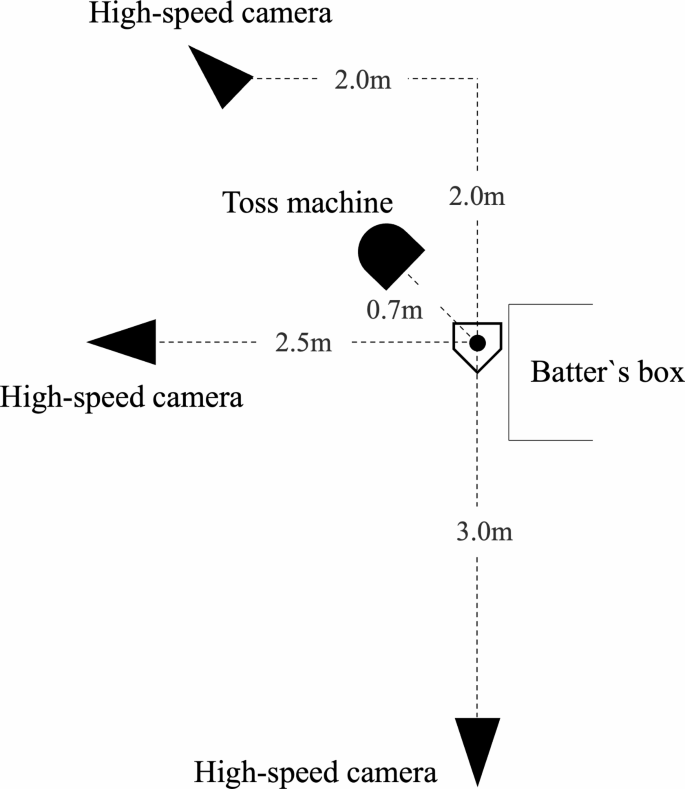
Environment of batting trial (In the case of left-handed batter)
Additionally, the swing velocity—a component of the batting performance was measured using a Zepp sensor (ZEP-BT-000002; Zepp Company, Cupertino, California, USA), which has been shown to have high reliability (ICC, 0.88) [13], and indicated to correlate moderately to strongly with data analyzed by 3D motion capture [14]. Participants were allowed to reattempt the batting trial if they missed the ball while swinging or made timing mistakes. During the batting trial, participants used the bat they would normally use in baseball practice and games and consistently used the same bat throughout their trials. Data were collected from the test with the highest swing velocity.
Variables
The rotation angles of the head, upper trunk, pelvis, and arm direction in the horizontal plane during the batting motion and the separation angle between each segment, the amount of head movement, and the step width were analyzed by manual digitizing using a motion analysis system (Frame-Dias V; DKH, Tokyo, Japan). Moreover, we visualized the body markers attached to the head, both lateral acromion tips, anterior and superior iliac spines, nose, toes, and the midpoint between both hands on the bat on the screen using a digital format. Next, three-dimensional coordinates were obtained using the direct linear transformation method [15], and the right-hand orthogonal reference frame was defined as the X-axis, Y-axis, and Z-axis. The Y-axis was directed from the pitcher’s mound to the home plate, and the Z-axis indicated a vertical direction (bottom to top). Additionally, the X-axis was defined as the cross-product of the Y-axis and Z-axis. For calibration, poles with nine markers (from 0 to 2.0 m at 25 cm intervals) were vertically set in a 4 × 4 grid at 40 cm intervals (the standard errors were as follows: x = 0.22 cm; y = 0.28 cm; z = 0.34 cm). A recording of the calibration points using the three high-speed cameras was conducted from the start to the end of batting. The analysis data were collected at five points: stance, load, foot contact, pre-swing, and ball contact. Stance and foot contact were defined as the point of the toe of the stepping leg on the Z-axis at which the value of the Z-axis began to increase in the positive direction. Moreover, load and pre-swing were defined as the midpoints between stance and foot contact and between foot contact and ball contact, respectively.
All rotation angles were calculated using values corresponding to spaces in global coordinates because batting is an operation initiated by reacting to a thrown ball and defined as the projected angle on the horizontal plane regarding the X-axis (Fig. 2). Additionally, the rotation angles were set as positive/negative toward the pitcher/catcher.
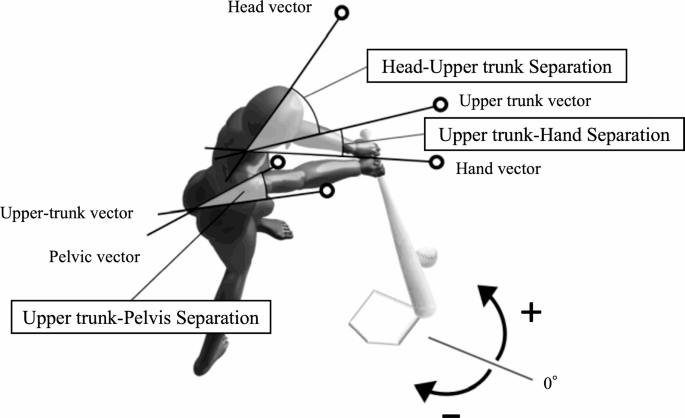
Definitions of rotation and separation variables
The variables analyzed in this study and their definitions are as follows:
-
Head rotation—the angle between the head vector (top of the head to the nose) and the X-axis.
-
Upper trunk rotation—the angles between the upper trunk vector (passing through the midpoint of both acromions and perpendicularly to the line connecting both points) and X-axis.
-
Arm direction—the angle between the hand vector (midpoint of both acromions to a point between both hands) and the X-axis.
Furthermore, the separation angle was expressed as the difference between each rotation angle, and head-to-upper trunk separation was calculated by subtracting the head rotation from the upper trunk rotation. Moreover, upper trunk-to-arm separation was calculated by subtracting the upper trunk rotation from the arm direction. Upper-to-pelvis separation was calculated by subtracting the upper trunk rotation from the pelvis rotation. The linear head movement distance (head movement) from stance to foot contact and foot contact to ball contact was calculated as the resulting displacement of the top of the head. Lastly, the stance widths during stance and foot contact were calculated as the distance between the toes.
Statistical analysis
A statistical power analysis was conducted for sample size estimation. We required more than 12 players for this study to conduct a comparison of the three groups at 80% power, an alpha of 0.05. and a partial η of 0.14. Seventy-seven baseball players who met the inclusion criteria completed three measurements for three seasons. Of these, 17 players formed group 1 (U8 to U10), and 13 formed group 2 (U11 to U13) (Fig. 3).
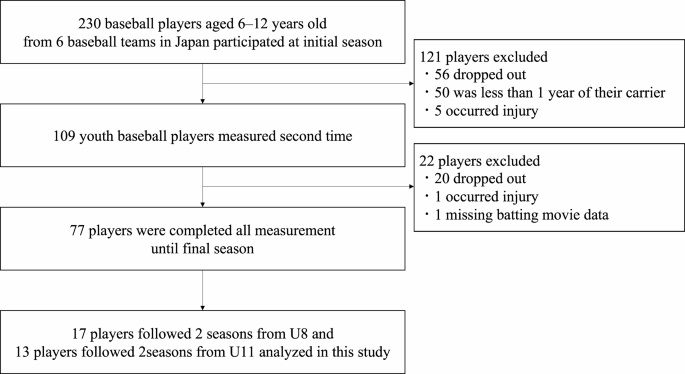
Flow diagram of exclusion criteria and the final participants
Descriptive statistics (mean ± standard deviation) were performed. After confirming all data were normally distributed using the Kolmogorov–Smirnov test and confirming homoscedasticity with Levene’s test, we performed a one-way repeated measures analysis of variance (ANOVA) to compare chronological age, height, body weight, competition years, rotational and separation angles, swing velocity, head movement, and step width at the points of stance, load, foot contact, pre-swing, and ball contact among the initial, second, and final measurements for three seasons. Furthermore, we performed multiple comparisons of the means of the monitored variables using the Bonferroni test. Partial η2 was calculated for the effect size of the one-way ANOVA, with values of ≥ 0.01 to < 0.06, ≥ 0.06 to < 0.14, and ≥ 0.14, indicating small, medium, and large effects, respectively [16]. Lastly, the alpha level was set at 0.05 and all statistical analyses were performed using SPSS Statistics 27.0 (IBM, Armonk, New York, USA).
Add Comment