Descriptive statistics
A total of 44,390 (8.8%) participants with missing data were excluded. Compared with those with complete data, participants with missing data were more likely to be male, older, from minority ethnic backgrounds, have been assessed in spring or summer months (April to September), be from more deprived areas, be current smokers, have low physical activity levels, have a higher BMI, and have more long-term conditions (Additional file 1: Table S2). After excluding those without full data, 458,146 (91.2%) UK Biobank participants were included in the main analyses. The mean age of participants was 56.5 years (standard deviation [SD] 8.1; range 38–73), 54.7% were women, and 95.5% were of white ethnicity (Table 3). Generally, compared to all participants, those reporting any measure of reduced social connection were more likely to be from a minority ethnic background, be more deprived, engage in more unhealthy behaviours (smoking, high alcohol intake, and low physical activity levels), have a higher BMI, and have more long-term conditions. Of those who reported each measure of reduced social connection, there was variation in the percentage who were female: often feeling lonely (62.9% women), not engaging in weekly group activities (55.1% women), living alone (58.5% women), never able to confide in someone close (40.9% women), and friend and family visits less than monthly (42.0% women). GVIF values, calculated to detect multicollinearity, ranged from 1.00 to 1.16 and were well below the proposed threshold of 10 (Additional file 1: Table S3) [44]. This reduced the concern of multicollinearity and strengthened the argument for including all the social connection measures as separate variables in the models.
Association with adverse health outcomes
After a median follow-up of 12.6 years (IQR 11.9–13.3), there were 33,135 (7.2%) deaths, of which 5112 (1.1%) were CVD deaths.
Functional component measures—independent associations (RQ1)
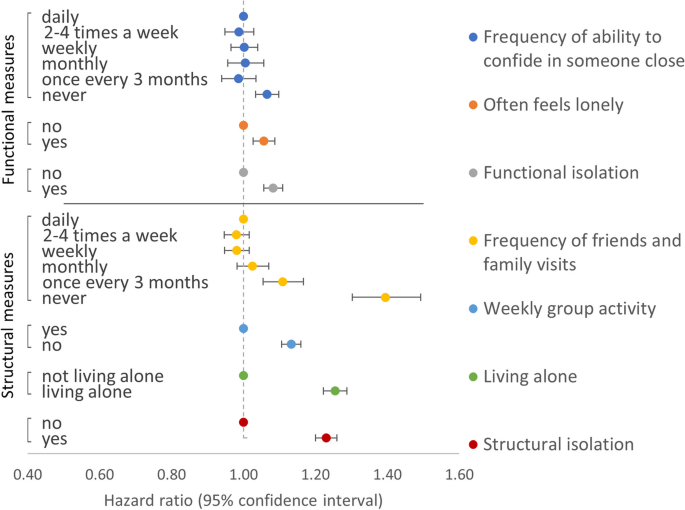
Models of the association between the frequency of the ability to confide in someone close and outcomes showed that participants who reported never being able to confide were associated with higher all-cause and CVD mortality compared with the reference group of those who reported being able to confide daily: HR 1.07 (95% CI 1.03–1.10) and 1.17 (1.09–1.26), respectively (Table 4 and Fig. 1). Indeed, for both outcomes, there were no substantial differences in effect sizes across all categories of frequency in the ability to confide in someone close apart from never able to confide. Models of the association between often feeling lonely and outcomes showed that compared to those who reported not often feeling lonely, those often feeling lonely were also associated with higher all-cause and CVD mortality: HR 1.06 (1.03–1.09) and 1.08 (1.00–1.16) (Table 4 and Fig. 1).
Models of association between functional and structural component measures and all-cause mortality. Models were adjusted for sex, ethnicity, Townsend index, month of assessment, smoking, alcohol, physical activity, BMI, long-term condition count, and mutually for each of the functional and structural component measures. Functional isolation defined as either never able to confide or often feels lonely. Structural isolation defined as having < monthly friends and family visits or not engaging in weekly group activity or living alone
Functional component measures—combined associations and interactions (RQ1)
Models examining the combined associations (Additional file 1: Table S4) and interactions (Additional file 1: Table S5) between the frequency of ability to confide and often feeling lonely for adverse health outcomes did not provide clear evidence for interaction on either multiplicative or additive scales. Based on the pattern of their independent and mutually adjusted associations across both outcomes (Table 4), we combined both measures into a new dichotomous functional isolation variable, with isolation coded as reporting either never able to confide, often feeling lonely, or both. Compared to those with no functional isolation (self-reporting able to confide at least every 3 months and not often lonely), participants with functional isolation were associated with higher all-cause and CVD mortality: HR 1.08 (1.06–1.11) and 1.16 (1.09–1.23) (Table 4 and Fig. 1).
Structural component measures—independent associations (RQ2)
Fully adjusted models of associations between the frequency of friends and family visits and all-cause mortality showed that participants who reported visits with friends and family less often than once a month were associated with substantially higher risk of all-cause mortality: HRs (95% CI) for once every 3 months and never were 1.11 (1.05–1.17) and 1.39 (1.30–1.49), respectively (Table 5 and Fig. 1). The same pattern was observed for CVD mortality but with stronger associations and wider confidence intervals (Table 5). Compared with those who reported engaging in weekly group activity, those who reported not engaging in weekly group activity had higher all-cause and CVD mortality: HRs (95% CIs) were 1.13 (1.11–1.16) and 1.10 (1.04–1.17), respectively (Table 5 and Fig. 1). Equivalent estimates for those who reported living alone, compared with those who lived with at least one other, were 1.25 (1.22–1.29) and 1.48 (1.38–1.57) (Table 5 and Fig. 1).
Structural component measures—combined associations and interactions (RQ2)
Frequency of friends and family visits and weekly group activity
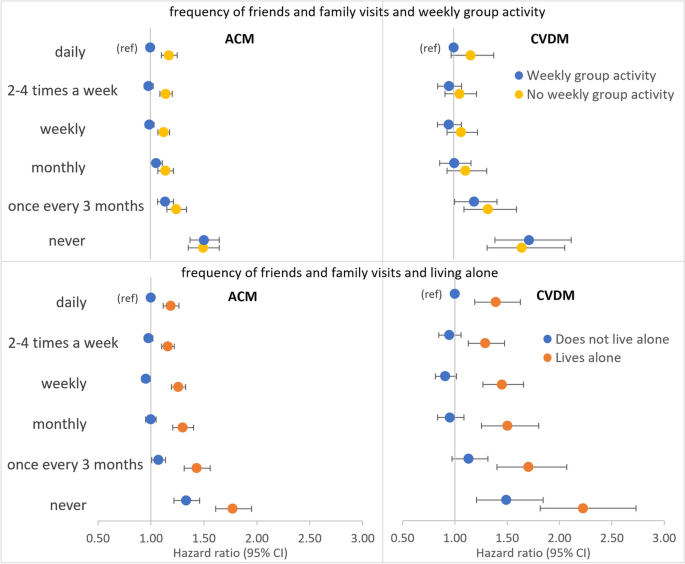
Models of combined associations between frequency of friends and family visits and weekly group activity (reference group of daily friends and family visits and engaging in weekly group activity) showed higher all-cause mortality associated with never having friends and family visits irrespective of whether participants reported engaging in weekly group activity (HR 1.50 [1.37–1.64]) or not (HR 1.49 [1.36–1.65]) (Fig. 2 and Additional file 1: Table S6). A similar pattern was present for CVD mortality (Fig. 2 and Additional file 1: Table S6). There was a lack of evidence for an interaction between the two exposures of friend and family visit frequency (≥ monthly versus < monthly) and weekly group activity for both all-cause and CVD mortality (Additional file 1: Table S7).
Models of combined associations between frequency of friends and family visits, weekly group activity or living alone, and all-cause (ACM) or CVD mortality (CVDM). Models adjusted for sex, ethnicity, Townsend index, month of assessment, smoking, alcohol intake, physical activity level, body mass index, long-term condition count, and mutually for weekly group activity, living alone, and functional isolation
Frequency of friends and family visits and living alone
Combined associations between frequency of friends and family visits and living alone (reference group of daily friends and family visits and not living alone) showed those who reported living alone had markedly stronger associations with each of the adverse health outcomes at every level of friend and family visit frequency (Fig. 2 and Additional file 1: Table S8). For example, compared with daily friends and family visits and not living alone, all-cause mortality HRs for those who reported never having friends and family visits were 1.33 (1.22–1.46) in those not living alone and 1.77 (1.61–1.95) in those living alone. Tests for interaction provided some evidence for a multiplicative interaction between friend and family visit frequency and living alone for all-cause (HR 1.11 [1.03–1.20]) but less so for CVD mortality (HR 1.07 [0.90–1.27]) (Additional file 1: Table S9). However, tests were suggestive of an additive interaction for CVD mortality (RERI 0.27 [− 0.01, 0.57]; AP 0.13 [− 0.02, 0.25]; SI 1.35 [0.99, 1.86]). This was consistent with the markedly higher HRs for CVD mortality in those never having friends and family visits who also lived alone (HR 2.23 [1.82–2.73]) compared with those never having friends and family visits but not living alone (HR 1.49 [1.21–1.84]) (Additional file 1: Table S8). In view of the evidence for interaction, stratified models were performed. Examining participants who reported not living alone and living alone separately showed that the relative association with all-cause mortality of never having friends and family visits, compared to daily visits, was very similar in those living alone HR (1.40 [1.26–1.55]) as when the same comparison was made in those not living alone (HRs 1.36 [1.24–1.50]) (Additional file 1: Table S10). The same pattern was seen for CVD mortality (Additional file 1: Table S10). This is consistent with a stronger independent association with adverse health outcomes for never having friends and family visits compared with living alone (Table 5 and Fig. 1).
Weekly group activity and living alone
Combined associations between weekly group activity and living alone (reference group of [yes] engaging in weekly group activity and not living alone) showed those who reported living alone had markedly stronger associations with each of the adverse health outcomes whether they engaged in weekly group activity or not (Additional file 1: Table S11). For example, compared with those who reported engaging in weekly group activity and not living alone, all-cause mortality HRs for those who reported no weekly group activity were 1.11 (1.08–1.14) in those not living alone and 1.46 (1.40–1.52) in those living alone. Tests for interaction provided some evidence for a multiplicative interaction between weekly group activity and living alone for all-cause (HR 1.07 [1.02–1.13]) but less so for CVD mortality (HR 1.05 [0.93–1.19]) (Additional file 1: Table S12). However, tests were more suggestive of an additive interaction for CVD mortality (RERI 0.12 [− 0.06, 0.30]; AP 0.07 [− 0.04, 0.17]; SI 1.23 [0.90, 1.67]). Models stratified by living alone showed that, compared with those who reported engaging weekly group activity, the association with all-cause mortality for those not engaging in weekly group activity was higher among those living alone (HR 1.19 [1.14–1.25]) than when the same comparison was made among those not living alone (HRs 1.11 [1.08–1.14]) (Additional file 1: Table S13). The same pattern was seen for CVD mortality (Additional file 1: Table S13).
Frequency of friends and family visits, weekly group activity, and living alone combined
Based on the pattern of their independent associations with both adverse health outcomes, we combined all three structural component measures into an overall dichotomous structural isolation variable, with isolation coded as < monthly friends or family visits, or not engaging in weekly group activity, or living alone. Compared to those without, participants with structural isolation were associated with higher all-cause and CVD mortality: HR 1.23 (1.20–1.26) and 1.35 (1.28–1.43) (Table 4 and Fig. 1).
Functional and structural component measures—combined associations and interactions
Frequency of ability confide, often feeling lonely, and structural isolation (RQ3)
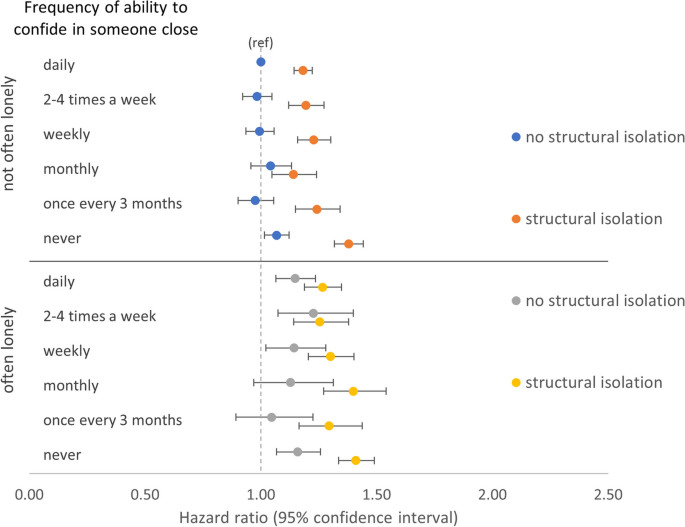
Examining the combined associations between the two functional component measures, structural isolation, and all-cause mortality showed that, when structural isolation was present, reporting never being able to confide was associated with similarly higher all-cause mortality regardless of often feeling lonely (HR 1.41 [1.34–1.49]) or not (HR 1.38 [1.32–1.44]) (Fig. 3 and Additional file 1: Table S14). However, when structural isolation was absent, there was a greater difference in all-cause mortality associated with reporting never able to confide between those reporting often feeling lonely (HR 1.16 [1.07–1.26]) versus those reporting not often lonely (HR 1.07 [1.02–1.12]). A similar pattern was present for CVD mortality but with stronger associations and wider confidence intervals (Additional file 1: Fig. S2 and Table S14).
Frequency of friends and family visits, weekly group activity, living alone, and functional isolation (RQ3)
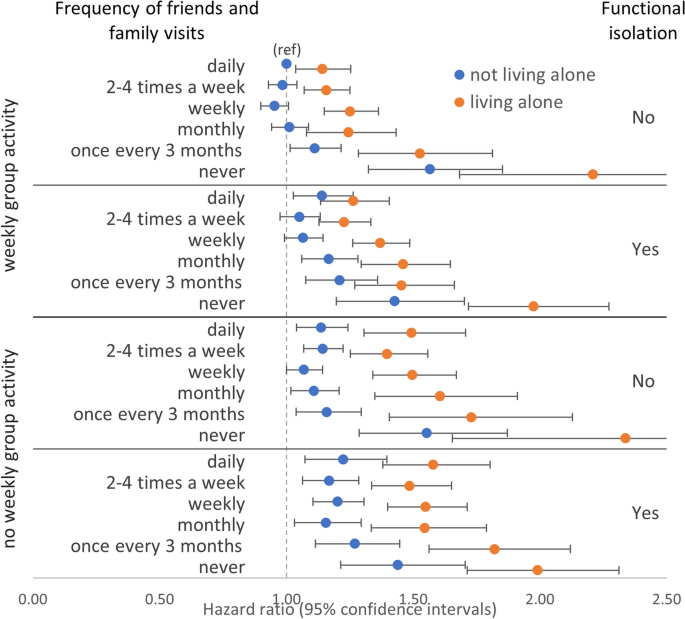
Joint associations between all three structural component measures and functional isolation showed that, compared to the reference group of those who reported daily friends and family visits, weekly group activity, not living alone, and without functional isolation, generally, there was a dose–response relationship where the addition of any of the three structural component measures or the addition of functional isolation was associated with higher all-cause mortality (Fig. 4 and Additional file 1: Table S15). The highest all-cause mortality was observed in those who reported never having friends and family visits, not engaging weekly group activity, and living alone, but without functional isolation (HR 2.34 [1.65–3.30]). However, at this maximal level of structural isolation, there were relatively few participants without functional isolation (n = 170) leading to wide confidence intervals in this group and complete overlap with the estimate for otherwise equivalent participants but who did report functional isolation (HR 1.99 [1.71–2.31]). Similarly, there were comparable estimates with wide and almost completely overlapping confidence intervals for those who reported never having friends or family visits and living alone, but who also reported engaging in weekly group activity, either with functional isolation (HR 1.98 [1.72–2.27]) or without functional isolation (HR 2.21 [1.68–2.90]). A similar pattern was present when CVD mortality was modelled as the outcome but with wider confidence intervals making interpretations more challenging (Additional file 1: Fig. S3 and Table S15). Overall, this is consistent with the larger independent effects of never having friends and family visits and living alone compared with weekly group activity or functional isolation (Fig. 1).
Furthermore, in all categories of each of weekly group activity (yes/no), living alone (yes/no), and functional isolation (yes/no), there was incrementally lower all-cause mortality associated with increasing frequency in friends and family visits up to a level of monthly with further increases in frequency in friends and family visits being associated with similar levels of all-cause and CVD mortality (Fig. 4 and Additional file 1: Table S15). This is consistent with the independent effect of frequency of friends and family visits (Table 5) where visit frequencies less than monthly were associated with adverse health outcomes. This suggests there may be a threshold effect for this type of social contact above or below which the health benefits may be felt or not.
In those not living alone and with no functional isolation, not engaging in weekly group activity was associated with higher all-cause mortality compared to engaging in weekly group activity at each level of friends and family visit frequency apart from those who reported never having friends and family visits where the mortality was similar (Fig. 4). The same was true in those not living alone but with functional isolation and the pattern was more striking still in those reporting living alone.
Functional and structural isolation (RQ4)
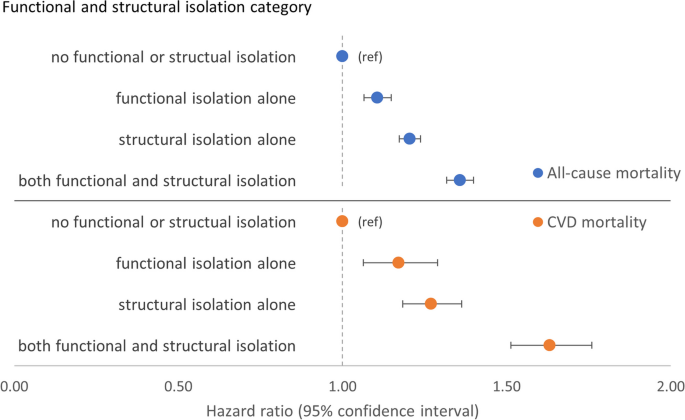
Combined associations of functional and structural components overall showed, compared to those with neither functional nor structural isolation, there was higher all-cause mortality associated with structural isolation alone (HR 1.21 [1.17–1.24]) than with functional isolation alone (HR 1.11 [1.06–1.15]) (Fig. 5 and Additional file 1: Table S16). However, participants with both components of isolation were associated with the highest all-cause mortality (HR 1.36 [1.32–1.40]). Consistent with this were results from tests for interaction which suggested an additive interaction: RERI 0.05 [− 0.01, 0.10], AP 0.03 [− 0.01, 0.07], and SI 1.15 [0.97, 1.37] (Additional file 1: Table S17). The pattern was accentuated for CVD mortality and there was evidence of an additive interaction (Fig. 5 and Additional file 1: Tables S16 and S17).
Sensitivity analyses
Similar results were seen across all sensitivity analyses where we excluded those with prior CVD or cancer or who died within 2 years of recruitment, albeit often with stronger associations and wider confidence intervals (Additional file 2: Tables S18-S35).





Add Comment