DEGs between SLE and control samples
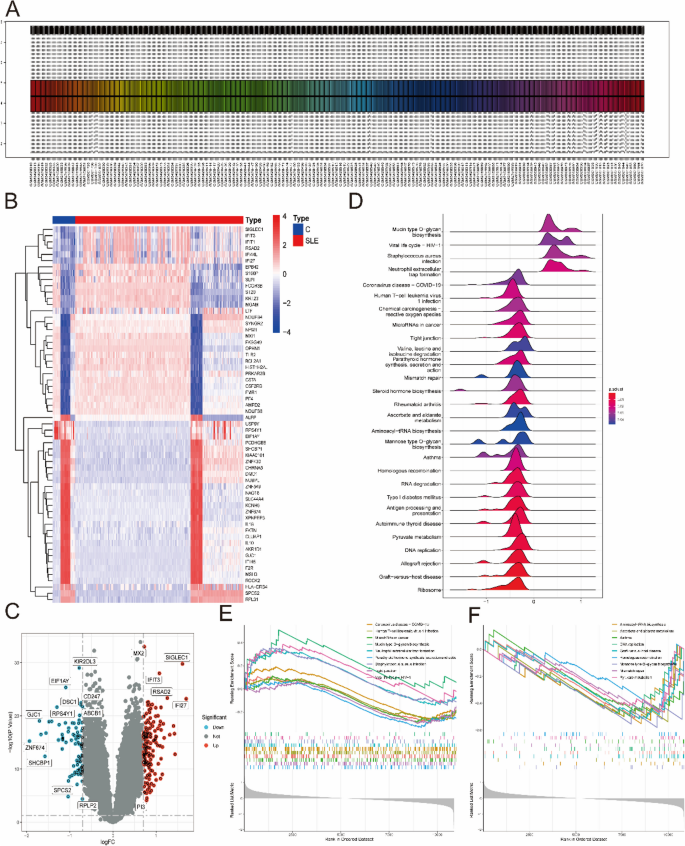
From the GEO database, three microarray datasets, including the GSE121239, GSE81622 and GSE11907 datasets, were combined to obtain a total of 57 control and 425 SLE samples. After the batch effect was removed (Fig. 2A), 242 DEGs (Supplementary Table 3) were identified, including 87 downregulated genes and 155 upregulated genes (Fig. 2B). As shown in Fig. 2C, some genes, such as KIR2DL3, EIF1AY, CD247, ABCB1, DSC1, RPS4Y1, GJC1, ZNF674, SHCBP1, SPCS2, and RPLP2, were significantly upregulated, while some genes were significantly downregulated, such as MX2, SIGLEC1, IFIT3, RSAD2, IFI27, and PI3. Next, GSEA of KEGG was performed to select the enriched signaling pathways (Supplementary Table 4). The changes in metabolism-related genes in SLE, such as pyruvate metabolism, DNA replication and RNA degradation were displayed (Fig. 2D). Notably, mucin type O-glycan biosynthesis, microRNAs in cancer, and tight junctions were significantly enriched in the SLE group (Fig. 2E). However, DNA replication, aminoacyl-tRNA biosynthesis and mismatch repair were significantly enriched in the control group (Fig. 2F).
Identification of DEGs between SLE and control samples. A The expression level of genes from these datasets after the batch effect removed. B The heatmap of SLE-related DEGs expression: blue means low gene expression; red means high gene expression. C The volcano plot of SLE-related DEGs expression. D The ridgeline map of gene metabolism in SLE. E, F The main signaling pathways that are significantly enriched in the SLE group (E), and in the control group (F)
Application of WGCNA
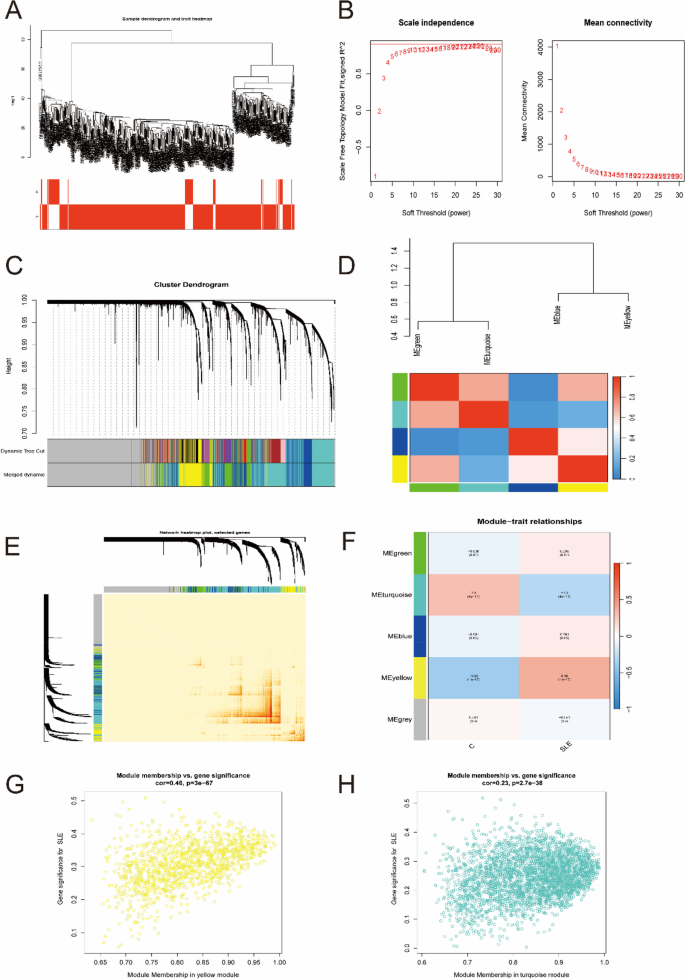
The coexpression network was established by WGCNA. A total of 11,256 genes were selected for clustering, and obviously abnormal samples were excluded by setting thresholds (Fig. 3A). Then, when R2 = 0.9 and the average connectivity was high, the soft power threshold was set to 25 (Fig. 3B). After the associated modules were integrated, five modules were obtained. The initialized and integrated modules were finally shown under the clustering tree (Fig. 3C). No significant correlation between the modules was observed (Fig. 3D). In addition, the transcriptional correlation analysis revealed that there was also no relationship between them (Fig. 3E). The frontal correlation was applied to examine the correlation between clinical features and ME values, and the results showed that yellow and blue modules were significantly correlated with SLE (R = 0.46, P < 3e-67; R = 0.23, P < 2.7e-38) (Fig. 3F-H). In the yellow and turquoise modules, a total of 4348 candidate genes were obtained in the subsequent analysis (Supplementary Table 5).
Weighted gene co-expression network analysis. A Sample clustering dendrogram with tree leaves corresponding to individual samples. B The scale-free fitting index (R2) and average connectivity at different soft threshold power were analyzed. C The initialized and integrated modules under the clustering tree. D Collinear heat map of module key genes. Red means a high correlation, blue means a low correlation. E Clustering dendrogram of module key genes. F Heat map of module–trait correlations. Red indicates a positive correlation and blue indicates a negative correlation. G, H The frontal correlation between clinical features and yellow module (G), and turquoise module (H)
Functional enrichment analysis of overlapping genes
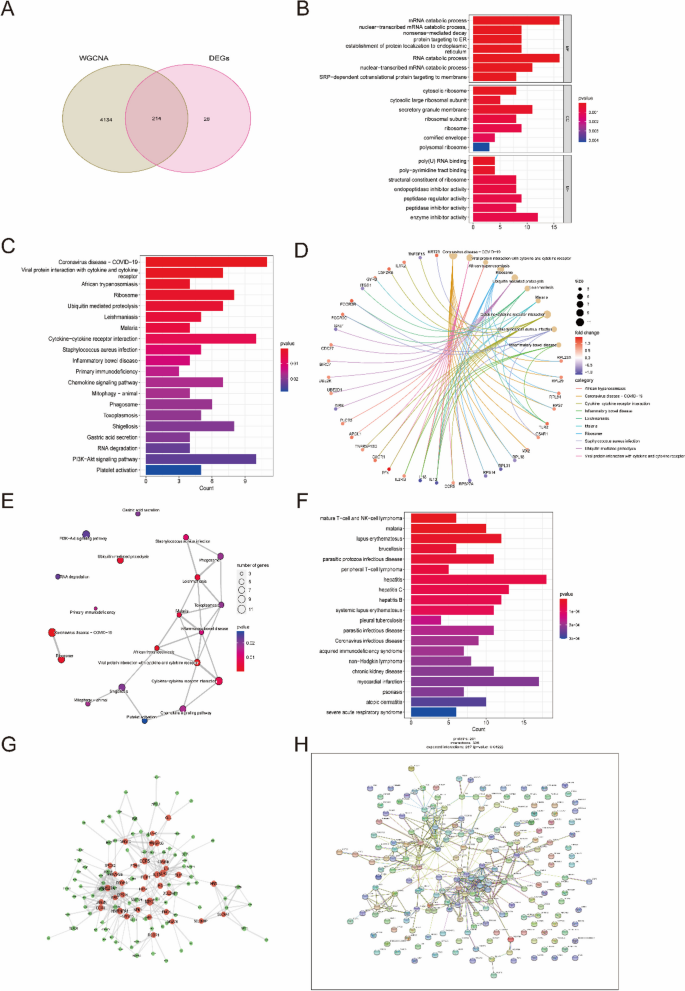
A total of 214 candidate key genes were selected from the DEGs, yellow and turquoise modules (Supplementary Tables 6 and Fig. 4A). To explore the potential biological function and enrichment pathways, GO, KEGG, and DO analyses were performed on these candidate key genes. In the GO analysis, the candidate key genes were significantly enriched in the mRNA catabolic process, RNA catabolic process and nuclear-transcribed mRNA catabolic process for the biological process (BP) category. For the cellular component (CC) category, the genes were significantly enriched in cytosolic ribosome, secretory granule membrane and ribosome. The molecular function (MF) category was significantly enriched in poly-pyrimidine tract binding, endopeptidase inhibitor activity and enzyme inhibitor activity (Fig. 4B). In addition, the KEGG enrichment analysis showed that these overlapping genes were particularly related to ribosomes, ubiquitin-mediated proteolysis, leishmaniasis, malaria and cytokine-cytokine receptor interactions (Fig. 4C-E). The DO analysis showed that they were mainly enriched in hepatitis, systemic lupus erythematosus and malaria (Fig. 4F).
Functional enrichment analysis of overlapping genes. A Venn diagram showed the intersection of DEGs and module genes of WGCNA. B–F GO (B), KEGG (C–E), and DO (F) enrichment analysis of the overlapping genes. G Protein-Protein Interaction (PPI) network of overlapping genes. H The co-expression network showed the strength of correlation of hub genes from overlapping genes. Additionally, the appropriate copyright permission of these KEGG image was obtained and used in this study
The results of these functional enrichment analyses indicated that SLE patients may share common immune processes with other diseases. To further reveal protein-protein interactions in SLE, PPI networks of candidate key genes were also analyzed (Fig. 4G, H). In general, these candidate key genes are closely related to each other and play pivotal roles in the pathogenesis of SLE.
Further identification of optimal key genes through machine-learning algorithms
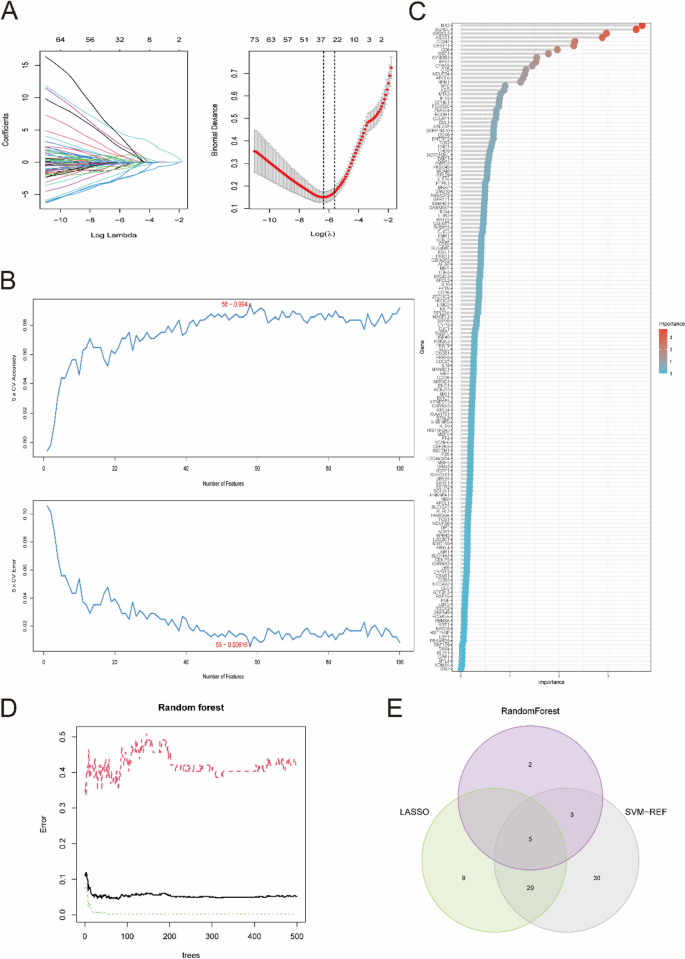
To further explore the key genes, three machine-learning algorithms were performed. According to the 214 candidate key genes obtained above, 34 key genes were further selected as diagnostic markers of SLE by the LASSO algorithm (Fig. 5A and Supplementary Table 7). In addition, 58 key genes were screened after fivefold cross-validation of 214 genes using the SVM-REF algorithm (Fig. 5B and Supplementary Table 8). For the RF algorithm, the top 10 key genes with importance > 2 were identified, consisting of MX2, SQRDL, RFTN1, KIR2DL3, ABCB1, RPS14, CD247, CHST11, CD6 and DSC1 (Fig. 5C, D). Finally, all the key genes obtained by these machine-learning algorithms overlapped again, and the 5 optimal key genes were screened out, consisting of ABCB1, CD247, DSC1, KIR2DL3 and MX2, which were regarded as potential targets of SLE (Fig. 5E).
Three machine learning algorithms were applied to further explore the optimal key genes. A The LASSO algorithm determined the candidate optimal feature genes and the optimal lambda. Each coefficient curve in the left picture represents a single gene. The dashed vertical lines in the right picture represent the partial likelihood deviance. B The SVM-RFE algorithm was performed to further candidate optimal feature genes with the highest accuracy and lowest error obtained in the curves. C Top 10 key genes with importance > 2 were identified in the Random Forest algorithm. D Random forest for the relationships between the number of trees and error rate. E Venn diagram displayed the five optimal key genes overlapped by LASSO, Random Forest, and SVM-REF algorithms
Evaluation of the expression and diagnostic value of optimal key genes
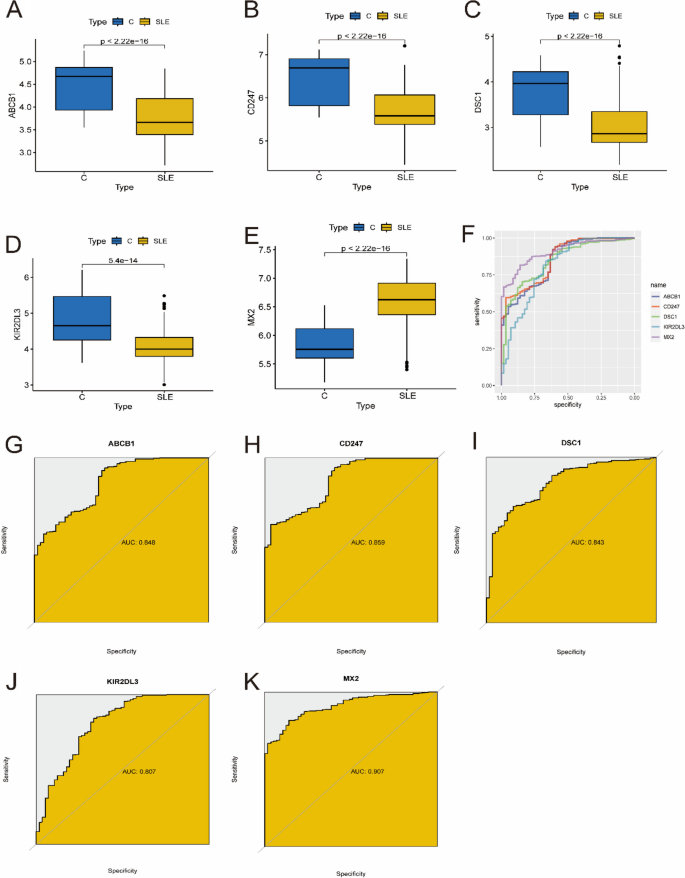
The expression of five optimal key genes was further analyzed in 425 SLE samples and 57 normal samples. In Fig. 6A-E, the expression of ABCB1, CD247, DSC1 and KIR2DL3 was significantly downregulated in SLE samples, while the expression of MX2 was significantly upregulated, indicating that they might have critical roles in the development of SLE (all P < 0.01). In addition, ROC curve analysis was performed to assess the diagnostic value of the optimal key genes (Fig. 6F). The AUC values of the ROC curves were 0.848 for ABCB1 (Fig. 6G), 0.859 for CD247 (Fig. 6H), 0.843 for DSC1 (Fig. 6I), 0.807 for KIR2DL3 (Fig. 6J), and 0.907 for MX2 (Fig. 6K), indicating that the five key genes have high diagnostic value in evaluating the progression of SLE.
Verification of expression and diagnostic efficacy of optimal key genes in predicting SLE progression. A–G Box plots showing the expression of ABCB1 (A), CD247 (B), DSC1 (C), KIR2DL3 (D) and MX2 (E) in control and SLE samples. Statistic tests: Wilcoxon rank-sum test. F–K Roc curves (F) estimating the diagnostic performance of ABCB1 (G), CD247 (H), DSC1 (I), KIR2DL3 (J) and MX2 (K)
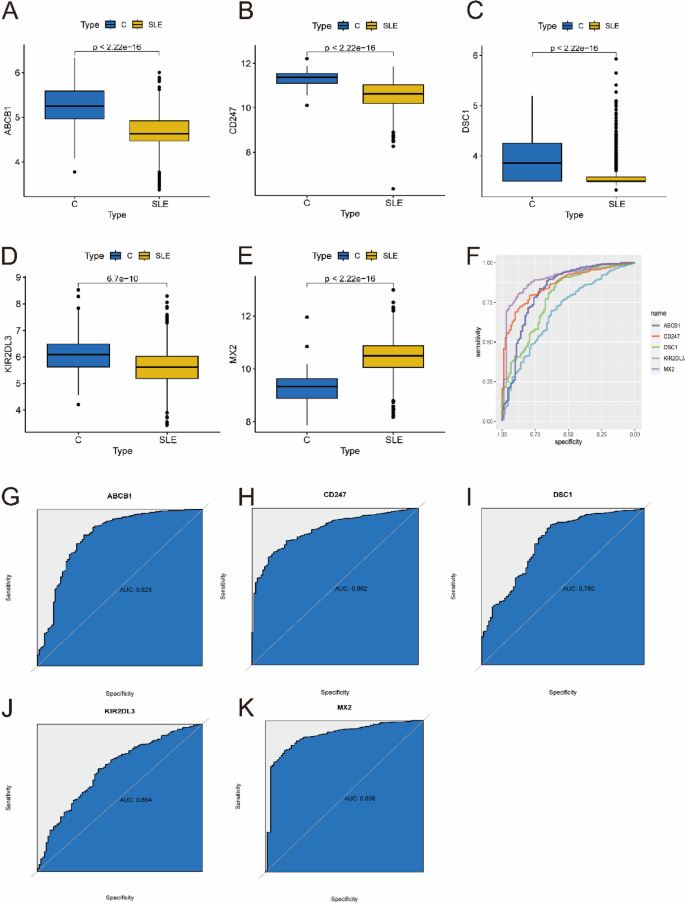
To obtain more reliable results, the optimal key genes were further verified in an external validation dataset consisting of 1081 SLE samples and 92 control samples. Before analysis, the GSE65391 and GSE49454 datasets were normalized (Supplementary Fig. 1). Fortunately, the expression of 5 optimal key genes in SLE samples was consistent with the above results (Fig. 7A-E, all P < 0.05). The diagnostic value of these genes was assessed by ROC curve analysis (Fig. 7F). The AUC values of the external validation datasets were also high: ABCB1 (AUC: 0.825), CD247 (AUC: 0.862), DSC1 (AUC: 0.780), KIR2DL3 (AUC: 0.694), MX2 (AUC: 0.898) (Fig. 7G–K). Therefore, these results again prove that all the optimal key genes are related to SLE.
Verification of expression and diagnostic efficacy of optimal feature genes using external validation datasets. A–G Box plots showing the expression of ABCB1 (A), CD247 (B), DSC1 (C), KIR2DL3 (D) and MX2 (E) in control and SLE samples. Statistic tests: Wilcoxon rank-sum test. F–K Roc curves (F) estimating the diagnostic performance of ABCB1 (G), CD247 (H), DSC1 (I), KIR2DL3 (J) and MX2 (K)
Identification of the biological function of five key genes
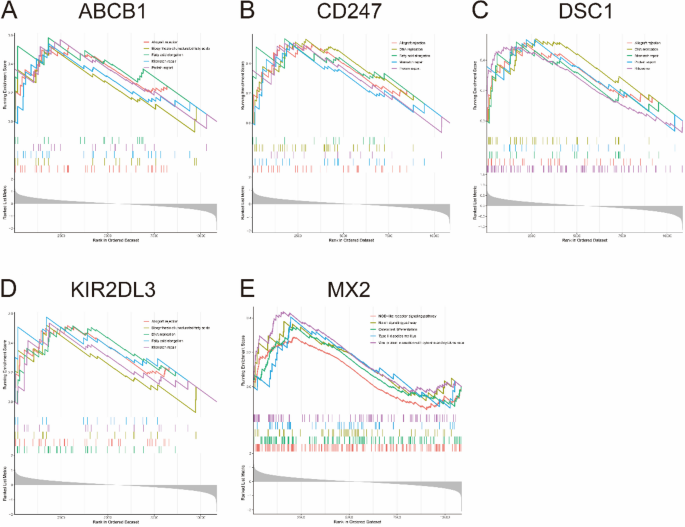
To clarify the biological functions of the five optimal key genes, GSEA was employed. According to the median expression levels of these genes, SLE samples were segmented into two groups. In addition, immune-related pathways such as allograft rejection, mismatch repair, and protein export were significantly enriched in the high ABCB1 subgroup (Fig. 8A), but pathways such as osteoclast differentiation and type II diabetes mellitus were enriched in the low ABCB1 subgroup (Supplementary Fig. 2A). DNA replication, fatty acid elongation, mismatch repair, and protein export were significantly enriched in the high CD247 subgroup (Fig. 8B), but arachidonic acid metabolism and type II diabetes mellitus were significantly enriched in the low CD247 subgroup (Supplementary Fig. 2B). Allograft rejection, DNA replication, mismatch repair, protein export and ribosome were significantly enriched in the high DSC1 subgroup (Fig. 8C), but glycerophospholipid metabolism, notch signaling pathway, and viral protein interaction with cytokine and cytokine receptor were significantly enriched in the low DSC1 subgroup (Supplementary Fig. 2C). Allograft rejection, fatty acid elongation, and mismatch repair were significantly enriched in the high KIR2DL3 subgroup (Fig. 8D), but measles, type II diabetes mellitus, and viral protein interaction with cytokine and cytokine receptor were significantly enriched in the low KIR2DL3 subgroup (Supplementary Fig. 2D). The NOD-like receptor signaling pathway, notch signaling pathway and osteoclast differentiation were significantly enriched in the high MX2 subgroup (Fig. 8E), but fatty acid elongation, mismatch repair and protein export were enriched in the low MX2 subgroup (Supplementary Fig. 2E).
Immune cell infiltration analysis
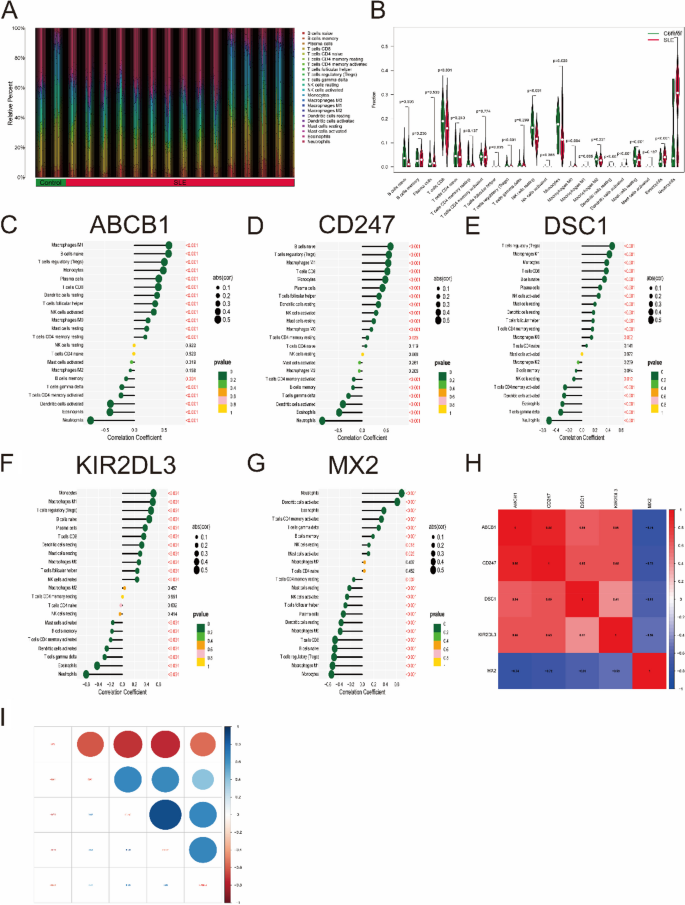
The CIBERSORT algorithm was used to evaluate the differences in immune cell infiltration and hallmark gene sets between the SLE and control groups. As shown in Fig. 9A, B, the proportions of naive B cells, regulatory T cells (Treg cells), monocytes, M0/M1 macrophages, eosinophils and neutrophils in SLE samples were significantly increased compared with those in control samples, while the percentages of CD8 T cells, NK cells, dendritic cells and resting mast cells were significantly decreased.
Analysis of immune cell infiltration. A The relative percent of 22 immune cells types between control samples and SLE samples. B Boxplot shows the differences of infiltrated immune cells between control samples and SLE samples. Statistic tests: Wilcoxon rank-sum test. (P < 0.05*; P < 0.01**; P < 0.001***; ns, no significance). C–G Correlation between immune cells and optimal key genes ABCB1 (C), CD247 (D), DSC1 (E), KIR2DL3 (F) and MX2 (G). H, I Correlation analysis of five optimal key genes in SLE samples
Furthermore, correlation analysis revealed that four optimal key genes (ABCB1, CD247, DSC1, and KIR2DL3) were significantly positively related to the infiltration of monocytes, M0/M1 macrophages, Treg cells, CD8 T cells, resting dendritic cells and resting mast cells but negatively related to the infiltration of activated memory CD4 T cells, activated dendritic cells, eosinophils and neutrophils (Fig. 9C-F). However, the MX2 gene is roughly the opposite of the above four genes (Fig. 9G). For instance, the ABCB1 gene was positively related to M1 macrophages (R = 0.58, P < 2.2e-16) but negatively related to neutrophils (R = − 0.74, P < 2.2e-10) (Supplementary Fig. 3). In Fig. 9H, I, gene correlations were also performed. These five optimal key genes displayed significant correlations. For example, the correlation coefficient between ABCB1 and CD247 was 0.88, but the correlation coefficient between ABCB1 and MX2 was − 0.74, indicating that four optimal key genes (ABCB1, CD247, DSC1 and KIR2DL3) had a significant functional similarity, while the function of MX2 gene was opposite to the remaining four genes.
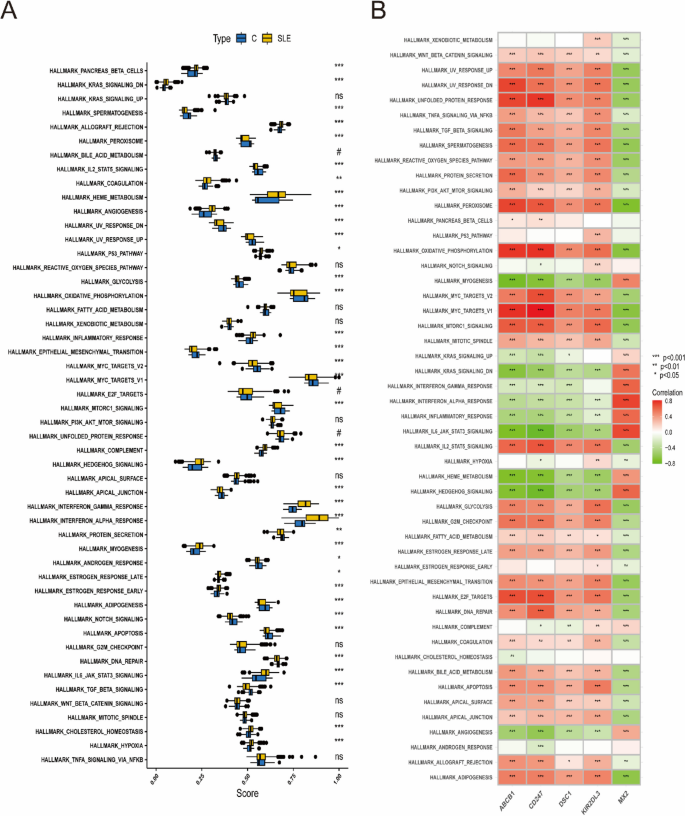
To explore whether there were differences in the hallmark gene sets between the SLE and control groups, the ssGSEA algorithm was used to identify the significance of differences in 50 hallmark gene sets between the two groups according to the enrichment score. The distribution between the SLE and control groups is shown in Fig. 10A.
The gene sets showed significant differences, such as allograft rejection, coagulation, heme metabolism, angiogenesis, P53 pathway, inflammatory response and hypoxia. Hence, compared with the control group, these hallmark gene sets might be overactivated in the SLE group. In addition, four optimal key genes except for MX2 were generally consistent. For example, the four optimal key genes (ABCB1, CD247, DSC1, KIR2DL3) were positively related to the oxidative phosphorylation hallmark gene set, while MX2 was negatively related to it (Fig. 10B). Therefore, the role of the above genes should be further explored in SLE.
Validation of the five optimal key genes
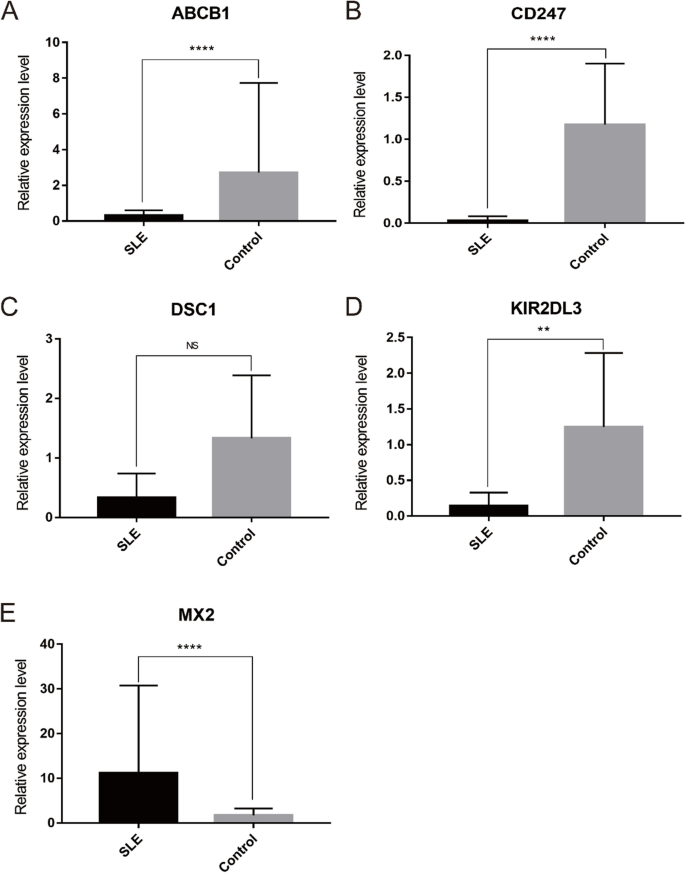
The relative expression of five optimal key genes was verified with RT-qPCR in SLE patients and healthy controls. Compared with the control group, the expression of ABCB1 (Fig. 11A), CD247 (Fig. 11B), and KIR2DL3 (Fig. 11D) was significantly downregulated, while MX2 (Fig. 11E) was significantly upregulated in SLE patients (all P < 0.05), which was consistent with the results of this bioinformatic analysis. However, the expression of DSC1 (Fig. 11C) was also downregulated in SLE samples, although there was no statistical significance (P >0.05).



Add Comment