

Patient characteristics
The data of 1,209 patients were formed as our training and validation sets, including 672 patients from moderate COVID-19 and 537 from severe COVID-19. The patient characteristics in training and validation sets are listed in Table 1. No significant differences were observed between the training and validation set in sex (P = 0.238). IL-6, WBC, L, N, CRP, PCT, PT, DD, BS, AST, ALB, D-Bil, BNP, LDH, and CK-MB differed significantly between moderate and severe pneumonia sets both in training and validation sets (P < 0.05).
Adrenal gland and periadrenal fat auto-segmentation framework
For adrenal gland segmentation, we manually delineated bilateral adrenal glands from the CT images of 315 patients; 265 were used for training. The remaining data from 50 patients were used to evaluate the performance. The segmentation model yielded average Dice values of 79.48% for the left and 78.55% for the right adrenal gland. The entire adrenal gland achieved an average Dice value of 79.02%. Representative auto–segmentation results are shown in Fig. 3. The segmentation algorithm was then used to segment all the remaining data automatically.

The comparison of auto-segmentation results and ground truth on representative cases from the training set. The upper line shows the ground truth, and the lower line shows the auto-segmentation results. The green color shows the right adrenal glands, whereas red denotes the left. Yellow shows right periadrenal fat, and purple shows left
Radiomics feature and clinical indicator selection
In the training set, the number of radiomics features was reduced to 23 for building AM that included 8 first-order features and 15 texture features (Gray Level Co-occurrence Matrix [GLCM] = 3, Gray Level Size Zone Matrix [GLSZM] = 8, Gray Level Run Length Matrix [GLRLM] = 2 and Gray Level Dependence Matrix [GLDM] = 2); 68 for PM that included 11 first-order features, 2 sharp feature, and 55 texture features (GLCM = 13, GLSZM = 25, GLRLM = 7, GLDM = 9 and Neighboring Gray Tone Difference Matrix [NGTDM] = 1) and 82 for FM that included 12 first-order features and 70 texture features (GLCM = 17, GLSZM = 38, GLRLM = 3, GLDM = 5 and NGTDM = 7). These features were evaluated to construct three radiomics models.
A total of 30 clinical factors and serum biomarkers were analyzed in our study. Next, univariate logistic regression analysis selected 17 clinical factors and serum biomarkers. They are LDH, CRP, age, ALB, L, N, Hb, RBC, DD, BS, WBC, CK_MB, TT, BUN, AST, TP, PT. and 7 indicators, LDH, L, HB, DD, WBC, TT, and TP, were selected using multivariate logistic regression analysis. The relationship between RadScore from FM used in constructing a radiomics nomogram (RN) and 30 clinical factors plus serum biomarkers were analyzed using Pearson correlation between training, validation, and test sets (Fig. 4). The difference in RadScores with clinical factors or serum biomarkers was not significant. Then, 17 clinical factors and serum biomarkers were selected using univariate logistic regression analysis, and 7 indicators, LDH, L, HB, DD, WBC, TT, and TP, were selected using multivariate logistic regression analysis.

Correlation heatmap in training, validation, and test set. FM = fusion of adrenal gland and periadrenal fat model; CM = clinical model; RN = radiomics nomogram
Three radiomics models and clinical model building
We developed three radiomics models (AM, PM, FM) based on radiomics features and a clinical model (CM) based on the seven selected independent predictive clinical indicators. We used three evaluation indicators (area under the curve [AUC], 95% CI, sensitivity [SEN], and specificity [SPE]) to assess AM, PM, FM, and CM for predicting the progression of patients with COVID-19 in training, validation, and test sets. In general, AM achieved an AUC of 0.692, 0.714, and 0.659 in the training set, validation set, and test set, respectively; PM achieved an AUC of 0.764, 0.736, and 0.645; FM achieved an AUC of 0.791, 0.760 and 0.686; CM obtained an AUC of 0.712,0.717 and 0.692 (Fig. 5, supplementary Table 2).

ROC curves in training, validation, and test sets. AM = adrenal gland model; PM = periadrenal fat model; FM = fusion of adrenal gland and periadrenal fat model; CM = clinical model; RN = radiomics nomogram
Box plots summarizing the RadScores and coefficients of seven clinical indicators in training, validation, and test sets directly demonstrate the difference between RadScore and coefficients of seven clinical indicators between the moderate and severe patient sets (Fig. 6).

Box plots summarizing rad score and 7 clinical indicators between moderate and severe patient sets in training, validation, and test sets. In each box plot, the horizontal line crossing the box is the median, and the bottom and top are the lower and upper quartiles. FM = fusion of adrenal gland and periadrenal fat model; CM = clinical model; RN = radiomics nomogram; LDH = lactate dehydrogenase; L = lymphocyte count; Hb = hemoglobin, DD = D dimer; WBC = white blood cells count; TT = thrombin time and TP = total protein
RN construction and validation
Multivariate analysis revealed that RadScore and seven clinical indicators were significant independent factors predicting disease progression in patients with COVID-19. We conducted collinearity diagnosis by calculating the VIF for variables in RN to detect multicollinearity among the radiomics nomogram variables, and the threshold was set to 10 [16,17,18]. Finally, the VIF value for the radiomics score and seven clinical indicators in RN ranged from 1.007 to 1.191, indicating no severe collinearity in these factors. Next, we used the RadScore from FM combined with seven clinical indicators to construct the RN to assess disease progression in patients with COVID-19 (Fig. 7). The RN showed satisfactory performance in predicting and assessing progression in patients with COVID-19 with an AUC of 0.806 (95% CI, 0.780 to 0.831) in the training set, 0.833 (95% CI, 0.780 to 0.878) in the validation set, and 0.773 (95% CI, 0.603 to 0.895) in the test set (Fig. 5, supplementary Table 2).
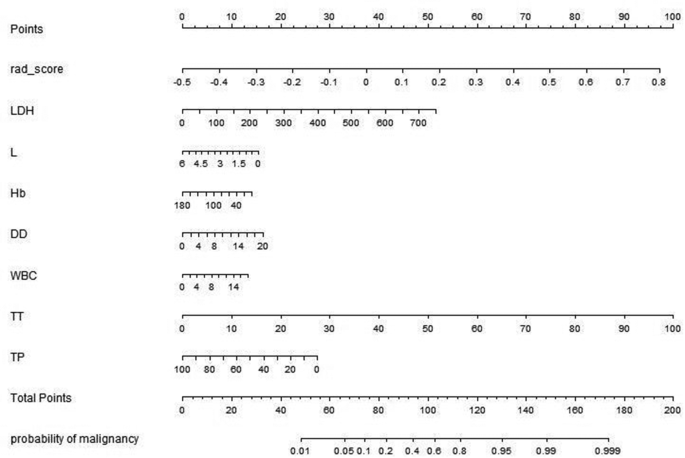
Radiomics nomogram developed in training set with radiomics features, lactate dehydrogenase (LDH), lymphocyte count (L), hemoglobin (Hb), D dimer (DD), white blood cells count (WBC), thrombin time (TT) and total protein(TP). Points are assigned for each variable by drawing a line upward from the corresponding variable to the Points line. The sum of points plotted on the total Points line corresponds with the severity of patients with COVID-19.
DeLong’s test was used to compare the AUCs of the training set’s three radiomics models, CM and RN. The result showed that the RN and FM were significantly better than CM (P < 0.0001). The difference between FM and RN was not statistically significant (P = 0.233) in the validation and test sets.
The Hosmer–Lemeshow test was not significant in the validation set (mean absolute error [MAE] = 0.075) or test set (MAE = 0.04), which suggests that there was no significant departure from actual values (Fig. 8). Decision curve analysis (DCA) (Fig. 9) showed that if the threshold probability was between 0.4 and 0.8 in the validation set, the RN could get more net benefits than FM and CM. If the threshold probability was between 0.3 and 0.7 in the test set, RN can still get more net benefits than FM and CM. The threshold cannot be set above 0.8; otherwise, the net benefit would become negative values.

Calibration curves of the radiomics nomogram for predicting the disease progression of COVID-19 pneumonia in validation set (A) and test set (B). The y-axis represents the probability of COVID-19 pneumonia becoming severe, and the x-axis represents the predicted risk. The dashed line was the reference line where an ideal nomogram would lie. The dotted line was the performance of the radiomics nomogram, while the solid line corrected for any bias in the radiomics nomogram. MAE is 0.04 in the validation set and 0.075 in the test set

Decision curve analysis (DCA) for the radiomic model, clinical model, and radiomics nomogram. The y-axis measures the net benefit. Using the clinical model, radiomic model, and radiomics nomogram in the study to predict COVID-19 pneumonia progress adds more benefit than the treat all patients as severity patients scheme or the treat none scheme. The net benefit of the radiomics nomogram was better than clinical and radiomic models in both sets, with several overlaps in the training set
Add Comment