In this study, a total of twenty-four large sow farms, all of equal size, were chosen. Each farm consisted of two mating herds and ten farrowing herds. Each mating house accommodated 1200 sows, while each farrowing house housed 60 sows, each with an average litter size of 10 piglets.
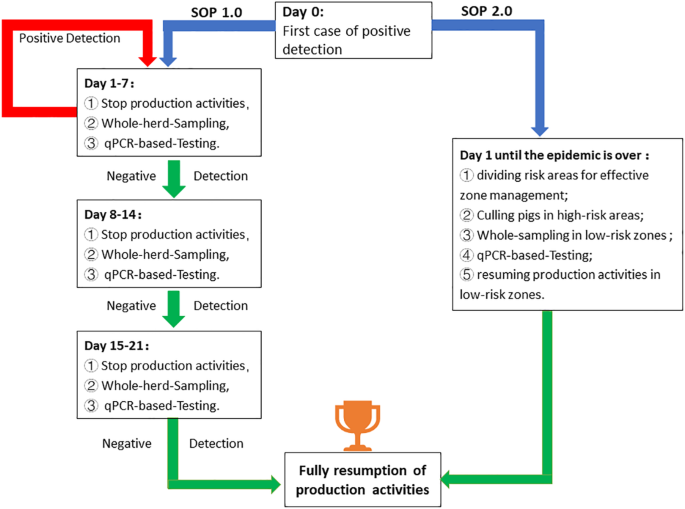
In previous approaches to managing outbreaks of ASFV, namely SOP 1.0 (Fig. 1), a facility-wide production cessation is enforced to contain the further transmission of the disease. Concurrently, a thorough detection and targeted eradication strategy is implemented, guided by the outcomes of qPCR testing conducted on the entire population. The incubation period of ASF typically spans from 3 to 19 days, with a maximum duration of 21 days [5, 6]. Consequently, the resumption of production activities can only occur following three consecutive rounds of comprehensive population testing, with each round comprising 7-day intervals. If an ASFV-positive sample is detected during this period, a new round of testing is initiated. In the context of practical production operations, we have identified an operational procedure, namely SOP2.0 (Fig. 1), which enables mating activities to be conducted during ASF outbreaks. This approach primarily entails the division of risk areas for effective zone management. The specific operational procedure is as followed. Firstly, upon discovering an ASFV-positive pig, immediate zone management is implemented for the pigsty. The high-risk zone includes the areas where the positive pig shares the same water trough and gutters with other pigs, as well as the areas managed by the same farmer in the past week. The remaining areas, sharing the same water trough and gutters, are defined as low-risk zones. Additionally, each zone consists of 120 pigs. Secondly, pigs within the high-risk zone are promptly isolated within 24 h following the outbreak, and their enclosures are treated with disinfectants, such as caustic soda. Thirdly, in low-risk zones, all pigs are subjected to tonsil swab testing, and if no positive results are detected, mating operations are recommenced. It is imperative to highlight that tonsil swab testing must be carried out on the entire pig population in low-risk zones prior to each mating operation. In contrast, the conventional procedure entails conducting a comprehensive herd testing on a weekly basis following an outbreak. Mating operations are only reinstated when the entire herd consistently yields negative results for a duration of three consecutive weeks.
Based on the aforementioned approaches, a comparative analysis was conducted on the prognosis outcomes of 24 herds that had encountered ASFV outbreaks. Out of these herds, 12 farms employed the SOP 1.0 method, while the remaining 12 farms implemented the SOP 2.0 method. The assessment primarily focused on several indicators, namely the days of epidemic disposal (DED), the overall count of positive detections, the retention rate, the NPD, the economic loss and the cost implications associated with the two approaches. The monetary value of RMB 5,500 per sow is determined based on the number of pigs present in these farms and the average price of pigs. Based on the number of pigs present in the farms and the average market value of pigs, specifically RMB 5,500 per sow and RMB 300 per piglet, the economic loss resulting from a 5% decrease in sow population can be calculated as 1200 × 2 × 5% × 5500, amounting to 660,000 RMB. Consequently, the formula for calculating the direct economic loss is expressed as follows: the economic loss (ten thousand yuan) = 66×N, where N equals (1 – the retention rate) divided by 5%. Additionally, considering the production rhythm of these farms, where 120 litters of piglets are slaughtered on a weekly basis, the economic loss incurred for each additional week of NPD can be determined as 120 × 10 × 300, equaling 360,000 RMB. Consequently, the formula for calculating the indirect economic loss is expressed as follows: the economic loss (ten thousand yuan) = 36×M, where M represents the NPD divided by 7 and multiplied by 36, with M being an integer.
Moreover, the evaluation of each approach also takes into account the associated expenses. As the disparity between SOP 1.0 and SOP 2.0 primarily lies in the methods used for disposing of mating herds, we solely consider the costs related to mating herds in this calculation. The expenses for disposal procedures mainly encompass the cost of sampling tools, labor expenses for sampling, testing fees for samples, and additional management costs. Sampling tools incur a cost of RMB 1 per pig. Each person’s labor cost for sampling amounts to RMB 2.5 per pig. The testing fee for each sample is RMB 6. Hence, the aggregate expenditure for sampling and testing per pig amounts to RMB 9.5. Within the SOP 1.0 disposal procedure, the primary expenses pertain to sampling and testing, encompassing a comprehensive herd examination on a weekly basis, while no supplementary costs are necessitated for management. Consequently, the formula for calculating the cost linked to SOP 1.0 for every farm is expressed as follows: the cost (ten thousand yuan) = 9.5 × 2400×WED (weeks of epidemic disposal) /10,000, wherein WED is derived from DED, and if its value is less than one week, it shall be considered as a week for calculation purposes.
Within the SOP 2.0 disposal procedure, the primary expenses are attributed to the costs associated with sampling, testing, and additional management. Firstly, it is necessary to determine the number of sows required for farrowing based on the mating week batches, which amounts to 120 sows. Assuming an average farrowing rate of 90%, the number of sows to be mated per week is calculated as 120/90%≈133, which are distributed across two zones. Consequently, a total of 240 pigs from the two zones must be sampled and tested on a weekly basis. Furthermore, the implementation of SOP 2.0 necessitates the allocation of additional labor resources to manage more independent zones to avoid cross-transmission of ASFV. Typically, the management of two mating herds necessitates the presence of eight individuals. However, in the context of SOP 2.0, these two herds are partitioned into twenty zones, thereby necessitating an additional twelve personnel. Each person is remunerated with a daily wage of RMB 200. Consequently, the formula for calculating the cost linked to SOP 2.0 for every farm is expressed as follows: the cost (ten thousand yuan) = (9.5 × 240×WED + 12 × 200×DED) /10,000.
All the data were subjected to statistical analysis using the unpaired t-test in the GraphPad Prism software (version 8.0).
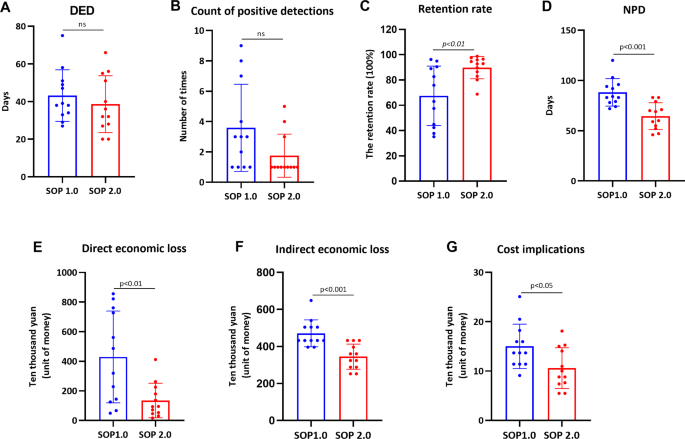
The results revealed that during the epidemic period, as shown in Fig. 2A, the average DED in farms following SOP 1.0 was 43 days, while in farms implementing SOP 2.0, it was 38 days, indicating a 5-day reduction in disposal time compared to SOP 1.0 (p>0.05). Secondly, farms adhering to SOP 1.0 exhibited a lower number of positive detections compared to farms implementing SOP 2.0 (p>0.05), suggesting that the implementation of zone managements effectively mitigated the risk of cross-contamination and virus spread within the farms (Fig. 2B). Thirdly, the retention rate of pigs in farms implementing SOP 2.0 exhibited a significant increase compared to those adhering to SOP 1.0 (p<0.01) (Fig. 2C), aligning with the findings of positive detections. This observation further implies a decrease in direct economic losses incurred from the culling of pigs due to the epidemic (Fig. 2E). Fourthly, the outcomes of NPD analysis demonstrated that the implementation of SOP 2.0 significantly reduced the duration of non-productive days during the epidemic period (p<0.001) (Fig. 2D), facilitating the optimal utilization of sow production capacity and mitigating indirect economic losses associated with the epidemic. Fifthly, as shown in Fig. 2E F, the results of both direct and indirect economic losses showed that farms adhering to SOP 2.0 experienced significantly reduced economic losses compared to those following SOP 1.0 (p<0.01). Finally, as shown in Fig. 2G, the costs of SOP 2.0 were also significantly lower than those of SOP 1.0, indicating a better choice of SOP 2.0 for adoption. Above all, the rigorous implementation of SOP 2.0 enables uninterrupted production operations during an ASF outbreak, thereby effectively mitigating the substantial losses incurred by covert production and concurrently reducing the cost implications during disposal procedures.


Add Comment