

Location
Experimental procedures were carried out in the Animal Nutrition Lab of Veterinary Medicine and Zootechnics Faculty at the National University of the Altiplano, Puno, Peru, at an altitude of 3828 m (15° 49′ 29″ S, 70° 00′ 56″ O). The digestibility assay was performed in a sedimentation column water recirculation system (0.5 l/s) equipped with a closed water treatment system, gravel filter (STF Filter System® Leri Model 002737), activated carbon filter, biological filter (clays with nitrifying bacteria, Proline®), and UV filter (X-Ray UV Light Boyo®, China).
Hydrolyzed skins of sheep and alpacas
Sheared dry skins of sheep and alpacas obtained from a wool and fiber local commercial were cut, washed, and then hydrolyzed at 15 psi and 130 °C for 120 min in a 25 l capacity autoclave (All American®) equipped with a manometer, thermometer, and thermostat to control the temperature and pressure. The hydrolyzed skins of sheep (HSS) and alpacas (HSA) were then dried, ground, sieved, and stored until use.
Experimental diets
The ingredients and chemical composition of experimental diets are shown in Table 1. Three diets (a reference diet and two experimental diets) were evaluated in triplicate. The reference diet was formulated based on the nutritional requirements for trout ([NRC] National Research Council 2011). The experimental diets were composed of 70% reference diet and 30% of either HSS or HSA, according to the methodology proposed by Glencross et al. (2007). The ingredients of the diets were mixed and then extruded at 95 °C (Extruder Khal® EE800, Germany) with a 4-mm pellet size.
Fish and experimentation conditions
A total of 450 juvenile rainbow trout from a commercial line (Troutlodge®, USA) were used. The fish had an initial mean weight of 60.0 ± 1.32 g (Alexander Mobba-Excell® SI-130) and a total mean length of 17.9 ± 0.93 cm (Ichthyometer, Aquatic Eco-Systems®). The trout was handled after being sedated with 20 mg/l tricaine methane sulfonate (MS 222, Argent Chemical Laboratories, Redmond, WA, USA). The fish were randomly distributed into tanks specially designed to measure the digestibility of their feed (Fig. 1) with an average loading density of 6.4 kg/m3. Each digestibility tank (500 l capacity) had a sedimentation unit for fecal collection adapted from Rodehutscord et al. (2000). The average water quality parameters were as follows: pH 8.4, temperature 11.5 °C (Peachimeter SI Analytics Lab 850®, Germany), and dissolved oxygen 6.2 mg/l (HI 9146 Hanna® Dissolved Oxygen Meter).
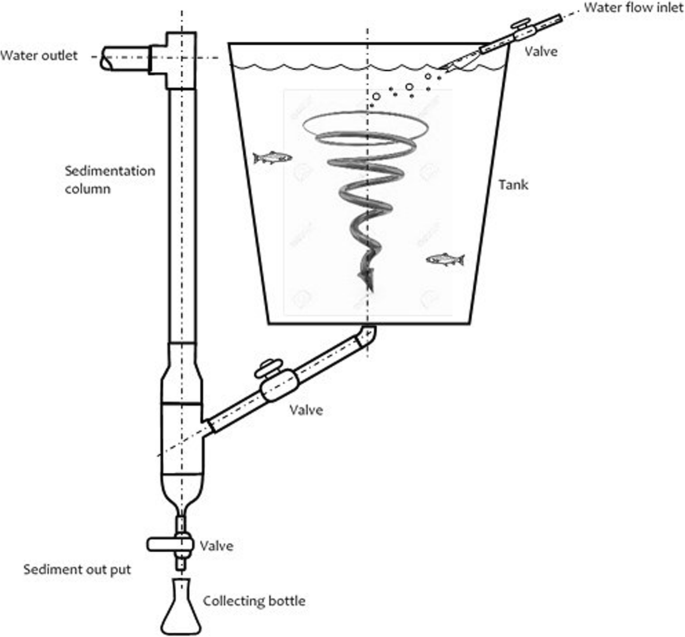
Sedimentation system and collection of feces (adapted from Rodehutscord et al. 2000)
Determination of apparent digestibility
The apparent digestibility of the feed was determined by the indirect method of using an indigestible marker such as acid-insoluble ash (Hyflo Super Cel®) as previously described (Atkinson et al. 1984; Vandenberg and De La Noue 2001). Fish were given 7 days to become accustomed to the diet, followed by 7 days of fecal collection, and then, they were raised until 40 days to determine the performance of productive parameters.
The experimental diets were supplied twice a day (10:00 and 16:00 h). After feeding, all feed waste was removed from the system and collected directly from the sedimentation bottle. The experiment was performed under a natural light regime (range during experiment from 12:36 to 12:10 daylight hours).
The apparent digestibility of dry matter (DM), organic matter (OM), crude protein (CP), crude fat (CF), and digestible energy (DE) was determined using Eq. (1) proposed by Forster (1999).
$$ \mathrm{AD}\ \left(\%\right)=100-100\ \mathrm{x}\ \left(\frac{\mathrm{MD}\ }{\mathrm{MF}}\right)\ \mathrm{x}\ \left(\frac{\mathrm{NF}\ }{\mathrm{ND}}\right) $$
(1)
where AD is the apparent digestibility (%), MD is the marker in the diet (%), MF is the marker in the feces (%), NF is the nutrient in the feces (%), and ND is the nutrient in the diet (%).
The apparent digestibility of DM, OM, CP, CF, and DE from the hydrolysates was estimated according to Eq. (2) proposed by Sugiura et al. (1998).
$$ \mathrm{ADi}\ \left(\%\right)=\mathrm{ADCt}+\left[\left(\frac{\left(1-s\right)\ \mathrm{Db}}{s\ \mathrm{x}\ \mathrm{Dt}}\right)\ \mathrm{x}\ \left(\mathrm{ADCt}-\mathrm{ADCb}\right)\ \right] $$
(2)
where ADi is the apparent digestibility of the ingredient under study (%), ADCt is the apparent digestibility coefficient of the diet evaluated, ADCb is the apparent digestibility coefficient of the reference diet (%), Db is the nutrients of the reference diet (%), Dt is the nutrients of the experimental diet (%), s is the proportion of the ingredient evaluated in the diet, and 1-s is the proportion of the reference diet in the experimental diet.
Proximal composition of test ingredients, diets, and feces
The DM, OM, CP, CF, gross energy (GE), and DE of the hydrolyzed skins of sheep (HSS) and alpacas (HSA) were determined. The ingredients, feed, and feces were analyzed according to the methodology of the [AOAC] Association of Official of Analytical Chemists (2011). Furthermore, GE was determined with a pump calorimeter (Parr Instrument 6772® USA). The non-digestible marker in diets and feces was determined according to the methodology proposed by Scott and Boldaji (1997).
Productive parameters
The initial weight, final weight, daily weight gain, feed consumed daily, and feed conversion rate of trout were controlled from 0 to 40 experimental days.
Statistical analysis
Data analysis was performed using the analysis of variance (ANOVA) procedure in the SAS statistical program (SAS Institute Inc 2004). Mean values were compared using the LS mean test. Differences were considered significant at p < 0.05.
Add Comment