


1 Introduction
Aging is associated with a progressive decrease in skeletal muscle mass, strength, and physical performance, a process defined as Sarcopenia by the European Working Group in Older People (EWGSOP 2) (Cruz-Jentoft et al., 2019). Worldwide, the prevalence of sarcopenia reaches ∼25% at 70 years of age and 40% over 80 years of age (Thompson, 2009). In Chile, according to the cut-off values of the European consensus, sarcopenia affects 19.1% (95% CI: 16.8%–21.8%) of people over 60 years of age (Lera L et al., 2017). Sarcopenia impacts the number, size, and type of muscle fibers, altering the quality and function of the muscular system (Venturelli et al., 2022). In addition, it has been closely associated with an increased risk of falls, loss of functionality, risk of hospitalization, and mortality in older people (Landi et al., 2012; Landi et al., 2013; Frontera, 2022).
Muscle power and rate of force development (RFD) are relevant neuromuscular parameters for physical performance in older people, and both are affected by the muscle remodeling process as a consequence of aging and sarcopenia (Varesco et al., 2019). Muscle power is understood as the ability to exert force rapidly (Reid and Fielding, 2012; Reid et al., 2014), and RFD is the speed at which the contractile elements of the skeletal muscle can develop force (Aagaard et al., 2002). These parameters play a fundamental role during tasks that demand explosive muscular actions of the lower limbs, such as getting up from a chair or climbing stairs (Guizelini et al., 2018; Hester et al., 2021). Both muscle power and RFD present an early and pronounced decrease during aging, even more, significant than muscle strength (Clark et al., 2013; Hester et al., 2021; Lomborg et al., 2022). In addition, both parameters specifically in lower limbs are significant predictors of the risk of falls, functional limitation, and disability in older people (Osawa et al., 2018; Bahat et al., 2021; Lomborget al., 2022). In this sense, preserving power and RFD is relevant for mobility and functional independence in this population.
Physical training is an intervention strategy that protects older people’s muscle strength and physical performance (Bao et al., 2020; Zhang et al., 2021). Although resistance exercise training is the most recommended type of training to maintain and increase skeletal muscle mass and strength condition (Dent et al., 2018; Beckwée et al., 2019), recent research has shown that power and explosive strength training are also associated with an improvement in functional capacity reducing the incidence of falls in frail and institutionalized older people (Izquierdo et al., 2021). The increase in RFD and power requires explosive movement training in a short time, which is possible to achieve during high-intensity interval training (HIIT).
Muscular strength and power have shown a greater decline in knee extensor than in handgrip in older people (Samuel et al., 2012). Usually, the evaluation of muscle strength and power gain in strength training in older people is measured in the dominant/preferred limb of the participants (Müller et al., 2020) or in both limbs at the same time (T Balachandran et al., 2023). However, the presence of asymmetry of strength and muscular power in the lower limbs in older people in comparison with young subjects of 5%–10% is known (Carabello et al., 2010; LaRoche et al., 2017), which would affect performance in different functional tasks such as walking speed, climbing stairs, among other tasks (Portegijs et al., 2008; Straight et al., 2016). Furthermore, it has been reported that the performance of the preferred lower limb in young and adult subjects may differ from the contralateral limb (Carpes et al., 2010). Therefore, it seems important to analyze the effects of training involving bilateral mechanical stimuli on the demand of both lower limbs (i.e., bicycle) without assuming symmetry in older people. HIIT on a static bicycle is a training modality characterized by short, intermittent bursts of vigorous exercise alternated by rest periods or low-intensity recovery (Gibala et al., 2012).
HIIT has shown favorable effects on cardiorespiratory fitness in various health conditions and populations (Marriott et al., 2021; Wu et al., 2021). Studies have presented that HIIT is an excellent therapeutic alternative in young people for inducing neuromuscular adaptations such as muscle power and the ability to develop force rapidly during dynamic movements due to its short duration (∼20–30 min per session) and high-intensity work intervals (Martinez-Valdes et al., 2017; Schaun et al., 2019). In older people, recent studies propose that HIIT may be an effective training modality to improve the phenotypic characteristics of sarcopenia, these as the muscle function, muscle quantity, and physical performance (Hayes et al., 2021; Müller et al., 2021; Liu et al., 2022), as well as body composition, muscle strength, and muscle power (Sculthorpe et al., 2017; Buckinx et al., 2019; Alzar-Teruel et al., 2022). However, few studies have investigated the interaction between HIIT and lean mass, strength, rate of force development, and power in both lower limbs of healthy older and young people. Considering that HIIT can be a training alternative to maintain skeletal muscle function and preserve functional independence (Liu et al., 2022), this study aimed to determine the effect of HIIT on lean mass, maximal strength, rate of force development, and muscle power of both lower limb in healthy older and young people. Secondarily, to compare the effects of HIIT between dominant vs. non-dominant lower limbs of each group.
2 Materials and methods
2.1 Participants
Healthy older (n = 9; 66 ± 6 years; BMI 27.1 ± 3.1 kg m-2) and young (n = 9; 21 ± 1 years; BMI 26.2 ± 2.8 kg m-2) men were trained for 12 weeks with HIIT on a static bicycle. The present study is part of a larger project that determined the effects of HIIT on health parameters and quality of life among young vs. older people (Marzuca-Nassr et al., 2020; Artigas-Arias et al., 2021; Vidal-Seguel et al., 2023). The number of participants per group considered for this study was lower (n = 9) than the original project (n = 10), due to technical problems with the signals obtained from the force recording (criteria to determine RFD), so the participants with initial and final parameters complete data were included in the final statistical analysis.
2.2 Procedure
Men between 18–35 and 55–75 years old who were physically inactive (who did do not perform a programmed physical exercise more than twice a week) with body mass index (BMI) between 18.5 and 30 kg m-2 were recruited from May 2019 to September 2019. Participants with a history of surgery within the 3 months prior to selection, use of anticoagulants, cardiorespiratory or musculoskeletal conditions that have contraindications or limit the performance of exercise, diagnosis of type 2 diabetes mellitus (determined by fasting blood glucose >100 mg/dL or HbA1c values 6.5%), uncontrolled high blood pressure, use of nutritional supplements that can regulate skeletal muscle mass or cardiorespiratory fitness and smokers, were excluded. All the participants signed the informed consent after knowing the study’s aims, risks, and benefits. The study was approved by the Scientific Ethics Committee of the Universidad de La Frontera (Act No. 069_18, Folio 025_18, 2018) following the guidelines of the Declaration of Helsinki.
One week before the baseline assessments, participants completed a general health questionnaire to determine their eligibility for the study. Subsequently, each participant underwent the evaluations 48 h before the first HIIT session (PRE) and 48 h after the last training session (POST) at the University of La Frontera, Chile. Specifically, the participants performed a familiarization for evaluating of one repetition maximum (1RM) after the screening session. On a separate day, the participants arrived to the laboratory in a fasting state to perform the DEXA scan. After a standardized breakfast, anthropometric and physical evaluations were performed. Then, 12 h after, the VO2max evaluation was performed (not considered in full for this report).
Anthropometric measurements were made to determine body composition (weight, height, Body Mass Index (BMI), thigh circumference, whole-body lean mass, and limb lean mass), strength (maximal strength and RFD of knee extensors), and muscle power of lower limbs. In addition, the dominance of the lower limbs was determined through a question: “If you had to kick a ball, with which lower limb would you do it more safely?” (van Melick et al., 2017). Additionally, dietary records and physical activity recorded together with the use of a pedometer were performed 3 days before starting HIIT and at week 11.
2.2.1 Body composition
Each participant was placed barefoot on a stadiometer scale (SECA® platform scale Madison, WI, United States) to measure body weight and height with 0.1 kg and 0.5 cm precisions, respectively. The BMI was determined with the weight (kg) and height squared (m2) ratio. The circumference of the thigh segment was determined with a SECA® retractable tape measure graduated in (Madison, WI, United States), with the participant in a standing position, with both heels positioned on a drawn horizontal line and with a separation between feet of 15 cm.
Dual-energy X-ray absorptiometry (DEXA) scan determined total and lower limb lean mass (Lunar General Electric iDEXA, General Electric Medical Systems, Madison, WI, United States).
2.2.2 Maximal strength and rate of force development
Maximal voluntary isometric strength was measured in both lower limbs (always maintaining the same order, first the dominant and then the non-dominant limbs). Before the strength measurement, the participants warm-up on a stationary bike for 5 min with a load 50 W and at 60 RPM. Then, each participant was placed on a chair with the trunk fully supported, with the hip and knee at 90°. A force transducer (Load Cell −500 lb. Sensortronics, United States) was used to measure knee extension’s maximal voluntary isometric strength. Before maximal strength recordings, participants performed four submaximal contractions at 50%, 70%, 80%, and 90% of their self-perceived maximum intensity for 3 s with 1 min of rest between each. The participants were instructed to perform a maximal isometric knee extension “as quickly as possible,” maintaining the requested movement for 3 s and repeating the test 3 times in both lower limbs. During the execution of each repetition, the participant was verbally motivated to achieve the best performance in the test. The maximum strength was obtained from the highest record of the three attempts.
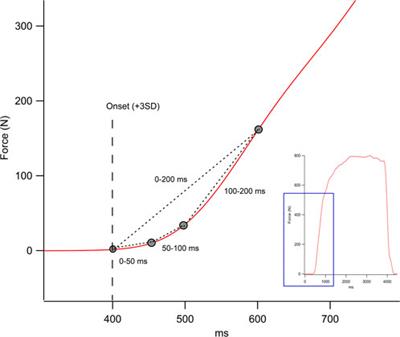
The transducer captured the signal at 500 Hz with the IgorPro V6.1 software (WaveMetrics, Inc. United States), each signal was offset-corrected and smoothed with a 20 Hz low-pass filter, and each record’s maximum force was determined from a plateau of 2 s. The maximal voluntary isometric strength value of each repetition was used to normalize the rate of force development (RFD), defined as the relation between Force and Time (Maffiuletti et al., 2016). The onset of force was determined when it exceeded 3 SD of the rest signal before execution. The RFD was obtained in the first 200 ms of the force recording and was analyzed in 4 early time intervals of muscle contraction: 0–50 ms (RFD0-50), 50–100 ms (RFD50-100), 100–200 ms (RFD100-200) and 0–200 ms (RFD0-200) (Figure 1). The average value of the three repetitions was used to represent the RFD of each interval. The times of each interval were defined according to the recommendations of other studies to identify the initial muscle contraction during the development of rapid strength (Maffiuletti et al., 2016; Varesco et al., 2019).
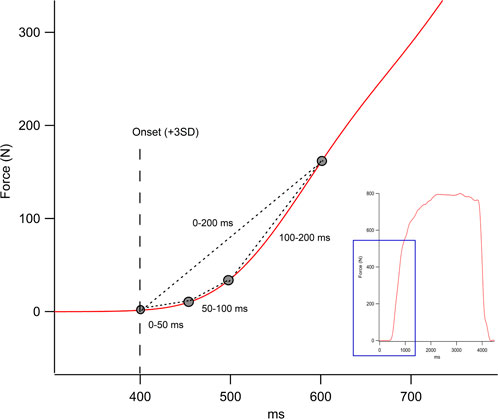
FIGURE 1. Representation of the raw force output onset in Newton (N) obtained during knee extension (thumbnail image on the right). The figure shows the rate of force development in the different intervals in milliseconds (ms).
Additionally, the maximal voluntary isometric strength obtained was adjusted concerning the lean mass (N/kg) and the thigh circumference (N/cm) in both lower limbs. Since the maximum knee extension strength is produced by mainly the quadriceps muscle, an gold standard measure (lower limb lean mass by DEXA scan) and a clinical measure (thigh circumference) that consider the amount of “quadriceps muscle mass” were considered to make strength adjustments.
2.2.3 Sit to stand power
Five Times Sit to Stand test (STS) was conducted on an armless chair with a standardized height of 0.44 m from the floor to determine the muscle power of the lower limbs. The participant was seated with arms crossed at chest level. They were instructed to “stand up and sit down as fast as possible five times”. The participant was verbally encouraged during the timed test. Muscle power with STS was obtained through the equation proposed by Alcazar et al. (2018):
STS mean muscle power (W) is the product of STS mean speed and force. The average force is represented by the body mass displaced during the test (total body mass minus the mass of the legs and feet (0.90) multiplied by gravity (g = 9.8 m/s2), and the average velocity of the STS calculated as the vertical distance traveled by the center of mass (difference between the length of the legs (0.50 height) and the height of the chair) divided by the mean time taken to complete the STS test.
2.2.4 High-intensity interval training (HIIT)
HIIT training was performed for 12 weeks, with a frequency of 3 times a week, on alternate days (Monday, Wednesday and Friday) on a stationary bike (Oxford®, BE2700) for both groups. The intervention was supervised by an experienced professional who continuously monitored each participant’s heart rate through a cardiac strap (Polar T31, Finland). To determine the intensity, the maximum aerobic capacity (VO2max) was used as a reference with continuous monitoring of the heart rate through the modified Astrand test (Marzuca-Nassr et al., 2020). Each session was performed at an intensity of 90% of the maximum heart rate obtained from the reference test, considering 1 min of exercise followed by 2 min of inactive rest, repeating each exercise/rest interval ten times. Heart rate measurements were taken at the start and end of each 1-min interval. Participants who completed at least 80% of their HIIT sessions were considered for the final analyses.
2.3 Statistical analysis
The normal distribution of all data was determined using the Shapiro-Wilk test. The baseline characteristics of the participants, such as age, weight, height, and BMI, among others, were compared between both groups using a t-test for independent samples. A two-way ANOVA was used with a between-subjects factor (older and young group) and a time factor (pre-HIIT and post-HIIT). If a main effect was found, a Bonferroni post hoc test was applied to determine the differences between pairs if necessary. Partial eta squared was used to estimate effect sizes and represented as η2. Values of η2 = 0.01 indicate a small effect, η2 = 0.06 indicates a medium effect and η2 = 0.14 indicates a large effect (Cohen, 1988). To determine the differences between dominant and non-dominant, an independent t-test was applied. All data are expressed as mean ± standard deviation (SD). All statistical analyzes were performed using SPSS V26.0 software (Chicago, Illinois, United States) and graphing were performed using GraphPad Prism V8.02 (GraphPad Software Inc. United States). The statistical significance level was set at p < 0.05.
3 Results
3.1 Baseline characteristics
Baseline characteristics of the participants are shown in Table 1. Both groups showed significant differences in age (p < 0.01). Older participants show lower baseline values of maximal oxygen consumption and higher time on the STS test (p < 0.01) than younger participants. Variables such as weight, height, BMI, whole-body lean mass, heart rate, and diastolic and systolic blood pressure did not show baseline differences between the two groups (p > 0.05). Dietary records were subjectively evaluated by a nutritionist, finding no intra-subject differences. The average daily steps also did not show intra-subject differences (p > 0.05). All participants completed 36 HIIT sessions (3 days a week for 12 weeks).
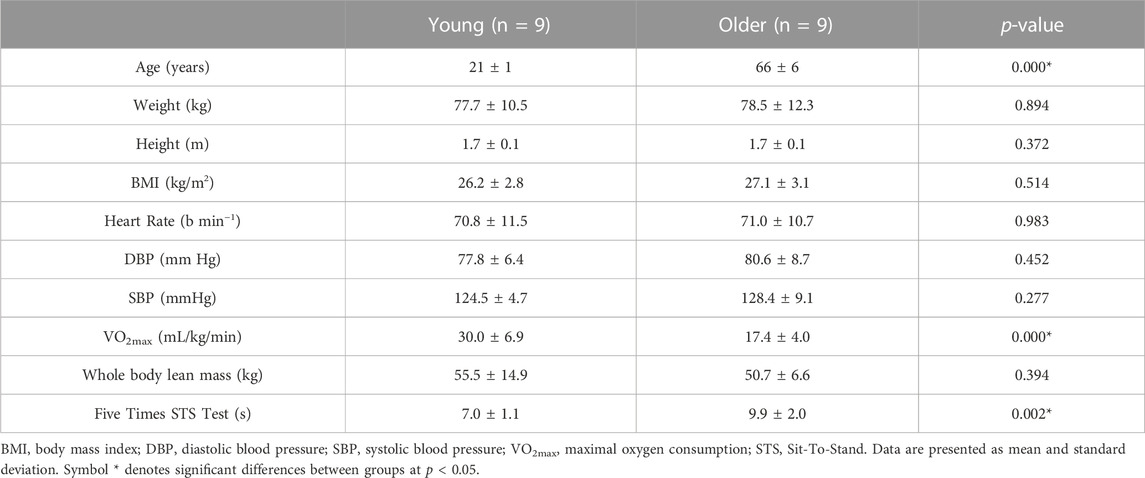
TABLE 1. Baseline characteristics of the participants.
3.2 Body composition
The effects of 12 weeks of HIIT program on lower limb lean mass are presented in Table 2. No significant interaction between time and group in the dominant limb (DL: F(1,16)=0.98, p = 0.335) and non-dominant limb (NDL: F(1,16) = 1.17, p = 0.294) was observed. However, a significant main effect of time was revealed (F(1,16) = 7.61, η2 = 0.322; p = 0.014) in the NDL with a relative increase of 2.2% ± 5.3% and 0.6% ± 4.11% in young and older, respectively.
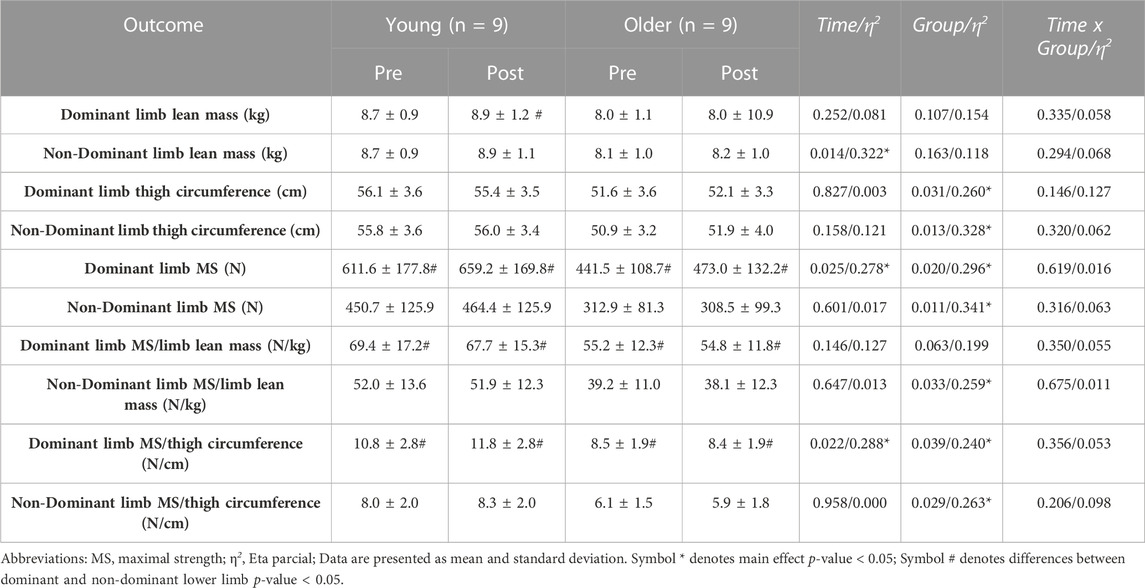
TABLE 2. Body composition, maximum strength and power before and after HIIT, and the comparison between lower limbs.
On the other hand, thigh circumference did not show a significant interaction between time and group (DL: F(1,16) = 2.32, p = 0.146; NDL: F(1,16) = 1.05, p = 0.320, Table 2). However, a significant main effect of the group was revealed in the DL (F(1,16) = 5.63, η2 = 0.260, p = 0.03) and in the NDL (F(1,16) = 7.79, η2 = 0.328, p = 0.01), with a higher thigh circumference value in young participants but with a relative increase ∼1–2%.
3.3 Maximal strength
After HIIT training, muscle strength analysis showed no significant interaction effect between time and group for DL (F(1,16)=0.25, p = 0.619) and for NDL (F(1,16) = 1.07, p = 0.316). A significant group main effect was revealed for DL (F(1,16) = 6.71, η2 = 0.296, p = 0.02) and NDL (F(1,16) = 8.29, η2 = 0.341, p = 0.01), with higher strength values in the young group before and after training. In addition, a significant main effect of time (F(1,16) = 6.15, η2 = 0.278; p = 0.025) in DL, showing a relative increase in young participants of 10.4% ± 16.0% and in older adults of 3.7% ± 9.3%, as shown in Table 2.
The muscle strength values adjusted for lean mass (Table 2), also showed no interaction effect between time and group in both DL and NDL (F(1,16) = 0.92, p = 0.350; F(1,16) = 0.18, p = 0.675, respectively). A significant group main effect was observed on NDL (F(1,16) = 5.46, η2 = 0.254, p = 0.03), showing differences between groups.
When adjusting the muscle strength to the thigh circumference (Table 2), there was no interaction effect between time and group in both DL and NDL (F(1,16) = 0.90, p = 0.356; F (1,16) = 1.72, p = 0.207, respectively). However, a significant group main effect was revealed on the DL (F(1,16) = 5.06, η2 = 0.240, p = 0.03) and on the NDL (F(1,16) = 5.71, η2 = 0.263, p = 0.02), showing a higher strength value in the young group before and after training. In addition, a significant main effect of time (F(1,16) = 6.48, η2 = 0.288; p = 0.022) in the DL that showed a relative increase of 11.7% ± 17.4% in the young group and 6.21% ± 15.1% in the older adult group.
3.4 Rate of force development
In the analysis of the RFD after 12 weeks of HIIT program, no significant interaction effect between time and group was found in both DL and NDL in all four-time intervals analyzed (RFD0–50 ms, RFD50–100 ms, RFD100–200 ms, RFD0–200 ms, all p > 0.05). A significant group main effect on DL was revealed at RFD0–50 ms interval (F(1,16) = 8.45, η2 = 0.346, p = 0.01) and RFD0–200 ms interval (F(1,16) = 6.46, η2 = 0.288, p = 0.02) (Figure 2A). Furthermore, in the NDL was observed also a significant group effect on DL for RFD100–200 ms interval (F(1,16) = 5.50, η2 = 0.256, p = 0.03) and RFD0–200 ms interval (F(1,16) = 11.43, η2 = 0.417, p = 0.004) (Figure 2B).
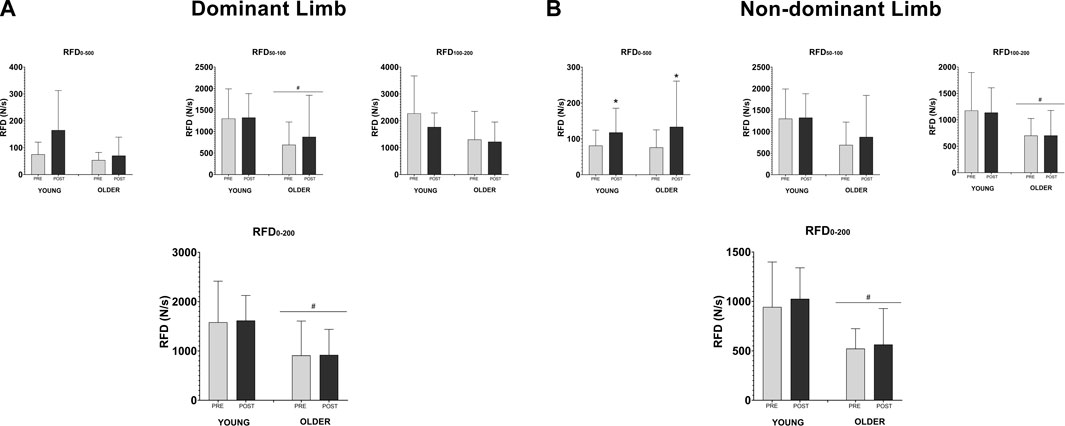
FIGURE 2. Effects of HIIT training on rate of force development (RFD). Each time interval was expressed on the graph (0–50, 50–100, 100–200, and 0–200 ms). Panel A shows the values of the dominant lower limb at each RFD interval. Panel B shows the values of the non-dominant lower limb in each RFD interval. The graphs are presented in mean and standard deviation. The symbol * denotes time effect with p < 0.05, and # denotes group effect with p < 0.05.
In addition, a significant main effect of time was evidenced in RFD0–50 ms in the NDL (F(1,16) = 6.55, η2 = 0.291; p = 0.021), where a relative increase of 105% ± 225.3% was observed in the young group and 52.1% ± 61.0% in the group of older adults (Figure 2B).
3.5 Muscle power
HIIT training produced higher increase on STS power in young participants (from 419.5 ± 82.7 to 473.4 ± 129.4 W) when compared to older people (from 294.8 ± 79.5 to 380.1 ± 99.0 W) (Time effect: F(1,16) = 13.13, η2 = 0.451; p = 0.002). A relative increase of 12.1% ± 16.8% was observed in the young group and 34.7% ± 39.0% in the older group. A significant main effect was obtained between the young and older groups (F(1,16) = 6.46, η2 = 0.288, p = 0.02), but with no time*group interaction effect (F (1,16) = 0.67, p = 0.425) (Figure 3).
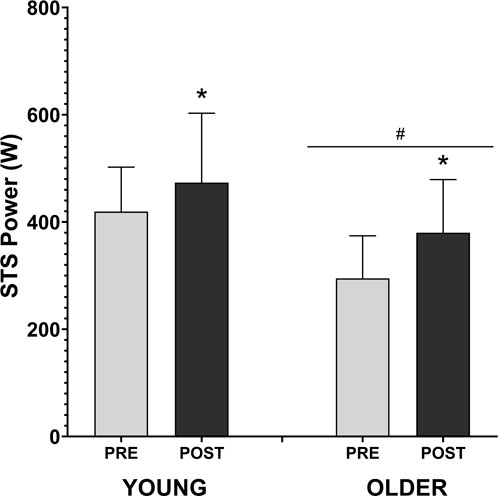
FIGURE 3. Effects of HIIT training on sit to stand power muscle. The graphs are presented in mean and standard deviation. The symbol * denotes time effect with p < 0.05, and # denotes group effect with p < 0.05.
3.6 Dominant vs. non-dominant lower limbs
When comparing dominant and non-dominant limbs (Table 2), lean mass and thigh circumference did not show differences in either group (p > 0.05, both). On the other hand, muscle strength showed higher records in DL over NDL, before and after the HIIT program (p < 0.05) in both groups. Likewise, the strength adjusted for both lean mass and thigh circumference showed the same differences as the absolute values of maximum strength (p < 0.05).
When comparing the RFD between dominant and non-dominant limbs, there are differences only in the older group in the intervals RFD50–100 ms, RFD100–200 ms and RFD0–200 ms (p < 0.05) after the HIIT program.
4 Discussion
This study aimed to determine the effect of HIIT on lean mass, maximal strength, rate of force development (RFD), and lower limb muscle power in healthy young and older participants. The results show that HIIT increased lean mass and maximum strength in both groups but with differences between the dominant and non-dominant lower limbs. In the case of RFD, an increase in the early time interval of force (RFD0–50 ms) was only observed in the non-dominant lower limb in both groups but not in the other RFD intervals. When comparing the RFD between dominant and non-dominant members, there are differences only in the older age group after the HIIT program. Finally, the muscular power obtained with the STS test showed an increase in post-HIIT values in both groups, with a greater relative increase in the older group. However, the results showed no time*group interaction in response to HIIT training.
HIIT has been shown to be a safe physical training modality in older people, with beneficial effects on total muscle volume and maximum strength (Moro et al., 2017; Callahan et al., 2021). Consistent with this, our data show those 12 weeks of HIIT successfully increase lean mass and maximum strength in healthy younger and older individuals. Furthermore, these parameters have been strongly related to decreased risk of falls, hospitalizations, and morbidity and mortality in older people (Mitchell et al., 2012; Alajlouni et al., 2023). Strength measurement, specifically of knee extensors, has been suggested as a way of early identification of strength reduction in aging (Abdalla et al., 2020). However, muscle strength is usually adjusted only for body weight, without considering the characteristics of size or composition of the analyzed member (Jaric et al., 2002; Machado et al., 2022). Our results show that HIIT promotes improvements in the absolute maximum strength of the knee extensors. When the obtained strength is adjusted for thigh circumference, the results are similar to the absolute values, but when adjusted for legs lean mass, they change. Since the relationship between strength and sarcopenia is not linear, training sessions that may influence body composition or segmental anthropometric parameters, such as lower limb HIIT, should be analyzed together with muscle strength gains to avoid bias in its interpretation (Compston et al., 2014; Abdalla et al., 2020).
Muscle power is a crucial factor in the functional capacity of older people, related to gait speed and risk of falls (Bean et al., 2010; Reid and Fielding, 2012). As previously mentioned, muscle power declines earlier than skeletal muscle mass and strength with aging. For example, Goodpaster et al. (2006), studied older men and women who exhibited a loss of strength three times greater than the decrease in muscle mass over 3 years of follow-up. Then, in the study by Bahat et al. (2021), they found that lower muscle power was more prevalent than lower muscle strength in older adults. Furthermore, Wiegmann et al. (2021), observed a higher and earlier RFD loss than strength and muscle mass over 6 years of follow-up. Our results showed that a HIIT program increases muscle power (12.1% ± 16.8% in the young group and 34.7% ± 39.0% in the older group) and RFD0–50 ms (105% ± 225.3% in the group young and 52.1% ± 61.0% in the group of older adults). Few studies have looked at the effects of HIIT on muscle function such as muscle power in older people. Müller et al. (2020), demonstrated an increase in RFD after 16 weeks of HIIT when combined with resistance or power training in older people. Speed of muscle recruitment and the intensity of the training seems to be determining factors for the rapid gain in strength and would depend on neuromuscular factors (Gerstner et al., 2017), which could explain the improvements in the initial strength intervals in older people. Sarcopenia in older people presents skeletal muscle atrophy, functional deficit and, slow muscle response. With its intense and fast exercise, HIIT could promote the preservation of skeletal muscle mass, strength, and power (Padilla Colon et al., 2014; Coletti et al., 2022).
The muscle qualities of both lower limbs after HIIT program have been rarely reported, particularly in older people (Hurst et al., 2019). The difference in strength (asymmetry) between knee extensors in older subjects (15%–20%) is greater than in younger individuals (∼10%) (Perry et al., 2007; Carabello et al., 2010). Some studies have associated a greater asymmetry in the strength of the lower limbs with a greater risk of falls and functional limitations in older people (Straight et al., 2016; LaRoche et al., 2017). In our study, we analyzed both lower limbs due to the characteristics of the bilateral stimulus that HIIT program presents when performed on a bicycle, which would therefore demand both lower limbs in a similar way. However, we observed differences between DL in relation to NDL in strength and RFD at baseline in both groups and that were maintained post-training, accentuating in older people. Carpes et al. (2010), observed than in subjects trained on cycling, the performance of the preferred lower limb may differ from the contralateral one, which could explain why the differences between both limbs were maintained with this training and facilitate the increase in asymmetry observed in the older people. Nunes et al. (2022), reported that traditional lower limb strength training (with bilateral strength exercises) in older women improved limb asymmetry, but not all responded in the same way. Therefore, as some authors indicate, the baseline asymmetries between the lower limbs could cause asymmetric strength gains, mainly due to the type of exercise used that allows more or less force to be applied with one limb compared to the other (Nunes et al., 2022). Clinically, it seems relevant to consider asymmetry in the older people in evaluations and training, since it would allow us to better estimate the performance of the lower limbs and a better understanding of the gains and adaptations that muscle function achieves in this population (LaRoche et al., 2017).
This study has limitations. The small sample size may limit some scope of the results. However, the analysis of both dominant/non-dominant lower limbs can broaden the discussion possibilities. In this sense, the lack of randomization in the order of the strength tests did not allow us to analyze whether the strength gains could have been influenced by an order evaluation effect, which should be considered for future experiments, despite the fact that recent studies recommend performing a pre-assessment familiarization beginning with the dominant lower limb (as performed in this study) (Chan et al., 2020). Future studies should consider larger samples of older people who have evaluated the muscle strength and power of both lower limbs to understand the contributions of HIIT in this regard. On the other hand, muscle power analysis often focuses on the knee extensor muscles. It would be essential to evaluate how HIIT promotes favorable effects in the other muscle groups associated with the stability of the lower limbs.
In conclusion, HIIT promotes increases in lean mass, strength, early RFD, and lower limb muscle power in healthy old and young individuals. The differences shown between the DL and the NDL must be analyzed in future studies. The real scope of skeletal muscle adaptation in HIIT must be addressed in more complex studies of muscle function.
Data availability statement
The raw data supporting the conclusions of this article will be made available by the authors, upon further evaluation by contacting the corresponding author.
Ethics statement
The studies involving humans were approved by Scientific Ethics Committee of the Universidad de La Frontera (Act No. 069_18, Folio 025_18, 2018). The studies were conducted in accordance with the local legislation and institutional requirements. The participants provided their written informed consent to participate in this study.
Author contributions
CC-M and GNM-N designed the study. NG-M, BA-C, SS-L, MA-A, AA-M, and NH organized and performed the experiments. CC-M analyzed the data. CC-M and GNM-N interpreted the data. CC-M and JE-A drafted the manuscript. CC-M, JE-A, NV-S, JS, LS, AP, and GNM-N edited and revised the manuscript. All authors contributed to the article and approved the submitted version.
Acknowledgments
This work has been partly funded by Interuniversity Center for Healthy Aging, Code RED21993, and by Dirección de Investigación (DIUFRO) of the Universidad de La Frontera (Grant Numbers DI18-0068 and PP23-0012).
Conflict of interest
The authors declare that the research was conducted in the absence of any commercial or financial relationships that could be construed as a potential conflict of interest.
Publisher’s note
All claims expressed in this article are solely those of the authors and do not necessarily represent those of their affiliated organizations, or those of the publisher, the editors and the reviewers. Any product that may be evaluated in this article, or claim that may be made by its manufacturer, is not guaranteed or endorsed by the publisher.
References
Aagaard P., Simonsen E. B., Andersen J. L., Magnusson P., Dyhre-Poulsen P. (2002). Increased rate of force development and neural drive of human skeletal muscle following resistance training. J. Appl. Physiol. (1985) 93, 1318–1326. doi:10.1152/japplphysiol.00283.2002
Abdalla P. P., Dos Santos Carvalho A., Dos Santos A. P., Venturini A. C. R., Alves T. C., Mota J., et al. (2020). Cut-off points of knee extension strength allometrically adjusted to identify sarcopenia risk in older adults: A cross-sectional study. Arch. Gerontol. Geriatr. 89, 104100. doi:10.1016/j.archger.2020.104100
Alajlouni D. A., Bliuc D., Tran T. S., Blank R. D., Center J. R. (2023). Muscle strength and physical performance contribute to and improve fracture risk prediction in older people: A narrative review. Bone 172, 116755. doi:10.1016/j.bone.2023.116755
Alcazar J., Losa-Reyna J., Rodriguez-Lopez C., Alfaro-Acha A., Rodriguez-Mañas L., Ara I., et al. (2018). The sit-to-stand muscle power test: an easy, inexpensive and portable procedure to assess muscle power in older people. Exp. Gerontol. 112, 38–43. doi:10.1016/j.exger.2018.08.006
Alzar-Teruel M., Aibar-Almazán A., Hita-Contreras F., Carcelén-Fraile M. D. C., Martínez-Amat A., Jiménez-García J. D., et al. (2022). High-intensity interval training among middle-aged and older adults for body composition and muscle strength: A systematic review. Front. Public Health 10, 992706. doi:10.3389/fpubh.2022.992706
Artigas-Arias M., Olea M. A., San-Martín-Calísto Y., Huard N., Durán-Vejar F., Beltrán-Fuentes F., et al. (2021). Anthropometric parameters, lower limb functionality and quality of life after high-intensity interval training in healthy young people versus older adults. Int. J. Morphol. 39, 1337–1344. doi:10.4067/S0717-95022021000501337
Bahat G., Kilic C., Eris S., Karan M. A. (2021). Power versus sarcopenia: associations with functionality and physical performance measures. J. Nutr. Health Aging 25, 13–17. doi:10.1007/s12603-020-1544-8
Bao W., Sun Y., Zhang T., Zou L., Wu X., Wang D., et al. (2020). Exercise programs for muscle mass, muscle strength and physical performance in older adults with sarcopenia: A systematic review and meta-analysis. Aging Dis. 11, 863–873. doi:10.14336/AD.2019.1012
Bean J. F., Kiely D. K., Larose S., Goldstein R., Frontera W. R., Leveille S. G. (2010). Are changes in leg power responsible for clinically meaningful improvements in mobility in older adults? J. Am. Geriatr. Soc. 58, 2363–2368. doi:10.1111/j.1532-5415.2010.03155.x
Beckwée D., Delaere A., Aelbrecht S., Baert V., Beaudart C., Bruyere O., et al. (2019). Exercise interventions for the prevention and treatment of sarcopenia. A systematic umbrella review. J. Nutr. Health Aging 23, 494–502. doi:10.1007/s12603-019-1196-8
Buckinx F., Gaudreau P., Marcangeli V., Boutros G. E. H., Dulac M. C., Morais J. A., et al. (2019). Muscle adaptation in response to a high-intensity interval training in obese older adults: effect of daily protein intake distribution. Aging Clin. Exp. Res. 31 (6), 863–874. doi:10.1007/s40520-019-01149-y
Callahan M. J., Parr E. B., Hawley J. A., Camera D. M. (2021). Can high-intensity interval training promote skeletal muscle anabolism? Sports Med. 51, 405–421. doi:10.1007/s40279-020-01397-3
Carabello R. J., Reid K. F., Clark D. J., Phillips E. M., Fielding R. A. (2010). Lower extremity strength and power asymmetry assessment in healthy and mobility-limited populations: reliability and association with physical functioning. Aging Clin. Exp. Res. 22 (4), 324–329. doi:10.3275/6676
Carpes F. P., Mota C. B., Faria I. E. (2010). On the bilateral asymmetry during running and cycling – a review considering leg preference. Phys. Ther. Sport 11 (4), 136–142. doi:10.1016/j.ptsp.2010.06.005
Chan J. P. Y., Krisnan L., Yusof A., Selvanayagam V. S. (2020). Maximum isokinetic familiarization of the knee: implication on bilateral assessment. Hum. Mov. Sci. 71, 102629. doi:10.1016/j.humov.2020.102629
Clark D. J., Pojednic R. M., Reid K. F., Patten C., Pasha E. P., Phillips E. M., et al. (2013). Longitudinal decline of neuromuscular activation and power in healthy older adults. J. Gerontol. A Biol. Sci. Med. Sci. 68, 1419–1425. doi:10.1093/gerona/glt036
Coletti C., Acosta G. F., Keslacy S., Coletti D. (2022). Exercise-mediated reinnervation of skeletal muscle in elderly people: an update. Eur. J. Transl. Myol. 32, 10416. doi:10.4081/ejtm.2022.10416
Compston J. E., Flahive J., Hosmer D. W., Watts N. B., Siris E. S., Silverman S., et al. (2014). Relationship of weight, height, and body mass index with fracture risk at different sites in postmenopausal women: the global longitudinal study of osteoporosis in women (GLOW). J. Bone Min. Res. 29, 487–493. doi:10.1002/jbmr.2051
Cruz-Jentoft A. J., Bahat G., Bauer J., Boirie Y., Bruyère O., Cederholm T., et al. (2019). Sarcopenia: revised European consensus on definition and diagnosis. Age Ageing 48, 16–31. doi:10.1093/ageing/afy169
Dent E., Morley J. E., Cruz-Jentoft A. J., Arai H., Kritchevsky S. B., Guralnik J., et al. (2018). International clinical practice guidelines for sarcopenia (ICFSR): screening, diagnosis and management. J. Nutr. Health Aging 22, 1148–1161. doi:10.1007/s12603-018-1139-9
Gerstner G. R., Thompson B. J., Rosenberg J. G., Sobolewski E. J., Scharville M. J., Ryan E. D. (2017). Neural and muscular contributions to the age-related reductions in rapid strength. Med. Sci. Sports Exerc 49, 1331–1339. doi:10.1249/MSS.0000000000001231
Gibala M. J., Little J. P., Macdonald M. J., Hawley J. A. (2012). Physiological adaptations to low-volume, high-intensity interval training in health and disease. J. Physiol. 590, 1077–1084. doi:10.1113/jphysiol.2011.224725
Goodpaster B. H., Park S. W., Harris T. B., Kritchevsky S. B., Nevitt M., Schwartz A. V., et al. (2006). The loss of skeletal muscle strength, mass, and quality in older adults: the health, aging and body composition study. J. Gerontol. A Biol. Sci. Med. Sci. 61 (10), 1059–1064. doi:10.1093/gerona/61.10.1059
Guizelini P. C., De Aguiar R. A., Denadai B. S., Caputo F., Greco C. C. (2018). Effect of resistance training on muscle strength and rate of force development in healthy older adults: A systematic review and meta-analysis. Exp. Gerontol. 102, 51–58. doi:10.1016/j.exger.2017.11.020
Hayes L. D., Elliott B. T., Yasar Z., Bampouras T. M., Sculthorpe N. F., Sanal-Hayes N. E. M., et al. (2021). High intensity interval training (HIIT) as a potential countermeasure for phenotypic characteristics of sarcopenia: A scoping review. Front. Physiol. 12, 715044. doi:10.3389/fphys.2021.715044
Hester G. M., Ha P. L., Dalton B. E., Vandusseldorp T. A., Olmos A. A., Stratton M. T., et al. (2021). Rate of force development as a predictor of mobility in community-dwelling older adults. J. Geriatr. Phys. Ther. 44, 74–81. doi:10.1519/JPT.0000000000000258
Hurst C., Weston K. L., Weston M. (2019). The effect of 12 weeks of co mbined upper- and lower-body high-intensity interval training on muscular and cardiorespiratory fitness in older adults. Aging Clin. Exp. Res. 31, 661–671. doi:10.1007/s40520-018-1015-9
Izquierdo M., Merchant R. A., Morley J. E., Anker S. D., Aprahamian I., Arai H., et al. (2021). International exercise recommendations in older adults (ICFSR): expert consensus guidelines. J. Nutr. Health Aging 25, 824–853. doi:10.1007/s12603-021-1665-8
Jaric S., Radosavljevic-Jaric S., Johansson H. (2002). Muscle force and muscle torque in humans require different methods when adjustin g for differences in body size. Eur. J. Appl. Physiol. 87, 304–307. doi:10.1007/s00421-002-0638-9
Landi F., Liperoti R., Russo A., Giovannini S., Tosato M., Capoluongo E., et al. (2012). Sarcopenia as a risk factor for falls in elderly individuals: results from the ilSIRENTE study. Clin. Nutr. 31, 652–658. doi:10.1016/j.clnu.2012.02.007
Landi F., Cruz-Jentoft A. J., Liperoti R., Russo A., Giovannini S., Tosato M., et al. (2013). Sarcopenia and mortality risk in frail older persons aged 80 years and older: results from ilSIRENTE study. Age Ageing 42, 203–209. doi:10.1093/ageing/afs194
Laroche D. P., Villa M. R., Bond C. W., Cook S. B. (2017). Knee extensor power asymmetry is unrelated to functional mobility of older adults. Exp. Gerontol. 98, 54–61. doi:10.1016/j.exger.2017.08.008
Lera L., Albala C., Sánchez H., Angel B., Hormazabal M. J., Márquez C., et al. (2017). Prevalence of sarcopenia in community-dwelling Chilean elders according to an adapted version of the European working group on sarcopenia in older people (EWGSOP) criteria. J. Frailty Aging 6, 12–17. doi:10.14283/jfa.2016.117
Liu Q. Q., Xie W. Q., Luo Y. X., Li Y. D., Huang W. H., Wu Y. X., et al. (2022). High intensity interval training: A potential method for treating sarcopenia. Clin. Interv. Aging 17, 857–872. doi:10.2147/CIA.S366245
Lomborg S. D., Dalgas U., Hvid L. G. (2022). The importance of neuromuscular rate of force development for physical function in aging and common neurodegenerative disorders – a systematic review. J. Musculoskelet. Neuronal Interact. 22 (4), 562–586.
Machado D. R. L., Abdalla P. P., Bohn L., Stratton G., Mota J. (2022). Foreign allometric exponents adequately normalize isokinetic knee extension strength to identify muscle weakness and mobility limitation in Portuguese older adults: A cross-sectional study. BMC Geriatr. 22, 757. doi:10.1186/s12877-022-03413-9
Maffiuletti N. A., Aagaard P., Blazevich A. J., Folland J., Tillin N., Duchateau J. (2016). Rate of force development: physiological and methodological considerations. Eur. J. Appl. Physiol. 116 (6), 1091–1116. doi:10.1007/s00421-016-3346-6
Marriott C. F. S., Petrella A. F. M., Marriott E. C. S., Boa Sorte Silva N. C., Petrella R. J. (2021). High-intensity interval training in older adults: A scoping review. Sports Med. Open 7, 49. doi:10.1186/s40798-021-00344-4
Martinez-Valdes E., Falla D., Negro F., Mayer F., Farina D. (2017). Differential motor unit changes after endurance or high-intensity interval training. Med. Sci. Sports Exerc. 49, 1126–1136. doi:10.1249/MSS.0000000000001209
Marzuca-Nassr G. N., Artigas-Arias M., Olea M. A., Sanmartín-Calísto Y., Huard N., Durán-Vejar F., et al. (2020). High-intensity interval training on body composition, functional capacity and biochemical markers in healthy young versus older people. Exp. Gerontol. 141, 111096. doi:10.1016/j.exger.2020.111096
Mitchell W. K., Williams J., Atherton P., Larvin M., Lund J., Narici M. (2012). Sarcopenia, dynapenia, and the impact of advancing age on human skeletal muscle size and strength; a quantitative review. Front. Physiol. 3, 260. doi:10.3389/fphys.2012.00260
Moro T., Tinsley G., Bianco A., Gottardi A., Gottardi G. B., Faggian D., et al. (2017). High intensity interval resistance training (HIIRT) in older adults: effects on body composition, strength, anabolic hormones and blood lipids. Exp. Gerontol. 98, 91–98. doi:10.1016/j.exger.2017.08.015
Müller D. C., Izquierdo M., Boeno F. P., Aagaard P., Teodoro J. L., Grazioli R., et al. (2020). Adaptations in mechanical muscle function, muscle morphology, and aerobic power to high-intensity endurance training combined with either traditional or power strength training in older adults: A randomized clinical trial. Eur. J. Appl. Physiol. 120, 1165–1177. doi:10.1007/s00421-020-04355-z
Müller D. C., Boeno F. P., Izquierdo M., Aagaard P., Teodoro J. L., Grazioli R., et al. (2021). Effects of high-intensity interval training combined with traditional strength or power training on functionality and physical fitness in healthy older men: A randomized controlled trial. Exp. Gerontol. 149, 111321. doi:10.1016/j.exger.2021.111321
Nunes J. P., Marcori A. J., Ribeiro A. S., Cunha P. M., Kassiano W., Costa B. D. V., et al. (2022). Differential responsiveness for strength gain between limbs after resistance training in older women: impact on interlimb asymmetry reduction. J. Strength Cond. Res. 36 (11), 3209–3216. doi:10.1519/JSC.0000000000004240
Osawa Y., Studenski S. A., Ferrucci L. (2018). Knee extension rate of torque development and peak torque: associations with lower extremity function. J. Cachexia Sarcopenia Muscle 9, 530–539. doi:10.1002/jcsm.12285
Padilla Colon C. J., Sanchez Collado P., Cuevas M. J. (2014). Benefits of strength training for the prevention and treatment of sarcopenia. Nutr. Hosp. 29, 979–988. doi:10.3305/nh.2014.29.5.7313
Perry M. C., Carville S. F., Smith I. C., Rutherford O. M., Newham D. J. (2007). Strength, power output and symmetry of leg muscles: effect of age and history of falling. Eur. J. Appl. Physiol. 100, 553–561. doi:10.1007/s00421-006-0247-0
Portegijs E., Sipilä S., Rantanen T., Lamb S. E. (2008). Leg extension power deficit and mobility limitation in women recovering from hip fracture. Am. J. Phys. Med. Rehabil. 87 (5), 363–370. doi:10.1097/PHM.0b013e318164a9e2
Reid K. F., Fielding R. A. (2012). Skeletal muscle power: A critical determinant of physical functioning in older adults. Exerc Sport Sci. Rev. 40, 4–12. doi:10.1097/JES.0b013e31823b5f13
Reid K. F., Pasha E., Doros G., Clark D. J., Patten C., Phillips E. M., et al. (2014). Longitudinal decline of lower extremity muscle power in healthy and mobility-limited older adults: influence of muscle mass, strength, composition, neuromuscular activation and single fiber contractile properties. Eur. J. Appl. Physiol. 114, 29–39. doi:10.1007/s00421-013-2728-2
Samuel D., Wilson K., Martin H. J., Allen R., Sayer A. A., Stokes M. (2012). Age-associated changes in hand grip and quadriceps muscle strength ratios in healthy adults. Aging Clin. Exp. Res. 24 (3), 245–250. doi:10.1007/BF03325252
Schaun G. Z., Pinto S. S., Brasil B., Nunes G. N., Alberton C. L. (2019). Neuromuscular adaptations to sixteen weeks of whole-body high-intensity interval training compared to ergometer-based interval and continuous training. J. Sports Sci. 37, 1561–1569. doi:10.1080/02640414.2019.1576255
Sculthorpe N. F., Herbert P., Grace F. (2017). One session of high-intensity interval training (HIIT) every 5 days, improves muscle power but not static balance in lifelong sedentary ageing men: A randomized controlled trial. Med. Baltim. 96, e6040. doi:10.1097/MD.0000000000006040
Straight C. R., Brady A. O., Evans E. M. (2016). Asymmetry in leg extension power impacts physical function in community-dwelling older women. Menopause 23, 410–416. doi:10.1097/GME.0000000000000543
T Balachandran . A., Wang Y., Szabo F., Watts-Battey C., Schoenfeld B. J., Zenko Z., et al. (2023). Comparison of traditional vs. lighter load strength training on fat-free mass, strength, power and affective responses in middle and older-aged adults: A pilot randomized trial. Exp. Gerontol. 178, 112219. doi:10.1016/j.exger.2023.112219
Van Melick N., Meddeler B. M., Hoogeboom T. J., Nijhuis-Van Der Sanden M. W. G., Van Cingel R. E. H. (2017). How to determine leg dominance: the agreement between self-reported and observed performance in healthy adults. PLoS One 12, e0189876. doi:10.1371/journal.pone.0189876
Varesco G., Espeit L., Feasson L., Lapole T., Rozand V. (2019). Rate of force development and rapid muscle activation characteristics of knee extensors in very old men. Exp. Gerontol. 124, 110640. doi:10.1016/j.exger.2019.110640
Venturelli M., Reggiani C., Schena F. (2022). Beyond the current knowledge on sarcopenia: new insight on neuromuscular factors. Aging Clin. Exp. Res. 34, 1183–1185. doi:10.1007/s40520-022-02082-3
Vidal-Seguel N., Cabrera C., Ferrada L., Artigas-Arias M., Alegría-Molina A., Sanhueza S., et al. (2023). High-intensity interval training reduces the induction of neutrophil extracellular traps in older men using live-neutrophil imaging as biosensor. Exp. Gerontol. 181, 112280. doi:10.1016/j.exger.2023.112280
Wiegmann S., Felsenberg D., Armbrecht G., Dietzel R. (2021). Longitudinal changes in muscle power compared to muscle strength and mass. J. Musculoskelet. Neuronal Interact. 21 (1), 13–25.
Wu Z. J., Wang Z. Y., Gao H. E., Zhou X. F., Li F. H. (2021). Impact of high-intensity interval training on cardiorespiratory fitness, body composition, physical fitness, and metabolic parameters in older adults: A meta-analysis of randomized controlled trials. Exp. Gerontol. 150, 111345. doi:10.1016/j.exger.2021.111345
Add Comment