Preparation and characterization of LDC@ZnP NPs
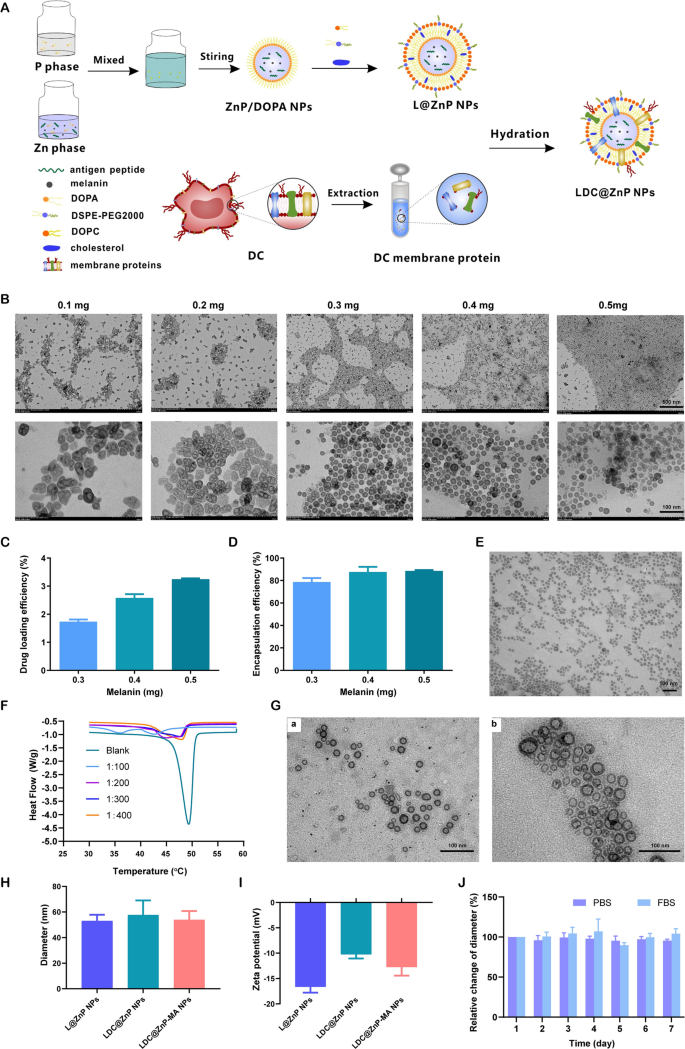
The peptide and melanin co-loaded LDC@ZnP NPs were fabricated by reverse microemulsion combined with film-hydration method [22]. The schematic illustration of preparation was shown in Fig. 1A. The NPs formation mainly consisted of two steps: (1) preparation of separate Zn and P phase under the existence of DOPA in cyclohexane/Igepal CO-520 system. (2) formation of zinc phosphate precursors [26]. As shown in Additional file 1: Fig. S1, blank ZnP NPs displayed regular morphology and homogeneous distribution. To determine whether melanin impacted NP formation, different amount of melanin (0.1 mg, 0.2 mg, 0.3 mg, 0.4 mg and 0.5 mg) was added into the oil system of Zn phase, respectively. After interaction with P phase, the nanoparticles were collected by centrifugation, dispersed with chloroform and observed by TEM. As shown in Fig. 1B, when the amount of melanin was 0.3–0.5 mg, the nanoparticles presented regularly near-spherical with the optimal morphology at 0.4 mg. The loading efficiency of melanin by the nanoparticles was further determined. The drug loading efficiency increased with the increasing input of melanin (Fig. 1C). For the encapsulation efficiency, when the amount of melanin was 0.4 and 0.5 mg, both the encapsulation rate was around 90% (Fig. 1D). As the prepared ZnP NPs were hydrophobic, the NPs required hydrophilic modification for further application. Lipid envelopment is a commonly used method to modify the surface characteristics of nanoparticles to improve the stability and biocompatibility [27]. To obtain hydrophilic NPs, the ZnP NPs in chloroform were spun together with DOPC, cholesterol, and DSPE-PEG2000 (molar ratio 4:4:1) to form a thin film. After hydration, lipid-enveloped zinc phosphate nanoparticles (L@ZnP NPs) were obtained, which displayed similar morphology as ZnP NPs (Fig. 1E). The hydrophobic nanoparticles were transformed into nanoparticles that could disperse stably in aqueous solution by lipid envelopment, which solved the aggregation problem of ZnP NPs and was more conducive to the application of nanoparticles under physiological conditions.
To further functionalize L@ZnP NPs with dendritic cells, dendritic cell membrane proteins with different protein/phospholipid weight ratios (1:0, 1:100, 1:200, 1:300, 1:400) were added into PBS for hydration. Followed by an intense vortex for 3 min, ultrasound for 3 min, and incubation at 37 oC water bath for 30 min, dendritic cell membrane protein hybrid zinc phosphate nanoparticles (LDC@ZnP NPs) were obtained. The protein profile of LDC@ZnP NPs was determined by sodium dodecyl sulfate polyacrylamide gel electrophoresis (SDS-PAGE). As shown in Additional file 1: Fig. S2, the protein in LDC@ZnP NPs matched with the parent cells, indicating the successful incorporation of DC membrane proteins in LDC@ZnP NPs. And the major membrane protein components could involve integral or lipid-anchored plasma membrane, cytosolic, cytoskeletal, peripheral, and secreted proteins [28, 29]. Then, the nanoparticles with different amounts of dendritic cell membrane proteins were freeze-dried and weighed. The corresponding temperature rise curve was obtained by a differential scanning calorimeter (DSC). As shown in Fig. 1F, when the protein/phospholipid weight ratio was 1:300 and 1:400, the nanosystem formed a single peak, indicating that cell membrane proteins were uniformly inserted into the phospholipid layer on the surface of the nanoparticles. For a larger amount of dendritic cell membrane protein insertion, 1:300 was chosen to prepare the dendritic cell membrane protein hybrid nanovaccine. TEM was further used to observe the membrane protein hybrid nanoparticles. As shown in Fig. 1G (a), the insertion of membrane proteins did not affect the morphology of melanin-loaded hybrid nanoparticles (LDC@ZnP-M NPs). Then the antigen peptide Adpgk and melanin co-loaded dendritic cell hybrid nanoparticles (LDC@ZnP-MA NPs) were prepared by the similar method. When the drug-fed amounts were 0.4 mg melanin and 0.25 mg peptide, the encapsulation efficiency of melanin and peptide by nanovaccine were 87.6 ± 4.6% and 57.2 ± 10.0%, respectively. The morphology of drug co-loaded hybrid nanoparticles showed a nearly spherical distribution as displayed in Fig. 1G (b).
Then the hydration particle size and zeta potential of nanoparticles were measured by DLS. As shown in Fig. 1H, I, compared with L@ZnP NPs, the particle size and potential values of blank LDC@ZnP NPs and drug-coloaded LDC@ZnP-MA NPs were slightly increased. The particle size was around 30 nm while the zeta potential was about − 10 mV. The stability of nanoparticles in PBS and FBS was further monitored by DLS, and there was no significant difference in the change of particle size during one week (Fig. 1J).
Preparation and characterization of LDC@ZnP NPs. A Schematic illustration for preparation of LDC@ZnP NPs. B TEM image of ZnP NPs with different amounts of melanin adding. The scale bar for the upper layer was 500 nm. The scale bar for the lower layer was 100 nm. C Drug loading efficiency by ZnP NPs with different amounts of melanin adding (n = 3). D Encapsulation efficiency by ZnP NPs with different amounts of melanin adding (n = 3). E TEM image of L@ZnP-M NPs, scale bar = 100 nm. F DSC curves of LDC@ZnP NPs with different amounts of DC membrane protein insertion. G TEM images of LDC@ZnP-M NPs (a) and LDC@ZnP-MA NPs (b), scale bar = 100 nm. H Hydration particle size of L@ZnP NPs, LDC@ZnP NPs and LDC@ZnP-MA NPs (n = 3). I Zeta potential of L@ZnP NPs, LDC@ZnP NPs and LDC@ZnP-MA NPs (n = 3). J Stability of LDC@ZnP NPs in PBS and FBS (n = 3)
The in vitro photothermal effect of LDC@ZnP-M NPs
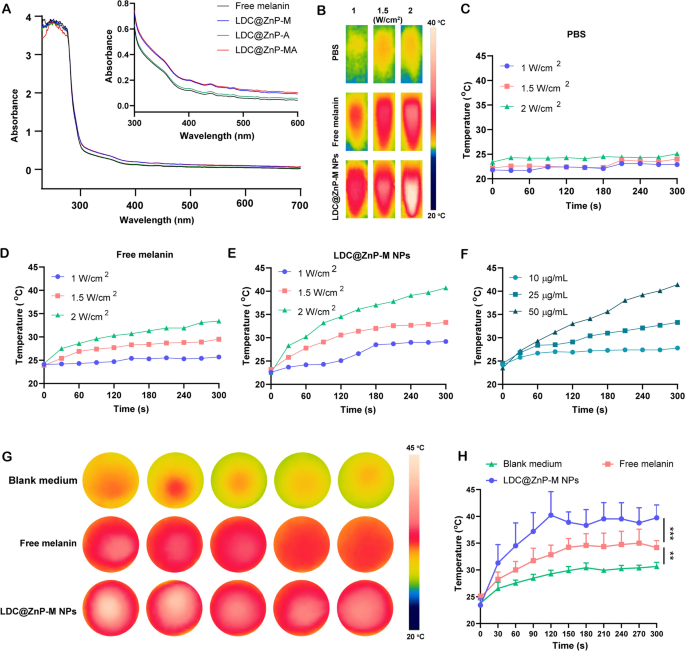
Firstly, UV absorption of free melanin, Adpgk loaded dendritic cell hybrid nanoparticles (LDC@ZnP-A NPs), LDC@ZnP-M NPs, and LDC@ZnP-MA NPs was detected by UV-VIS absorption spectroscopy, respectively. Free melanin is poorly soluble in PBS while LDC@ZnP-M NPs and LDC@ZnP-MA NPs enhanced the soluble status of melanin by nanoparticle entrapment. And the enhanced solubility is correlated with the absorption in UV spectra [30]. As a result, LDC@ZnP-M NPs and LDC@ZnP-MA NPs showed similarly stronger absorption in the near infrared region than free melanin and LDC@ZnP-A NPs (Fig. 2A). Then to monitor the photothermal effect under NIR irradiation, PBS, Free melanin and equivalent LDC@ZnP-M NPs were exposed to 808 nm laser at different laser powers. The real-time temperature of each group was recorded by infrared thermal imaging camera. As shown in Fig. 2B–E, PBS showed negligible temperature change under different power. Free melanin and LDC@ZnP-M NPs showed enhanced photothermal effect with the increase of irradiation power and time. Notably, LDC@ZnP-M NPs displayed more remarkable temperature increase than free melanin. Among the three irradiated powers, 2 W/cm2 irradiation could achieve a satisfied mild-heat effect of LDC@ZnP-M NPs and was thereby selected for follow-up experiments. Then the nanoparticles were diluted into a series of concentrations with PBS and irradiated with 2 W/cm2 laser. As shown in Fig. 2F, the photothermal effect of LDC@ZnP-M NPs was in a dose-dependent manner. Moreover, the photothermal effect of LDC@ZnP-MA NPs (50 µg/mL melanin, 20 µg/mL Adpgk) was monitored under 2 W/cm2 irradiation for 5 min. A shown in Additional file 1: Fig. S3, LDC@ZnP-MA NPs displayed similar profile with LDC@ZnP-M NPs, indicating that the peptide loading showed negligible impact on photothermal effect of NPs. Then the intracellular photothermal effect of LDC@ZnP-M NPs was investigated. BMDCs were treated with blank medium, free melanin (50 µg/mL) and equivalent LDC@ZnP-M NPs, respectively. After 4 h, the supernatant was discarded and PBS was added. The plate was placed at room temperature and irradiated with 808 nm laser at 2 W/cm2. Temperatures were recorded at different time points (0 s, 30 s, 60 s, 90 s, 120 s, 150 s, 180 s, 210 s, 240 s, 270 s, 300 s). As Fig. 2G, H showed, compared with blank medium and free melanin, LDC@ZnP-M NPs increased rapidly within 120 s and then maintained at about 42 ℃, showing a good intracellular mild photothermal effect.
Photothermal effect of LDC@ZnP NPs. A UV absorption spectra of free melanin and different nanoparticles. B Photothermal imaging of PBS, free melanin (50 µg/mL) and equivalent LDC@ZnP-M NPs under NIR irradiation for 5 min with different irradiation powers. C–E Photothermal profiles of PBS (C), free melanin (D) and LDC@ZnP-M NPs (E). F Photothermal profiles of LDC@ZnP-M NPs with different concentrations. G Photothermal images of blank medium, free melanin and LDC@ZnP-M NPs (n = 5). H Photothermal profiles of blank medium, free melanin and LDC@ZnP-M NPs (n = 5), **p < 0.01, ***p < 0.001
The in vitro interaction of LDC@ZnP NPs and BMDCs
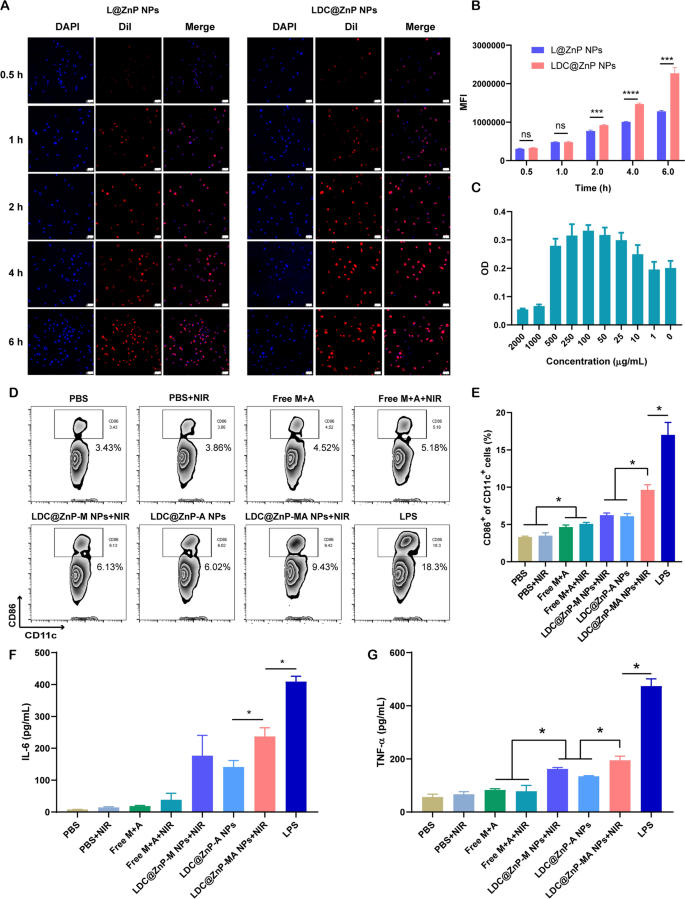
L@ZnP NPs and LDC@ZnP NPs were labeled with fluorescent dye DiI [31], and incubated with BMDCs for 0.5, 1, 2, 4, and 6 h, respectively, to determine the internalization behaviors of NPs. To visualize the intracellular uptake, the cells were stained with DAPI and observed by confocal microscope. As shown in Fig. 3A, the uptake of L@ZnP and LDC@ZnP NPs by DCs was time-dependent. Within a relatively short period of 0.5 and 1 h, homologous targeting of LDC@ZnP NPs to DCs was not obvious. With incubation time prolonging, the uptake of LDC@ZnP NPs by DCs was remarkably enhanced than that of L@ZnP NPs. Furthermore, flow cytometry was used for quantitative analysis of cell uptake. It showed a similar tendency as the results of confocal images (Fig. 3B). These results indicated that the hybrid of DC membrane proteins to L@ZnP NPs could achieve the homologous targeting effect to DCs. It could be attributed to the molecule-mediated homotypic cell surface interactions, which would promote intracellular antigen accumulation in DCs [32].
After uptake antigen, immature DCs need to undergo maturation for antigen presentation [33]. Here, the cytotoxicity of LDC@ZnP-MA NPs to BMDCs was firstly investigated before conducting other assays. LDC@ZnP-MA NPs were diluted into a series of concentrations (NPs amount) with medium. As displayed in Fig. 3C, LDC@ZnP-MA NPs caused toxicities to BMDCs at high doses of 1000 and 2000 µg/mL. When the dose was lower than 500 µg/mL, the NPs were safe for DCs. Notably, DCs were proliferative at the doses varying from 10 to 500 µg/mL compared to the control group, suggesting that LDC@ZnP-MA NPs promoted the proliferation of BMDCs. It could be attributed to that the stimulation to DC promotes the expansion of DCs [34, 35]. Then the photothermal safety was investigated when combined with NIR irradiation. 5 µg/mL and 10 µg/mL of LDC@ZnP-M NPs (corresponding to 193 and 385 µg/mL NPs) were used to incubate with BMDCs. After co-incubating for 4 h, the supernatant was discarded and replaced with fresh medium. Then the cells were placed on the thermostat controlled hot plate (37 ℃) to maintain the cell viability, irradiated with 808 nm laser for different time and continued to culture for another 20 h. After irradiating for 2 min, the temperature of 5 µg /mL and 10 µg /mL LDC@ZnP-M NPs (melanin amount) treated cells were 38.9 ± 0.6 ℃ and 41.2 ± 0.8 ℃, respectively, which were no more than the cytotoxic temperature above 42 ℃. As shown in Additional file 1: Fig. S4, both 5 µg /mL and 10 µg /mL LDC@ZnP-M NPs showed good photothermal safety compared to blank medium. Notably, the cell viabilities of LDC@ZnP-M NPs treated cells were remarkably higher than blank medium, which could be attributed to the immune stimulation of LDC@ZnP-M NPs to DCs. Moreover, to determine the stimulation of LDC@ZnP-MA NPs on DC maturation, BMDCs were incubated with PBS+/-NIR, Free M + A+/-NIR (10 µg/mL melanin, 4 µg/mL Adpgk), equivalent LDC@ZnP-M NPs + NIR (corresponding to 385 µg/mL NPs), LDC@ZnP-A NPs, LDC@ZnP-MA NPs + NIR and LPS (1 µg/mL) for 4 h and replaced with fresh medium. For the groups with NIR irradiation, the cells were exposed to 2 W/cm2 laser for 2 min. After another 20 h, the cells were collected and stained with DC (CD11c) and maturation maker (CD86) and detected by flow cytometry. As shown in Fig. 3D, E, LPS can significantly up-regulate the proportion of CD11c+CD86+ matured DCs. Compared with Free M + A+/-NIR, LDC@ZnP-M NPs + NIR mediated photothermal therapy or LDC@ZnP-A NPs-mediated immunotherapy, LDC@ZnP-MA NPs + NIR-mediated combinational therapy had a significant stimulatory effect on DC maturation. Accompany with maturation process, DCs are prone to secret immunostimulatory cytokines to the extracellular environment. Here the supernatant was centrifuged to get rid of the cells and debris and measured by ELISA kits. Interleukin 6 (IL-6) is obligated to induce T cell-mediated autoimmunity [36]. Tumor necrosis factor-alpha (TNF-α) is a mediator in cellular immunity, which could promote the cross-presentation by DCs [37]. As shown in Fig. 3F, G, secretion levels of IL-6 and TNF-α were remarkably enhanced in LDC@ZnP-MA NPs + NIR treated groups. The results indicated that LDC@ZnP NPs can be effectively uptake and processed by DCs.
The in vitro interaction of LDC@ZnP NPs and BMDCs. A Confocal images of BMDCs after incubation with L@ZnP NPs and LDC@ZnP NPs. Cell nuclei were stained with DAPI, scale bar = 50 μm. B Quantitative uptake of L@ZnP NPs and LDC@ZnP NPs by BMDCs detected by flow cytometer (n = 3), ns: not significant, ***p < 0.001, ****p < 0.0001. C The OD values of BMDCs incubated with different amounts of LDC@ZnP-MA NPs (n = 4). D Flow scatter plots of CD11c+CD86+ cells. E Quantitative analysis of CD11c+CD86+ cells (n = 3), *p < 0.05. F The level of IL-6 in the supernatant of BMDCs (n = 3), *p < 0.05. G The level of TNF-α in the supernatant of BMDCs (n = 3), *p < 0.05
Lymphatic reflux of LDC@ZnP NPs
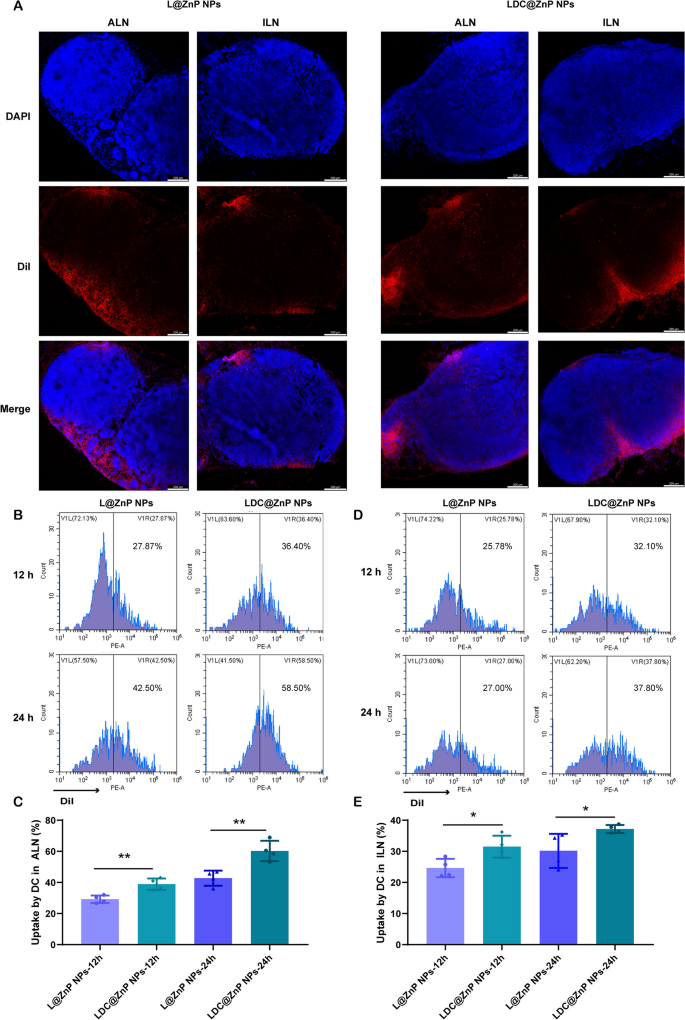
It has been evidenced that the in vivo biodistribution of nanoparticles is related with properties of nanoparticles including the elemental-chemical compositions, size distribution, shape, surface hydrophobicity, agglomeration state, optical properties, etc. [38, 39]. Generally, the drug loading in the core of nanoparticles with core-shell structure has negligible influence to these properties, leading to the similar biodistribution behavior of drug-loaded nanoparticles with blank nanoparticles. Herein, L@ZnP NPs and LDC@ ZnP NPs were used to monitor the in vivo biodistribution. TDLNs play a significant role in cancer immunotherapy, especially for vaccines. As inguinal and axillary lymph nodes are the most important TDLNs after subcutaneous injection of nanovaccine [40], DiI labeled L@ZnP and LDC@ZnP NPs were then injected subcutaneously into the axillary and inguinal regions of C57BL/6 mice, respectively. After 24 h, the mice were sacrificed for the collection of ALNs and ILNs. The tissues were prepared for frozen sections and stained with DAPI. As shown in Fig. 4A and Additional file 1: Fig. S5, the red fluorescence of LDC@ZnP NPs was stronger in both ALNs and ILNs when compared with L@ZnP NPs. Interestingly, for both L@ZnP NPs and LDC@ZnP NPs, the fluorescence intensity and distribution in the ALNs were enhanced than those in ILNs. To further evaluate the cell uptake behavior by DCs in LNs, ALNs and ILNs were collected for flow cytometry analysis after subcutaneous administration of DiI labeled LZnP and LDC@ZnP NPs. At 12 and 24 h post-injection, the lymphocytes in LNs were stained with CD11c. As shown in Fig. 4B–E, with the extension of injection time, the uptake of both nanoparticles by DCs were obviously increased. Compared with DCs in ILN, DCs in ALN uptake more L@ZnP NPs and LDC@ZnP NPs. Similar to the in vitro uptake behavior by BMDCs, LDC@ZnP NPs showed enhanced internalization by both ALN and ILN DCs than LZnP NPs. In combination with the distribution and uptake of LDC@ZnP NPs, ALNs could be more suitable as the tumor-draining lymph nodes.
Lymphatic reflux of LDC@ZnP NPs. A Distribution of L@ZnP NPs and LDC@ZnP NPs in ALNs and ILNs, scale bar = 200 μm. B Uptake of L@ZnP NPs and LDC@ZnP NPs by DCs in ALNs. C Quantitative analysis of L@ZnP NPs and LDC@ZnP NPs uptake behaviors by DCs in ALNs (n = 4), **p < 0.01. D Uptake of L@ZnP NPs and LDC@ZnP NPs by DCs in ILNs. E Quantitative analysis of L@ZnP NPs and LDC@ZnP NPs uptake behaviors by DCs in ILNs (n = 4), *p < 0.05
Biodistribution of LDC@ZnP NPs
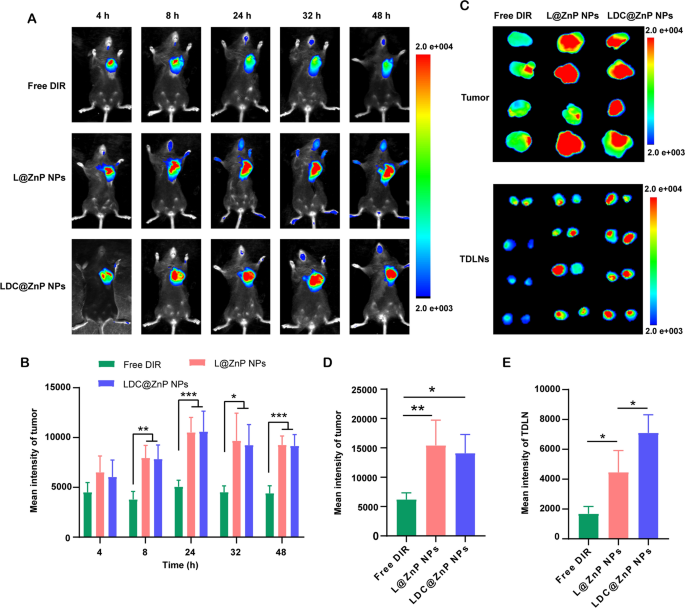
MC38 cells were inoculated at the right flank of female C57BL/6 mice. When the tumor volume reached around 500 mm3, the mice were randomly divided into three groups. The near-infrared dye DIR, DIR-labeled L@ZnP or LDC@ZnP NPs were injected subcutaneously to the tumor-bearing mice to track the in vivo biodistribution. Fluorescence images were monitored at different time points (4, 8, 24, 32, 48 h). Different with healthy blood vessels, the blood vessels surrounding tumor are usually discontinuous and irregular owing to the excessive secretion of angiogenic factors by tumor. These malformed blood vessels are lack of basement membrane, thereby displaying increased permeability with enlarged intercellular gaps [41]. Moreover, a dynamic blood vessel bursts happened in tumor blood vessels, which allowed the outflow fluid extravasate into the interstitial space of tumor [42]. As shown in Fig. 5A, the distribution of L@ZnP NPs and LDC@ZnP NPs in tumors increased during 4 to 24 h, reached a peak at 24 h, and maintained a relatively strong fluorescence intensity at 48 h. Fluorescence quantitative results showed that there was no significant difference in the fluorescence intensity between L@ZnP NPs and LDC@ZnP NPs in tumors (Fig. 5B). The delivery of NPs to tumor could be attributed to the formation of large-size gaps as well as the dynamic vascular vent in tumor blood vessels. At 48 h post-injection, the mice were sacrificed. The tumor tissues and TDLNs were stripped for ex vivo near-infrared imaging. As shown in Fig. 5C, D, the ex vivo fluorescence of tumor was consistent with the in vivo results. Notably, LDC@ZnP NPs treated group showed increased fluorescence intensity in TDLNs than L@ZnP NPs treated group (Fig. 5E), further indicating the lymphatic reflux effect of LDC@ZnP NPs in vivo. Moreover, the major tissues, including heart, liver, spleen, lung and kidney, were also dissected. As presented in Additional file 1: Fig. S6, Free DIR, L@ZnP NPs and LDC@ZnP NPs were distributed in all tissues while showing a major distribution in the livers with rich blood supply, indicating that LDC@ZnP NPs can be absorbed subcutaneously into the bloodstream.
Biodistribution of LDC@ZnP NPs in vivo. A In vivo images of Free DIR, L@ZnP NPs and LDC@ZnP NPs treated mice at different time points. B Fluorescence quantization of in vivo tumors at different time points (n = 4), *p < 0.05, **p < 0.01, ***p < 0.001. C Ex vivo images of Free DIR, L@ZnP NPs, and LDC@ZnP NPs treated tumors and TDLNs at 48 h post injection (n = 4). D Fluorescence quantization of ex vivo tumors at 48 h post injection (n = 4), *p < 0.05, **p < 0.01. E Fluorescence quantitation of Free DIR, L@ZnP NPs and LDC@ZnP NPs in ex vivo TDLNs (n = 4), *p < 0.05
In vivo antitumor effect mediated by LDC@ZnP NPs
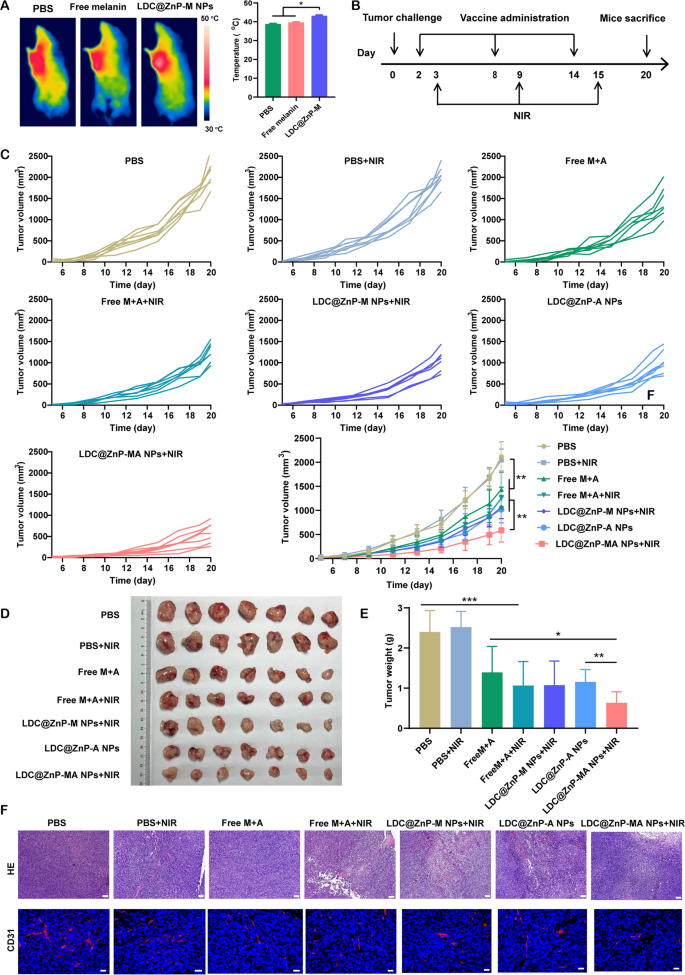
Prior to investigating the antitumor efficiency of LDC@ZnP NPs, the in vivo photothermal effect was determined in tumor-bearing C57BL/6 mice. The mice were administered with PBS, Free melanin, and LDC@ZnP-M NPs. After 24 h, the mice in each group were anesthetized with pentobarbital sodium and irradiated with 808 nm laser. The temperature of LDC@ZnP-M NPs treated tumors could increase to around 42 oC within 2 min while that of PBS and Free melanin were lower than 40 oC (Fig. 6A). To further determine the impact of peptide coloading on the heating effect of NPs, the in vivo photothermal effect of LDC@ZnP-MA NPs were evaluated after subcutaneous injection. The corresponding amounts of melanin and Adpgk peptide were 50 µg and 20 µg, respectively. As Additional file 1: Fig. S7 displayed, LDC@ZnP-MA NPs can achieved approximately 42 ℃ after irradiation for 2 min (2 W/cm2), which were similar as LDC@ZnP-M NPs. Then the in vivo antitumor effect of different treatments was investigated. 1.25 × 10⁵ MC38 cells were inoculated into the right frank of C57BL/6 mice. PBS, PBS + NIR, Free M + A (50 µg melanin and 20 µg Adpgk), Free M + A + NIR, LDC@ZnP-M NPs + NIR, LDC@ZnP-A NPs, LDC@ZnP-MA NPs + NIR were given to the tumor-bearing mice, respectively. The vaccination and irradiation followed the protocol in Fig. 6B. The mental and physiological conditions as well as body weight were monitored. During the therapeutic period, the body weight of all treated mice showed an increased tendency (Additional file 1: Fig. S8A), indicating the biosafety of LDC@ZnP NPs. Meanwhile, tumor growth was monitored by recording the width and length of tumor. As presented in Fig. 6C, the tumor growth of PBS + NIR treated mice were similar with PBS, demonstrating the photothermal safety of NIR in vivo. Compared with Free M + A and Free M + A + NIR treated mice, the antitumor effect of LDC@ZnP NPs was more obvious. LDC@ZnP-M NPs + NIR or LDC@ZnP-A NPs mediated immunotherapy displayed comparable tumor suppression. Notably, the combination of peptide and mile heat inspired immunotherapy mediated by LDC@ZnP-MA NPs + NIR showed the best tumor inhibition performance among all treatments. Consisting with the results of tumor volume, the excised tumor image (Fig. 6D) and tumor mass (Fig. 6E) also evidenced the effective antitumor activity of LDC@ZnP-MA NPs. Furthermore, the tumor inhibitory rates were calculated by contrast with PBS. Accordingly, LDC@ZnP-MA NPs treated mice presented the highest tumor inhibitory rate of 73.5% (Additional file 1: Fig. S8B). Afterwards, HE and CD31 immunofluorescent staining of tumor sections was conducted to better explore the antitumor outcomes of LDC@ZnP NPs. As displayed with the largest areas of tumor lysis and necrosis, LDC@ZnP-MA NPs showed superior therapeutic effect among all treatments. CD31, highly expressed on endothelial cells, is well established to monitor the vessel density in malignant tissues [43]. As shown in Fig. 6F, a reduction of CD31 expression was observed in LDC@ZnP NPs treated tumors.
In vivo antitumor effects of LDC@ZnP NPs. A The in vivo photothermal images (left) and temperature (right) after irradiating with 808 nm laser for 2 min (n = 3), *p < 0.05. B Time schedule of treatment. C Tumor growth curves of MC38 treated by different formulations (n = 7), *p < 0.05, **p < 0.01. D Images of dissected tumors (n = 7). E Tumor weight in each group (n = 7), *p < 0.05, **p < 0.01, ***p < 0.001. F HE and CD31 staining images of tumor tissue after different treatments, scale bars were 200 nm for HE and 20 nm for CD31 staining, respectively
The antitumor immune responses elicited by LDC@ZnP NPs
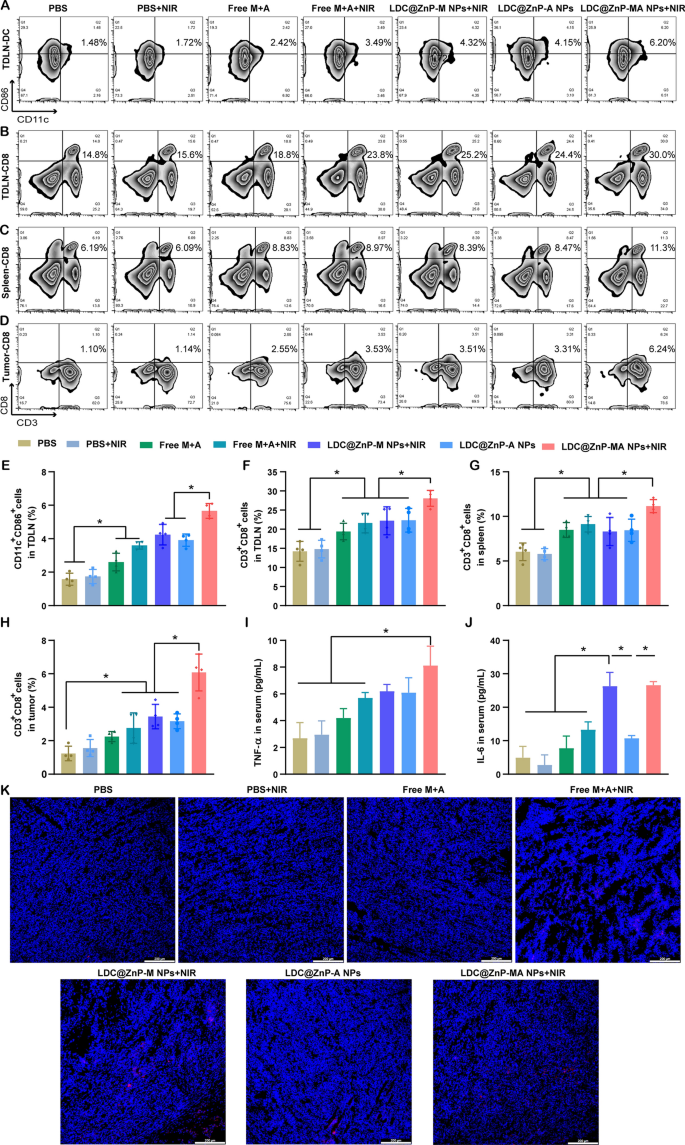
To explore the underlying mechanism of LDC@ZnP NPs mediated immunotherapy, we analyzed the immune cells and cytokines after 48 h of last injection. TDLNs are correlated with antitumor immunity due to the specific location and roles. We have evidenced that LDC@ZnP NPs can effectively reflux to TDLNs and be uptake by DCs. As DC maturation was essential for antigen presentation, here we firstly analyzed the in vivo DC maturation after vaccination by different formulations. As shown in Fig. 7A and E, the matured DCs in PBS + NIR, Free M + A, Free M + A + NIR, LDC@ZnP-M NPs + NIR, LDC@ZnP-A NPs, LDC@ZnP-MA NPs + NIR treated TDLNs were 1.1-, 1.7-, 2.3-, 2.7-, 2.5- and 3.6-fold compared with PBS, respectively. Notably, LDC@ZnP-MA NPs + NIR presented the highest DC maturation among all groups, which would be beneficial to induce subsequent antitumor immune response. As an important lymphoid tissue for systematic antitumor immunity, the DC maturation of spleen was also analyzed, which showed similar results as TDLNs (Additional file 1: Fig. S9). It was also found that DC infiltrated in tumor microenvironment, and LDC@ZnP-MA NPs + NIR treated groups increased DC population compared with the control group (Additional file 1: Fig. S10). After maturation, DCs would present the tumor associated antigens to T cells to elicit specific antitumor immunity [44]. As a crucial component of T cells, cytotoxic lymphocytes (CTLs, CD3+CD8+ cells) play an essential role in antitumor immunotherapy [45, 46]. Here, we analyzed CTLs in TDLNs, spleen, and tumor tissues. In TDLNs, the proportion of CTLs for PBS, PBS + NIR, Free M + A, Free M + A + NIR, LDC@ZnP-M NPs + NIR, LDC@ZnP-A NPs and LDC@ZnP-MA NPs + NIR were 14.2 ± 2.6%, 14.8 ± 2.36%, 19.4 ± 2.2%, 21.6 ± 2.6%, 22.2 ± 3.7%, 22.3 ± 3.1% and 28.1 ± 2.1%, respectively (Fig. 7B, F). Meanwhile, CTLs in spleen of PBS, PBS + NIR, Free M + A, Free M + A + NIR, LDC@ZnP-M NPs + NIR, LDC@ZnP-A NPs and LDC@ZnP-MA NPs + NIR treated mice were 6.0 ± 1.0%, 5.8 ± 0.6%, 8.5 ± 0.8%, 9.1 ± 0.9%, 8.3 ± 1.6%, 8.4 ± 1.2% and 11.2 ± 0.7%, respectively (Fig. 7C and G). For tumor microenvironment, the infiltration of CD3+CD8+ cells in LDC@ZnP-MA NPs + NIR treated group was 4.9-, 3.9-, 2.7-, 2.2-, 1.8-, and 1.9-fold than in PBS, PBS + NIR, Free M + A, Free M + A + NIR, LDC@ZnP-M NPs + NIR, LDC@ZnP-A NPs treated groups, respectively (Fig. 7D and H). CD4+ helper T cells, an important subset of T cells, promote both the effector and memory functions of CTLs and help CTLs to overcome negative regulations [47]. After vaccination by LDC@ZnP-MA NPs + NIR, the percentage of CD3+CD4+ cells were remarkably enhanced compared with other treatments (Additional file 1: Fig. S11, S12). Moreover, the release of immunostimulatory cytokines after different vaccinations was determined by ELISA. As presented in Fig. 7I, J, the serum levels of TNF-α and IL-6 showed the highest secretion in LDC@ZnP-MA NPs + NIR treated mice among all the groups. The immunofluorescent staining of IL-6 in tumor sections displayed similar results (Fig. 7K). These results suggested that the combination of tumor associated antigen and mild heat inspired immunotherapy could induce effective antitumor immune responses.
The antitumor immune responses elicited by LDC@ZnP NPs. The mice were treated with PBS, PBS + NIR, Free M + A, Free M + A + NIR, LDC@ZnP-M NPs + NIR, LDC@ZnP-A NPs and LDC@ZnP-MA NPs + NIR, respectively. A Flow scatter plots of CD11C+CD86+ cells in TDLNs. B Flow scatter plots of CD3+CD8+ cells in TDLNs. C Flow scatter plots of CD3+CD8+ cells in spleens. D Flow scatter plots of CD3+CD8+ cells in tumor tissues. E Quantitative analysis of CD11C+CD86+ cells in TDLNs (n = 4), *p < 0.05. F Quantitative analysis of CD3+CD8+ cells in TDLNs (n = 4), *p < 0.05. G Quantitative analysis of CD3+CD8+ cells in spleens (n = 4), *p < 0.05. H Quantitative analysis of CD3+CD8+ cells in tumors (n = 4), *p < 0.05. I Serum levels of TNF-α (n = 3), * p < 0.05. J Serum levels of IL-6 (n = 3), *p < 0.05. K Immunofluorescent staining of IL-6 in tumor sections. The nuclei were stained with DAPI, scale bar = 200 μm


Add Comment