Structural and chemical characterisation
The elemental composition of Ti3Au thin films doped with Cu/Ag measured using EDX technique, along with their cross-section thickness are presented in Table 1. The table compares the stoichiometric Ti:Au ratio in Cu/Ag doped Ti3Au thin films against the Ti:Au ratio of 2.7:1 (73.3:26.7 at%) registered for the standard undoped Ti3Au thin film. It can be seen that all of the Ti3Au thin films doped with Cu/Ag never deviate by more than 0.3 from the required Ti:Au ratio of 3. The level of Cu doped in Ti3Au thin films varies from 0.5 to 7.1 at% whereas the Ag level ranges from 0.2 to 4.2 at%. The higher sputter rates of Ag/Cu doping elements is evident from the increase in the film thickness observed with increasing number of target inserts. Cu doped Ti3Au films register an increase from 900 nm with 1 insert to 1130 nm when the number of inserts is increased to 8. Similarly, the Ti3Au films doped with Ag increase from 1220 to 1560 nm with increase in number of dopant inserts from 1 to 8. The relative increased thickness of Ag doped samples compared to Cu doped ones is due to agglomeration of Ag particles on the film surface, as shown later in the SEM images in Surface and cross section characterisations section.
SIMS analysis was performed on the Ti3Au films with the lowest and highest concentration of Cu (SCu1 and SCu4) and Ag (SAg1 and SAg4) dopants and depth profiles for each element are shown in Fig. 2. The SIMS results are used to convey the relative variation of each individual element with the depth of thin film but unlike EDX measurement, it is not a representation of relative concentration between elements and therefore cannot be used to compare stoichiometry of the thin film. In all four films, Ti [black line] registers a steady profile throughout the film thickness, with a small increment at the film-substrate interface (vertical dotted line). Other main components of the Ti6Al4V substrate, Al [red line] and V [blue line] peak sharply around the film-substrate interface. Au [purple line] intensity follows the opposite trend being consistent throughout the thin film and dropping sharply at the film-substrate interface. Cu doped films (Fig. 2a and b) exhibit a steady presence of Cu [green line] throughout the thin film depth and similarly the films doped with Ag (Fig. 2c and d), show a steady presence of Ag [green line] throughout the film thickness. There is no discernible drop in Cu or Ag signals at the film-substrate interface due to their relatively low concentrations in the films. There is a 10% increment in the intensity of the Cu signal when moving from sample SCu1 (Fig. 2a) to sample SCu4 (Fig. 2b). Similarly, the intensity of the Ag signal increases by 7% between sample SAg1 (Fig. 2c) to SAg4 (Fig. 2d), but these changes are not clearly visible on the logarithmic scale. The increase in film thickness seen in profilometer measurements and cross section imaging is also supported in the SIMS profiles where, for example, sample SCu4 having a thickness of 1100 nm, took longer to sputter etch compared to SCu1 with a thickness of 900 nm.
Diffraction patterns of Cu/Ag doped Ti3Au thin films deposited on glass and Ti6Al4V substrates are presented in Fig. 3a to d. Stoichiometric addition of Au in the Ti leads to formation of Ti3Au intermetallic at a ratio of 3:1. This composition when deposited at elevated temperature of 450˚C leads to emergence of the β phase of this intermetallic. The peak position of the standard Ti3Au thin film [dashed blue line] shows an excellent match to the single phase β-Ti3Au intermetallic with preferential orientation along [200] and [400] directions (ICSD 58605 – dotted red line). On glass substrate, the Ti3Au thin film samples doped with Cu present main peak positions at 35.27˚ and 74.59˚ which shows presence of a well-defined β-Ti3Au intermetallic phase with preferential orientation along the {100} family of planes, in very good agreement with both standard Ti3Au film patterns as well as standard ICSD peak positions. The diffraction patterns for the Cu doped Ti3Au thin film samples deposited on Ti6Al4V substrates also suggest the presence of preferentially oriented β-Ti3Au. However, at higher Cu concentration (SCu4), the intensity of the (400) plane is reduced and the peak position is shifted to a higher angle, indicating that Cu ions are alloying into the Ti3Au matrix causing lattice distortions and in plane stress [41]. Apart from some very minor peaks for Cu based intermetallic like Ti3Cu4 (ICSD 629390) and TiCu4 (ICSD 629385) observed at 17.4˚ and 29.2˚ respectively, no other Cu peaks were observed. Cu (1.28 Å) has a smaller ionic radius when compared to Ti (1.47 Å) [42, 43] and therefore causes the changes in the crystal structure leading to a decrease in diffraction peak intensity and a shift to a higher angle [41].
On the other hand, addition of Ag leads to visible changes in the Ti3Au thin film diffraction pattern and therefore more significant changes in the structural arrangement. Preferential orientation along [200] and [400] directions observed in the standard Ti3Au thin film sample is disturbed with addition of Ag and new peaks positioned at 24.7˚, 39.6˚, 43.5˚ and 68.9˚, representative of (110), (210), (211) and (312) planes of the β-Ti3Au intermetallic phase, emerge. This is accompanied by a very steep reduction in intensity of the [200] and [400] peaks. For Ag rich thin films (SAg3 and SAg4), the [211] peak dominates, and one minor peak emerges around 37.9˚, aligning with the [111] orientation of the α-Ti3Au intermetallic (ICSD 58604). Thin film samples deposited on Ti6Al4V substrates are similar to their glass counterparts and present a shift from the (200) to (211) plane with increasing Ag content in the Ti3Au films. However, no independent peaks for Ag or Ti-Ag intermetallics are present. The eutectoid point of the Ti-Ag and Ti-Cu intermetallics is expected above 15.6 and 7 at%, respectively, and therefore it is no surprise that no independent phase of Ti-Ag alloy is visible in the diffraction patterns and with the Cu concentration barely exceeding the required 7 at% limit, the minor phase of Ti-Cu alloy formed only registers a weak intensity [44,45,46]. The crystallite size of each thin film sample, calculated from the dominant diffraction peak using Scherrer’s equation [47] is presented in Table 2. With addition of Ag to the Ti3Au matrix, the crystallite size initially increases to 54.7 nm but then begins to reduce to 48.3 nm as the (211) plane becomes dominant. Whereas with increasing Cu concentration no such changes occur in crystal orientation in the Ti3Au matrix, and the average crystallite size steadily increases from 50.3 to 54.1 nm.
Surface and cross section characterisations
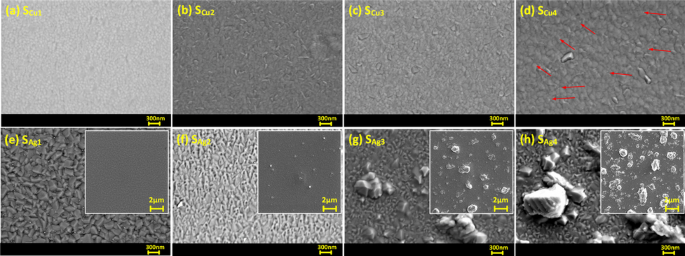
SEM images of surface topology of Cu doped Ti3Au thin films are presented in Fig. 4a to d (surface SEM image of standard Ti3Au thin film provided in Supplementary data 1 for comparison). Magnetron sputtered pure Ti thin films are known to develop well oriented sharp pyramidal shaped grains whereas β-Ti3Au thin films develop extremely dense domes with angular edges [1, 4, 48]. The SEM images show that the smallest addition of Cu (SCu1) causes development of light shaded spherical grains that are very well dispersed in the dark shaded Ti3Au matrix and such circular grains have previously been observed with addition of Cu in a Ti matrix [49]. With further increment of Cu in the matrix, this circular grain shape gives way to the development of elongated angular phases (SCu2) which continue to grow with further increase in Cu doping (SCu3 and SCu4). Very faint agglomeration or out transport of Cu particles is visible in the sample with the highest Cu concentration of 7.1 at% (Fig. 4d – zoomed image available in Supplementary data 1) and supports the generation of Ti-Cu intermetallic above eutectoid point of 7at% inTi-Cu phase diagrams and is also supported by the XRD results seen earlier.
SEM surface images of Ti3Au thin films doped with varying Cu/Ag concentrations; a Sample SCu1, b Sample SCu2, c Sample SCu3, d Sample SCu4, e Sample SAg1, f Sample SAg2, g Sample SAg3, and h Sample SAg4. Inset images show increasing Ag agglomeration on the surface with increasing Ag concentration in film
The surface topology of Ag doped Ti3Au thin films are presented in Fig. 4e to h, with low magnification inset images showing increasing Ag precipitation from the Ti3Au matrix. The Ti3Au thin film with the lowest Ag concentration (SAg1) retains the more angular grain features of the pure Ti3Au thin film [4] but with some faint white spots visible (mean size = 43 nm, std dev = 10) on the edges, suggesting initial precipitation of Ag particles. But with further addition of Ag in the matrix (SAg2), the angular grains transform into a flatter and cracked surface profile with increasing Ag agglomerations (mean size = 138 nm, std dev = 32) visible in between the features. This Ag agglomeration intensifies as more Ag is doped into the Ti3Au matrix, forming large Ag particles on the surface of sample SAg3 (mean size = 700 nm, std dev = 150) and SAg4 (mean size = 1018 nm, std dev = 80). Previous studies on Ag doped Ti-based alloys have demonstrated Ag precipitation with particle sizes reaching 200 nm for Ag concentrations as low as 9 at% in the film [50].
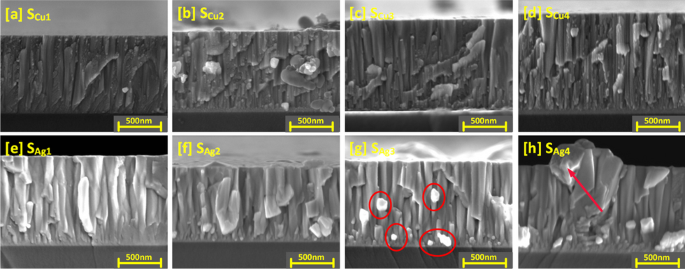
The structure of the Cu doped Ti3Au thin films is further explored with the cross-section SEM images shown in Fig. 5a to d (cross section SEM image of standard Ti3Au thin film provided in Supplementary data 2 for comparison). For sample SCu1, granular features can be observed, dispersed around the edges of the vertical columns, corresponding to the circular grains seen on the surface image of this sample. Formation of the Ti3Au phase is promoted by surface and intra-grain diffusion resulting from the high energy of incoming species when sputtered at very low deposition pressure and high substrate temperature [51]. This causes the incoming dopant species like Cu to be dispersed around the grain boundaries of the main phase leading to formation of such granular features at column boundaries. With further increases in Cu doping (SCu2 to SCu4), the spread of these granular features reduces, and the film structure becomes smoother, suggesting better diffusion of Cu from grain boundaries into the Ti3Au grains, resulting in formation of Ti-Cu intermetallic species. This observation is supported by presence of Ti-Cu peaks seen from XRD spectrum for this sample (Fig. 3) and from the granule development observed in the SEM surface images (Fig. 4).
Cross sectional SEM images of Ti3Au thin films doped with varying Cu/Ag concentrations; a Sample SCu1, b Sample SCu2, c Sample SCu3, d Sample SCu4, e Sample SAg1, f Sample SAg2, g Sample SAg3, and h Sample SAg4. Figs g–h are highlighted to show increasing Ag agglomeration with increasing Ag concentration in film
Cross section SEM images of Ag doped Ti3Au films are presented in Fig. 5e to h and shed more light on the Ag precipitation observed in the surface profiles. The cross-section image of sample SAg1 presents a well organised, tapered columnar structure with no observable Ag precipitation. With further increase of Ag concentration in sample SAg2, angular Ag grains begin to grow out of the main Ti3Au columnar structure and can be clearly seen as bright Ag precipitates in sample SAg3 between columns and on the surface in background. These precipitates continue to grow with further addition of Ag, leading to distortion of the Ti3Au columnar structure in sample SAg4. Previous studies have shown that such Ag precipitation negatively affects thin film density, leading to variation in key performance properties like mechanical hardness and corrosion resistance [52].
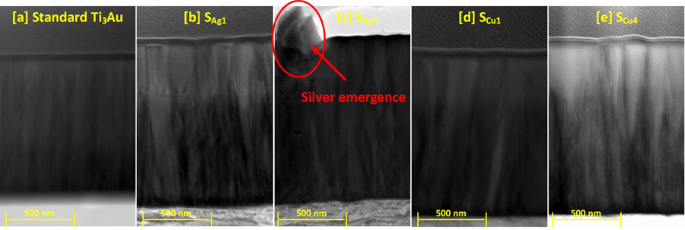
To further understand the cross-sectional microstructure of the thin films, TEM images were developed for the samples with lowest and highest concentration of Cu and Ag dopant elements, see Fig. 6a to e. For sample SAg1, presence of a small dopant concentration of Ag particles causes a wrinkled effect around the column boundaries disturbing the straight, dense, and well oriented columnar structure of the standard Ti3Au thin films. However, at higher Ag dopant concentration like in sample SAg4, the agglomeration of silver becomes strong enough to precipitate out in between the column boundaries. On the other hand, the addition of Cu in low dopant concentrations like in SCu1, causes no drastic change in the column structure and at the highest dopant concentration, Cu causes widening of Ti3Au thin film columns due to increased interdiffusion of Cu into the Ti3Au matrix, resulting in formation of Ti-Cu intermetallics or higher shift in angular position of the diffraction peaks (Fig. 3).
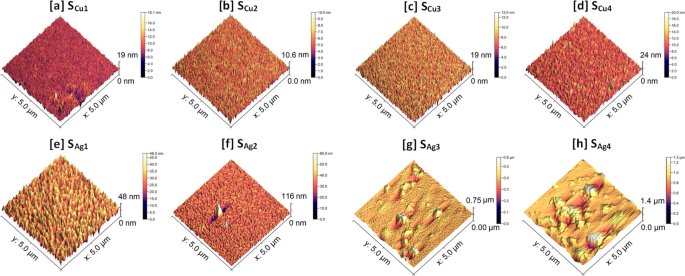
The surface profiles of the Cu doped Ti3Au thin films were scanned using an AFM to investigate their feature sizes and mean surface roughness, see Fig. 7a to d (AFM profile for standard Ti3Au thin film provided in Supplementary data 2 for comparison). Sample SCu1 registered a surface profile with feature sizes reaching up to 19 nm but this reduced to 10.6 nm with increasing Cu concentration in sample SCu2. These results are in good agreement with the circular grainy features visible on the surface of SCu1 (Fig. 4a) compared to the smoother cracked surface observed for SCu2 (Fig. 4b). Surface smoothening due to increased Cu concentration is also reflected in the measured surface roughness values, where SCu1 registers a value of 0.99 ± 0.1 nm and SCu2 has a reduced roughness of only 0.70 ± 0.01 nm. However, with further increase in Cu concertation, the maximum feature size grows again up to 19 nm for SCu3 and 24 nm for SCu4, with corresponding increases in surface roughness values to 1.09 ± 0.03 nm and 1.13 ± 0.05 nm, respectively. The elongation of grains for sample SCu4, seen previously in the SEM image (Fig. 4d) is also visible in the AFM scan. These surface AFM scans are very uniform with low surface roughness values and support the SEM observation that there is no precipitation of Cu particles or agglomerations on the film surfaces.
AFM scans of Ti3Au thin films doped with Ag are presented in Fig. 7e to h. When compared to the Cu doped films, addition of Ag leads to the formation of larger feature sizes on the film surface. Sample SAg1, with the lowest Ag concentration, registers feature sizes of 48 nm with a mean surface roughness of 4.4 ± 0.1 nm. However, with further addition of Ag in sample SAg2, the feature size increases abruptly to 116 nm, and can be correlated to the presence of a few large bright white coloured particles on the scanned surface, suggesting precipitation of Ag from the Ti3Au matrix is taking place. The measured surface roughness of sample SAg2 is 3.5 ± 0.35 nm, which is similar to that of SAg1. With further increase in Ag doping concentration, the feature sizes increase significantly to a maximum value of 0.75 μm due to the presence of large Ag particles and agglomerates on the film surface. And finally for sample SAg4, the maximum feature height extends up to 1.4 μm, while also growing in the radial direction and merging with neighbouring Ag granules to form larger particles. Samples SAg3 and SAg4 register mean surface roughness values of 16.1 ± 2.5 nm and 54.8 ± 14.3 nm, respectively. Thus, from the results in this section it can be concluded that agglomeration of Ag particles plays a significant role in moderating the crystal orientation, grain shape, cross sectional structure, density, and surface roughness of the Ti3Au thin films.
Mechanical characterisation
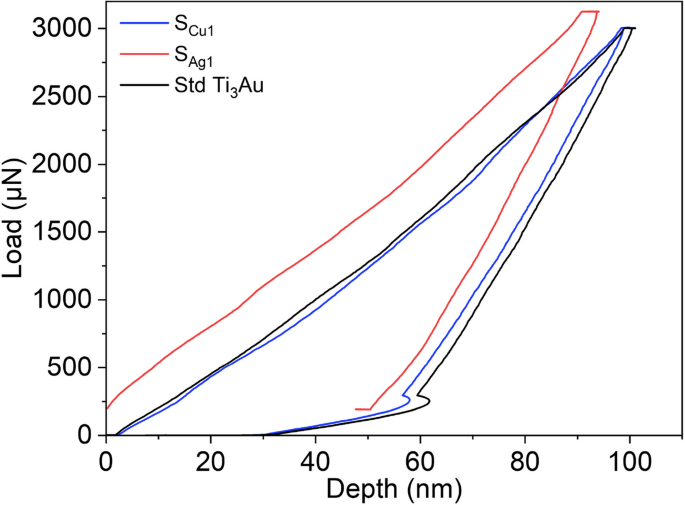
The load displacement (P–H) curve derived from a nanoindentation test gives information about the interaction of the diamond indenter tip with the thin film material beneath it and Fig. 8 compares the P–H curves generated by indenting the Ti3Au samples doped with the lowest concentration of Ag and Cu, against that of a standard Ti3Au thin film. The curves presented are all generated from indentations made at a constant peak load of 3000 μN and with load-dwell-unload time durations of 10 s each. Occurrence of displacement excursion more commonly known as “staircase phenomenon”, can be ruled out because of the absence of any sudden shift along the x-axis for any of the segments of the P–H curves [53, 54]. Displacement excursion take place when the indenter tip encounters any surface contaminants, phase difference or the presence of oxides with differing mechanical hardness, leading to unusual variation in displacement with increasing load [55]. The extensive substrate cleaning process used ensures removal of surface contaminants and in-situ processing avoids oxide formation at high temperature. XRD patterns (Fig. 3) only show the presence of single phase β-Ti3Au when the films are doped with Ag and very minute quantities of α-Ti3Au at higher Cu concentration of 4.2 at%. The presence of softer Ag agglomerations within the Ti3Au matrix, as seen in SEM images (Figs. 4 and 5), leads to a larger distribution in the mechanical hardness measurements (as explained below) but the P–H curve remains smooth and event free all throughout the nanoindentation cycle (Fig. 9) [56]. For the standard Ti3Au thin film (black line), the indenter tip travels to a depth in excess of 100 nm at the peak indentation load of 3000 μN and then elastically recovers to a calculated contact depth of 70.7 nm when the load is removed. Analysing the unloading curve segment according to the Oliver and Pharr method [57], gives a reduced elastic modulus value of 138.6 GPa and a mechanical hardness of 12.3 GPa. While for sample SCu1 (blue line) with a Cu dopant concentration of 0.5 at%, the indenter tip travels to a slightly reduced maximum depth of 96 nm at peak load and returns to a contact depth of 69 nm when the load is removed. This curve translates to a harder thin film with mechanical hardness of 12.7 GPa and elastic modulus of 143 GPa. Sample SAg1 (red line) doped with 0.2 at% of Ag offers the most resistance to tip penetration, only reaching a maximum depth of 91 nm and then elastically recovering to a contact depth of 66 nm. The elastic modulus and mechanical hardness calculated for this sample are 157 GPa and 14 GPa, respectively. The area enclosed by the load-unload hysteresis curve accounts for the work done by indenter tip to leave a plastic deformation on the film surface, whereas the hysteresis of the unloading curve is caused by the inherent elasticity of the thin film under test [58, 59]. To further understand the effect of Ag and Cu doping on the mechanical properties of the Ti3Au films, a set of 16 indentations, in 4 × 4 pattern was performed on each sample and the averaged results are discussed below.
Results for reduced elastic modulus results generated from nanoindentations performed on Ti3Au thin films doped with Ag and Cu on glass and Ti substrates are presented in Fig. 9a and b. The elastic modulus for the Ti3Au sample doped with the lowest Ag concentration (SAg1) on glass was 135 ± 6 GPa, which is very close to the value of 136.7 ± 3 GPa achieved for the standard Ti3Au thin film on glass. However, with further addition of Ag in the Ti3Au film, the value of elastic modulus follows a downward trend with values of 115 ± 7, 119 ± 14 and 82 ± 30 GPa for samples SAg2, SAg3 and SAg4, respectively. The error bar associated with sample SAg3 is almost double that of SAg2, while for SAg4, the corresponding variation in results is over four times that of the samples doped with lower Ag concentrations. This increase in error bar can be attributed to agglomeration of Ag at higher concentrations, forming a uniform distribution of large Ag particles across the sample surface. When the indenter tip contacts the Ti3Au film it records a higher elastic modulus but if the tip encounters a Ag particle on the surface the recorded elastic modulus is very low, thus leading to a wider variation in results for the 16 indentations in the 4 × 4 pattern. It has been proposed that the elastic moduli of an alloy changes in proportion to the number of solute atoms when the alloying element concentration is low [44,45,46]. The Young’s modulus of Ag is reported to be 73 GPa, which is much lower than that of Ti at 112 GPa [44, 60]. XRD patterns (Fig. 3) showed that the Ag doping concentration of 0 to 4.2 at% is lower than that required to form any Ti-Ag intermetallic compound and thus, Ag exists as a solid solute within the Ti3Au matrix, leading to a decrease in the elastic modulus of the Ti3Au-Ag compound with increasing Ag concentration in the thin film [44,45,46]. Ti3Au samples doped with Cu report elastic modulus values very close to the value observed for the standard Ti3Au thin films (Fig. 9b). The elastic modulus of Cu doped samples deposited on glass remain between 144 to 147 ± 8 GPa with a dip in the trend for sample SCu2, reporting a modulus value of 109 ± 6 GPa. A similar result is seen for Cu doped samples deposited on Ti substrates with elastic modulus values between 134 to 146 ± 3 GPa and a dip in the curve to 123 ± 3 GPa for sample SCu2. Cu is reported to have a Young’s modulus of 128 GPa, which is greater than that of Ti (112 GPa) and therefore a positive effect is expected with addition of Cu in the Ti3Au matrix [60]. Further, the precipitation of Ti-Cu intermetallic compounds at the lower Cu concentration of 7 at%, leads to stiffening of the Ti3Au thin film matrix with increasing Cu concentration [44, 46, 61]. The observed stabilization of elastic modulus values for Cu dopant concentrations above 2.8 at% can also be explained due to grain refinement and the constraining effect of neighbouring grains [62].
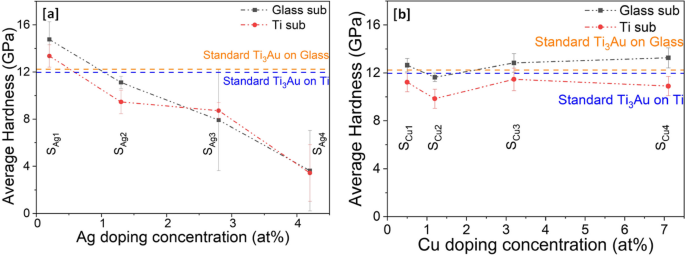
Results of mechanical hardness extracted from nanoindentations performed on Ag/Cu doped Ti3Au thin films on glass and Ti substrates are presented in Fig. 10a and b. It can be observed that hardness follows a very similar trend to that seen for elastic modulus in Fig. 9. For samples doped with Ag, the hardness values steadily decrease with increasing Ag content in film. Sample SAg1, doped with lowest Ag concertation of 0.2 at% reports excellent hardness values of 14.7 ± 1.4 and 13.3 ± 0.9 GPa on glass and Ti substrates, respectively, exceeding the values achieved for the standard Ti3Au thin films. With further addition of Ag in sample SAg2, the hardness values dip below that of the standard Ti3Au to 11.1 ± 0.5 and 9.9 ± 0.9 GPa on glass and Ti substrates, respectively. However, with higher Ag addition, for samples SAg3 and SAg4, the hardness values decrease even further with a large variation in the spread of results. This increase in error bar size could be assigned to severe agglomeration of Ag from the Ti3Au matrix, causing the nanoindenter tip to indent on both soft Ag and hard Ti3Au matrix regions of the films. It is therefore safe to say that only the Ag dopant concentration of 0.2 at% (SAg1) is useful to extend the mechanical hardness of the standard Ti3Au thin film coating. On the other hand, the Cu doped Ti3Ag thin films maintain a better hardness profile throughout the entire doping concentration range of 0.5–7.1 at%. Samples SCu1, SCu3 and SCu4 deposited on glass substrates present similar hardness values of 12.6 ± 0.5, 12.8 ± 0.7 and 13.2 ± 0.8 GPa, respectively, which are all slightly higher than the standard Ti3Au thin film result. While sample SCu2 presents a slightly lower mechanical hardness of 11.6 ± 0.3 GPa. The Cu doped samples deposited on Ti substrates present hardness values of between 9.8 to 11.4 ± 0.9 GPa, which are all slightly lower than the standard Ti3Au thin film result.
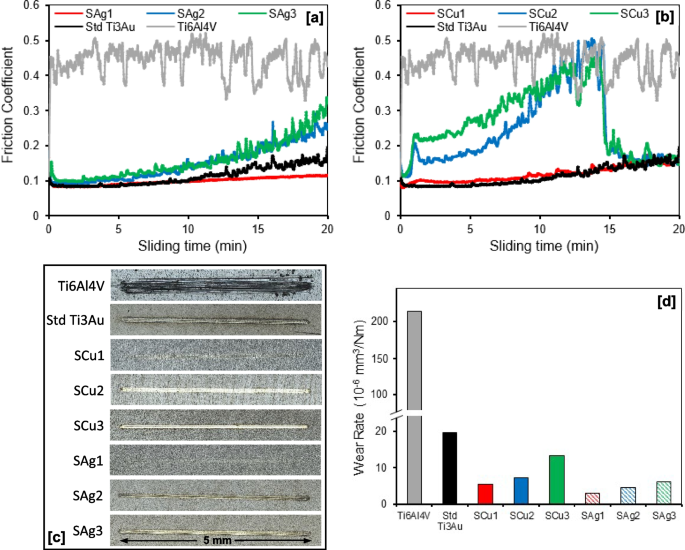
Results for wear testing of the Ag and Cu doped Ti3Au thin films and Ti6Al4V alloy substrate are presented in Fig. 11, including their friction coefficients, wear track surface morphologies and specific wear rates when sliding against stainless steel balls at an applied normal load of 1.52 N in SBF solution. As shown in Fig. 11a, the friction coefficient of the Ti6Al4V substrate fluctuates around 0.4 to 0.5 throughout the 20 min of sliding time, whereas the standard Ti3Au thin film shows a significant reduction in value to ~ 0.1 for the first 10 min and gradually increases toward 0.2 in the second half of the test. Addition of a small quantity of Ag gives a further reduction in friction coefficient for sample SAg1 to a consistent value of ~ 0.1 throughout the duration of the test, whereas further increments of Ag in samples SAg2 and SAg3 lead to increases in friction coefficient to final values around 0.25 and 0.3, respectively. A similar trend was observed for the Cu doped Ti3Au thin films (Fig. 11b), where addition of a small quantity of Cu in sample SCu1 had minimal effect on the friction coefficient of the Ti3Au thin film, with a value < 0.2 throughout the full test duration. However, with further increments of Cu in samples SCu2 and SCu3, there was a noticeable change in the thin film behaviour, with a gradual increase in friction coefficients towards 0.5 in the first 15 min and then a sudden drop to < 0.2 for the final 5 min of the test. It is possible that in the first part of the tests the excess of doping material tends to create a third body that increases friction coefficient and wearing until the creation of a tribo-film that protects the surface by lowering the friction coefficient and the local roughness. This behaviour is commonly observed in thin film coatings doped with softer materials like Ag and Cu, which is normally caused by formation of a thin self-lubricating film on the coating surface. This reduces the adhesive trend between counterpart materials which in turn lowers the frictional coefficient and improves the wear performance [63,64,65].
a and b Friction coefficient curves; c Wear track surface morphologies; and d Specific wear rates, for Ti3Au thin films deposited on Ti6Al4V substrates with varying Ag/Cu dopant concentration, when sliding against 6 mm diameter stainless steel balls at applied normal loads of 1.52 N in SBF solution at room temperature
In general, the reduction in friction coefficient of the Ag and Cu doped Ti3Au thin films compared to the Ti6Al4V substrate is associated with a decrease in real contact area and surface plastic removal due to their significantly higher surface hardness [66]. This result is reflected in the wear track surface images (Fig. 11c) and corresponding wear rate values (Fig. 11d), where the Ti6Al4V substrate has a much wider wear groove (~ 300 µm) than all the thin film samples and a significantly higher wear rate of 214.81 × 10⁻⁶ mm3/Nm. In comparison, the wear groove widths for the thin film samples are all < 100 µm and their corresponding wear rates are all < 20 × 10–6 mm3/Nm, which is less than 20 times lower than that of the Ti6Al4V substrate. As shown in Fig. 11d, addition of small quantities of Ag or Cu further reduces the wear rate of the standard Ti3Au thin film from 19.62 × 10⁻⁶ mm3/Nm to values of 3.03 × 10⁻⁶ and 5.50 × 10⁻⁶ mm3/Nm for samples SAg1 and SCu1, respectively. However, the wear rate increases with further additions of Ag and Cu in the Ti3Au thin film matrix, reaching values of 6.11 × 10⁻⁶ and 13.36 × 10⁻⁶ mm3/Nm for samples SAg3 and SCu3, respectively. This reduction in wear rate with addition of small quantities of soft elements like Ag or Cu can be related to trade-off between an increase in lubrication and a decrease in surface hardness [67]. Overall, results from this section suggest that addition of small quantities of antimicrobial elements like Ag and Cu can improve the mechanical performance of Ti3Au intermetallic thin films.
Electrochemical corrosion tests
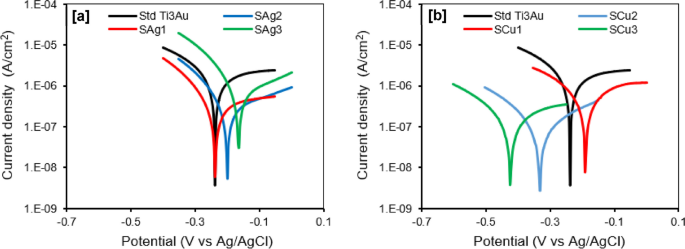
An understanding of the surface coatings corrosion resistance is essential to evaluate its service life when applied to biomedical implants in the living tissue environment. Potentiodynamic polarization curves and corresponding corrosion parameters of the Ag and Cu doped Ti3Au thin films immersed in SBF at 37 °C are presented in Fig. 12 and Table 3, respectively. The corrosion resistance of the thin film samples can be examined on the basis of four evaluation criteria: (i) a more electropositive corrosion potential (Ecorr); (ii) a lower corrosion current density (icorr); (iii) a higher polarization resistance (Rp); and (iv) a higher protection efficiency (Pe) are indicative of an improved corrosion resistance [68]. As shown in Fig. 12a, the polarization curves of the three Ag doped Ti3Au thin films exhibit similar shapes and there is a shift towards more positive potential and a corresponding increase in current density with increasing Ag concentration in the films from SAg1 to SAg3. Conversely for the Cu doped Ti3Au thin films (Fig. 12b), the trend is opposite, with a shift towards more negative potential and a decrease in current density with increasing Cu concentration in the films from SCu1 to SCu3. As shown in Table 3, the values of current density (icorr) for Ag and Cu doped films are in the range ~ 0.1 to 0.7 µA/cm2, which is at least one order of magnitude lower than the value of ~ 1.7 µA/cm2 recoded for the standard Ti3Au thin film. For the Cu doped Ti3Au films, samples SCu2 and SCu3 exhibit the lowest values of icorr of 0.107 and 0.175 µA/cm2, respectively. Whereas, for Ag doped Ti3Au films, samples SAg1 and SAg2 have the lowest values of 0.355 and 0.321 µA/cm2, respectively. This trend is also evident in the results for Rp and Pe shown in Table 3, where samples SAg1, SAg2, SCu2 and SCu3 all give higher values of polarization resistance and protection efficiencies of ~ 79 to 93% when compared to the standard Ti3Au thin film.
These results are also supported by the EIS analysis shown in Fig. 13. For the Nyquist plots (Fig. 13a and c), a convenient and scientifically proven way to explain the electrochemical corrosion resistance of the thin film samples is to examine the diameters of the capacitive loops (semicircles), where a larger diameter signifies higher corrosion resistance [69] As can be seen, all samples exhibit a single capacitive loop, indicating a typical capacitive response of the passive thin films [70]. The diameters of the semicircles for the Ag and Cu doped films are larger than that for the standard Ti3Au thin film and increase with decreasing Ag (SAg3 to SAg1) and increasing Cu (SCu1 to SCu3) content in the film, denoting an improvement in corrosion stability, which is accordant with the potentiodynamic polarization results in Table 3. The Bode plots for the Ag and Cu doped films (Fig. 13b and d), also corroborate this finding. In the high frequency region, the impedance |Z| of all samples is low and independent of frequency value, and the phase angle is close to zero, indicating that impedance is dominated by the resistance of the SBF in this frequency range [70]. In the low and medium frequency region, the impedance |Z| of the samples increases linearly with decreasing frequency, with a slope of ~ -1, and the phase angle plateaus with a maximum value around -80°, which is a typical response of capacitive behaviour [71]. There is a notable decrease in the phase angle value and plateau width for samples SAg2 and SAg3 (Fig. 13b) in the midband frequency range, which could indicate a reduction in their electrochemical stability [66]. However, at low frequencies, the higher values of impedance |Z| for samples SAg1, SAg2 (Fig. 13b), and SCu2, SCu3 (Fig. 13d) suggest an improvement in electrochemical stability when compared to the standard Ti3Au thin film [72], and further support the results from the potentiodynamic polarization and Nyquist plots. Therefore, overall, the electrochemical corrosion tests have shown that small additions of Ag and Cu can improve the corrosion resistance of Ti3Au thin films in SBF solution at 37 °C and that the best performing films are SAg1, SAg2, SCu2 and SCu3.
Biocompatibility-cytotoxicity of films on L292 cells
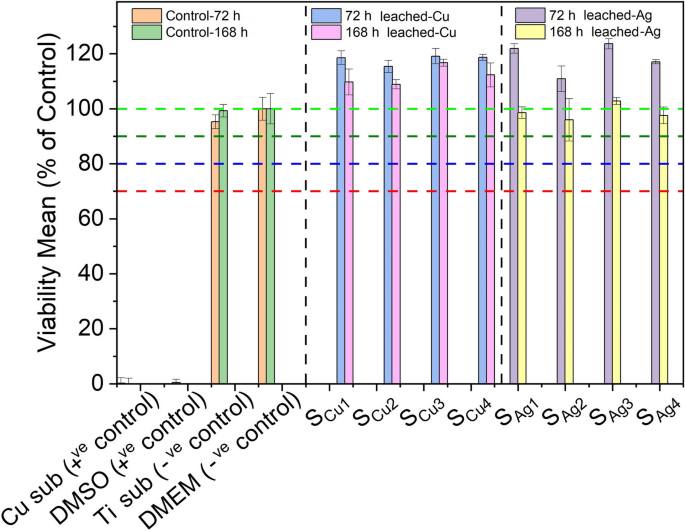
Determination of the potential cytotoxic effect of various thin film extracts against our in vitro biological system of L929 cells was performed through the Alamar blue assay. Initially, two sets of extracts were prepared from each tested sample, through their immersion into 6-well culture plates containing DMEM media for 72 h and 168 h (details described in Sect. 2.4). Next, extracts obtained from each of the above sets were used in order to investigate their cytotoxic properties against L929 cells, following 72 h of exposures. Interestingly, in order to observe the maximum effect of derived extracts of all tested samples in terms of cytotoxicity against L929 cells, undiluted DMEM anion-leached media was used in this series of experiments. Specifically, cells were exposed to four different extracts of both Cu (SCu1, SCu2, SCu3, SCu4) and Ag (SAg1, SAg2, SAg3, SAg4) doped Ti3Au thin films. In addition, extracts prepared from a blank Cu substrate of similar size and under similar conditions, as well as 10% of Dimethyl Sulfoxide (DMSO), were used as positive controls, whereas DMEM (Blank) growth medium along with a blank Ti substrate were used as a negative controls, against L929 mouse fibroblasts.
Results following the Alamar blue cytotoxicity assay are presented as bar charts in Fig. 14. Data analysis indicated that both Cu substrate extracts and 10% of DMSO solution exhibited considerable cytotoxic activity, as levels of viable cells were dramatically reduced, opposed to the effect of DMEM (blank sample) and Ti substrate extracts. Specifically, as expected, viability levels of DMEM-treated cells remained unaffected, a pattern also observed in exposures with Ti derived extracts, with viability levels reaching values between 95–100%, even after exposures with extracts of prolonged (168 h) leaching period. Accordingly, all tested Ti3Au thin films doped with Cu performed notable biocompatibility rates as were shown to further increase/stimulate L929 viability levels (above 100%) following incubations with leached extracts obtained following 72 h of extraction. Moreover, although levels of viable cells were slightly reduced in exposures with 168 h leached extracts (compared to those of 72 h), were still above 100%, indicating a safe cytotoxic profile. Such slight decline of cell viability rates could be attributed to the increased concentration/release of metal ions in extracts obtained following prolonged leaching duration. In parallel, a similar safe cytotoxic profile was observed when L929 fibroblasts were exposed to all tested Ti3Au thin film samples doped with Ag, as once again were capable of stimulating cell proliferation reaching levels above 100% in exposures with 72 h leached samples. Also in this case, although exposures with prolonged (168 h) leaching period derived extracts caused a minor decrease of viability levels, they were still above 90%, suggesting a non-cytotoxic effect and high biocompatible properties.
Cytotoxic effect of Ti3Au thin films extracts from samples deposited on Ti substrates with varying Cu and Ag doping concentrations, against L929 mouse fibroblast cells, following 72 h of exposure with 72 h and 168 h leached extracts, compared to negative controls (untreated [BLANK] and Ti substrate) and positive controls (Cu substrate and 10% DMSO)
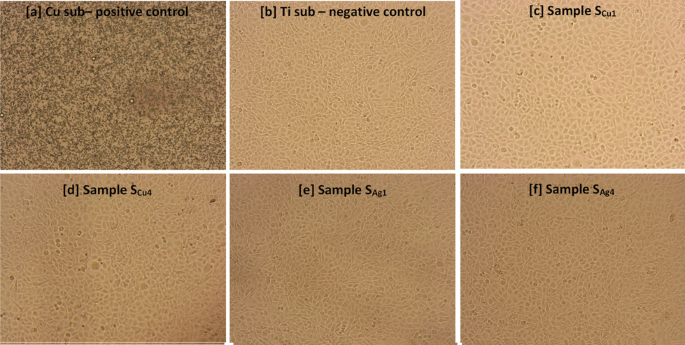
The above results are further supported by microscopic observation of L929 mouse fibroblast cell’s morphology, following exposures to the sample surfaces for a total of 168 h (Fig. 15). In particular, it can be clearly seen that exposure to the Cu substrate was associated with high rates of cytotoxicity, leading to significant cell shrinkage and death of L929 mouse fibroblast cells, ultimately resulting in confluency reduction (Fig. 15a). On the contrary, cell morphology as well as confluency of L929 cells exposed to Ti (Fig. 15b) and Ag/Cu doped Ti3Au thin film extracts (Fig. 15c-f) remained unaffected, indicating a safe cytotoxic profile.
Morphological changes of L929 mouse fibroblast cells following 72 h of incubation with a Cu substrate (positive control), b Ti substrate (negative control) c SCu1, d SCu4, e SAg1 and f SAg4 Ti3Au thin film extracts, obtained after 168 h of ion leaching. Images acquired using an inverted Kern microscope with attached digital camera and 10X lens
The leached ion concentration measured by performing ICPOEMS analysis on 72 and 168 h leached sample extracts helps to better understand the biocompatible nature of the Ag/Cu doped Ti3Au thin films. For the Cu doped samples, no ions could be detected after 72 h of leaching, other than Au ions, which were less than 0.10 ppm. However, when the extraction duration is extended to 168 h, the Cu doped samples begin to show presence of other ion species: Ti ion concentration increases to 0.01–0.02 ppm, whereas Al becomes the dominant species with an ion concentration of 0.17–0.20 ppm. Samples Scu1 and Scu2 report Cu ion concentrations of 0.07 ppm, which increases to 0.08 ppm for the Cu rich samples Scu3 and Scu4. On the other hand, Ag doped samples begin to show presence of antimicrobial Ag ions between 0.14–0.15 ppm, even after 72 h of extraction time. There is a further increase of 0.03–0.05 ppm in Ag ion concentration after 168 h of extraction, taking the total leached Ag ion concentration to between 0.17–0.20 ppm. Al ions are another prevalent species in the Ag doped samples, with observed ion concentrations of 0.16–0.19 ppm. Leached ion concentrations of Ti and Au never exceed 0.07 ppm in the Ag doped samples, even after 168 h of extraction, bearing a close resemblance to the Cu doped samples. Various studies have proven that only Ag and Cu ion concentrations exceeding 1 ppm can affect the cell viability of L929 mouse fibroblast cells [73,74,75], which is in good agreement with the results presented for the Ag/Cu doped Ti3Au thin films in this work.
The effect of direct exposure of Ag and Cu doped Ti3Au thin film surfaces on the cell morphology (actin filaments and nuclear DNA) of L929 mouse fibroblasts was observed through fluorescence microscopy using Phalloidin and DAPI staining, which stains actin filaments and nucleus, respectively and the images are presented in Fig. 16 a-c. Along with the thin film test samples, the mouse fibroblast cells were directly incubated with Cu and Ti substrates, used as positive and negative controls, respectively. Further, the exposures to 10% DMSO and DMEM (control) culture media were used as absolute positive and negative cytotoxic controls. Our immunofluorescence results revealed that both actin filaments and nucleus of mouse fibroblasts were not altered following Cu and Ag doped Ti3Au thin films exposures (Fig 16b and c), as they appeared intact well-defined and stained, indicating healthy L929 cells, further supporting the biocompatible profile of all tested thin films. This pattern was comparable to that of both DMEM (control) and Ti substrate treated cells (Fig. 16a) showing a normal nucleus staining and well-defined actin filament regions. On the contrary, Cu and 10% DMSO exposures caused significant changes in L929 cells’ morphology, observed as a loss of membrane integrity and an abnormal cell shape and actin filaments staining, indicating a significant cytotoxic effect. Overall, these results clearly show that the Ti3Au based coatings can maintain a positive environment for growth and proliferation of cells in biological medium.
Immunofluorescence images showing the effect of direct exposure to a Control samples b Cu doped and c Ag doped Ti3Au thin films on L929 cells’ morphology and actin cytoskeleton. For each sample following exposures, L929 cells were fixed and stained with anti-Phalloidin (middle panel) and counterstained for DNA with DAPI (left panel). Green and blue colour represents staining for Phalloidin and DAPI, respectively, while merged images for Phalloidin/DAPI staining are also shown (right panel). Scale: 20 μm
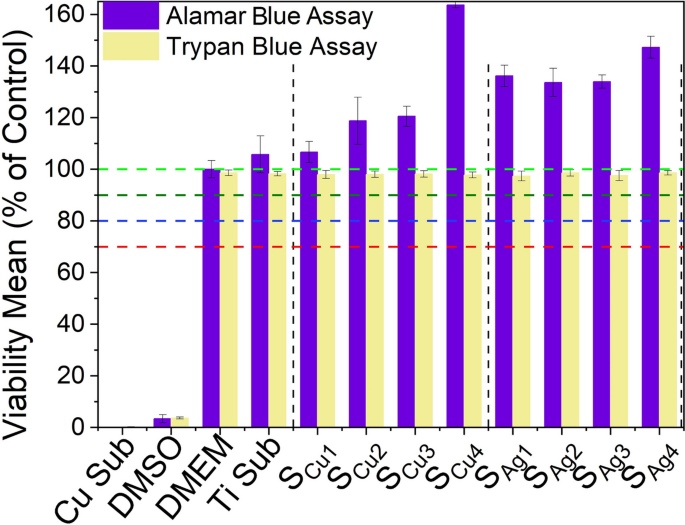
The results of cell viability analysis using the Trypan blue exclusion assay are presented in Fig. 17 and show the cell viability levels of L929 mouse fibroblast cells after direct exposure to Ag/Cu dopedTi3Au thin film surfaces, measured on the same day as the immunofluorescence analysis for a direct correlation. The results show that the exposures of L929 cells to various Ag and Cu doped thin films does not alter their viability levels, as they are comparable to those of untreated (DMEM/blank) samples. On the other hand, the Cu substrate and 10% of DMSO caused a dramatic reduction in viability of these cells, exhibiting a strong cytotoxic activity. This result is in very good agreement with extract exposure method (Fig. 14) and shows that L929 mouse fibroblast cells remain viable not only in the biological medium containing leached extracts from Ag/Cu doped Ti3Au thin film coatings, but also maintain an excellent viability performance when exposed directly on the surface of these thin film coatings.
Cytotoxic effect of Ti3Au thin films deposited on Ti substrates with varying Cu and Ag doping concentrations, against L929 mouse fibroblast cells, following 72 h of direct exposure to the sample surface, compared to negative controls (untreated [BLANK] and Ti substrate) and positive controls (Cu substrate and 10% DMSO), determined by Trypan blue exclusion staining and Alamar blue assay
Furthermore, in order to make a direct comparison with the extract exposure method (Fig 14), viability levels of L929 cells directly exposed to Ag and Cu doped Ti3Au thin film surfaces were also studied the next day using the Alamar blue assay as previously described in section 2.4.2, see Figure 17. Results show that both Ag and Cu doped Ti3Au thin film coatings present a very safe cytotoxic profile against L929 cells, with very high viability levels. This indicates that Ti3Au based thin films possess biocompatibility properties in direct and indirect extract exposure routes, which is a highly suitable trait for coating of artificial joint implants. The L929 cells treated to bare Ti alloy substrate experienced a similar cytotoxicity profile as Ag/Cu doped Ti3Au coatings, although to a lesser extent when compared to doped samples, but still above 100%. In contrast, treatment with 10% DMSO resulted in a very strong cytotoxic activity, dramatically decreasing viability levels of exposed L929 cells.
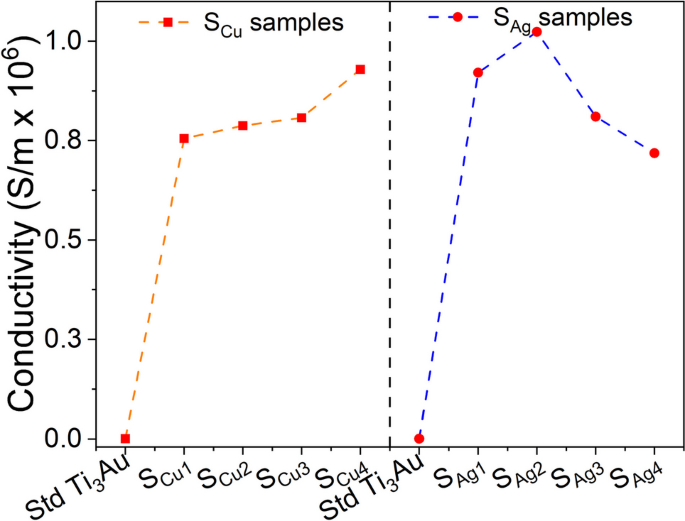
Several studies have shown that electrical conductivity of the substrates within a biological system can enhance bioactivity and promote cell response in terms of proliferation and differentiation [76,77,78,79]. It has been proposed that electrically conductive medium could encourage electrical communication between myoblasts stimulating increased myogenic differentiations [80]. The results of electrical conductivity for Ag and Cu doped Ti3Au thin films measured by a 4-point probe surface measurement system are presented in Fig. 18. For comparison a standard Cu substrate and a 250 nm thick Ag film were also measured with electrical conductivities of 1.84 × 10⁵ and 1.44 × 10⁸ S/m, respectively.
The electrical conductivity of the standard Ti3Au thin film is relatively low, having a value of 7.6 × 10² S/m. However, when these samples are doped with Ag or Cu the electrical conductivity increases and is expected because of the high conductivity of Ag and Cu compared to Ti [81,82,83]. Correlating this result with the theory that electrical conductivity aids cellular proliferation and differentiation, the higher conductivity for Ag/Cu doped samples compared to the standard Ti3Au thin film could explain the slight improvement in cell viability performance observed by these samples. The conductivity of Cu doped samples increases at a steady rate with increase in Cu concentration from 0.75 × 10⁶ to 0.92 × 10⁶ S/m. On the other hand, for Ag doped samples, the electrical conductivity initially increases from 0.92 × 10⁶ to 1.02 × 10⁶ with increase in Ag concentration (SAg1 < SAg2) but thereafter falls steadily to 0.81 × 10⁶ and 0.71 × 10⁶ with further increase in Ag content (SAg2 > SAg3 > SAg4). Higher electrical conductivity at lower Ag concentration could be associated to the presence of smaller conductive Ag particles spread more uniformly throughout the Ti3Au matrix, as seen in the SEM images for samples SAg1 and SAg2. But as the concentration of Ag grows within the film, Ag particles begin to agglomerate into fewer large island like structures with increased spacing, thereby reducing the electrical conductivity [84,85,86]. Therefore, by correlating the ICPOEMS and surface conductivity results to the excellent cell viability reported for the Ag/Cu doped samples (> 100%), it can be argued that leached Ag/Cu ion concentrations of 0.07 to 0.20 ppm are not enough to cause any significant cytotoxic effect, however, increases in electrical conductivity caused by addition of these elements could be favourable to stimulate myogenic differentiations.
Antimicrobial results
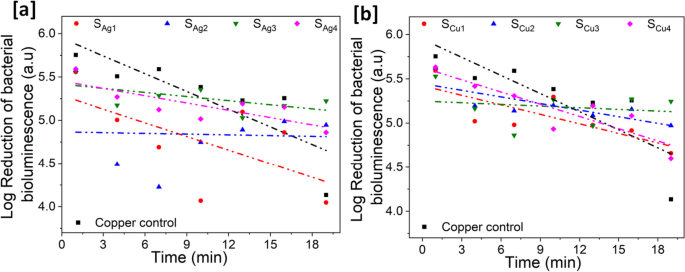
We used the bioluminescence output of E. coli pQE-ilux as an index of death. Our in vitro experiments have shown that the loss of bioluminescence correlates very well with bacterial death when challenged with copper ions (data not shown). We consider the assay superior to traditional recovery assays as these equate a reduction in recovery of live cells with death but do not account for recovery artefact relating to differential surface adhesion by the bacteria. Logarithmic reduction in the number of live E. coli bacteria emitting bioluminescence after exposure to the sample surfaces was measured in a dark box and used as a reference to indicate the antimicrobial property of the Ag and Cu doped Ti3Au thin films, see Fig. 19.
Each data point represents the logarithmic value of averaged bioluminescence intensity emitted by the microbial cells when deposited on the surface of the Ag/Cu doped Ti3Au thin films. The spread of data points is fitted using a linear fit of y = mx + c, where x and c represent the slope and y-axis intercept of the line respectively, while the R2 value is presented to indicate the quality of data fit. The negative and steeper slope indicates a steeper reduction in the number of E. coli colonies and the higher R2 value indicates the consistency of this trend across the exposure period. The table for individual slope and R2 value for these samples are presented in the Supplementary data 3. The results are compared against a Cu substrate, a known antimicrobial agent and this control sample exhibits a strong antimicrobial property with a 1.6 log reduction in bioluminescence intensity over the test period. For Ag doped Ti3Au thin films, sample SAg1 shows the best antimicrobial property, similar to Cu substrate with a 1.6 log reduction over the test duration. The reduction in this sample is steep in the initial 10 min before settling down in the second half of the test period. With further increase in the Ag concentration, the antimicrobial performance diminishes to < 0.8 log reductions for samples SAg2, SAg3 and SAg4 respectively. For the Cu doped samples, sample SCu4 and SCu1 provide the strongest antimicrobial performance of > 1 log reductions, with both samples showing a steady reduction in bacterial bioluminescence. While samples SCu2 and SCu3 only achieve a < 0.5 log reduction over the test period.








Add Comment