
Due to the high efficiency and low price of MG, it is utilized in different industrial sectors. However, excessive accumulation of MG causes severe toxicity to environment and human health. MG degradation using different chemical and physical treatments have several limitations involving the resultant toxic products, slow, and high cost [20]. Therefore, an alternative treatment by using microbial degradation has currently attracted attention due to its low cost, green, and fast approach [5].
Effect of growth media on the MG degradation
As shown in Fig. 2, the maximum MG decolorization by Pseudomonas plecoglossicide MG2 was achieved with MSB and this result is nearly close to that obtained with NB (near to 90% decolorization after 96 h incubation), while MS medium showed about 59% decolorization after the same incubation period. Therefore, MSB was selected for further optimization of decolorization activity by Pseudomonas plecoglossicide MG2. MSB and NB media contain peptone in their contents. Peptone is a mixture of water soluble compounds resulting from the enzymatic or acid hydrolysis of proteinaceous substances. It provides the culture medium with amino acids, peptides and carbohydrates that are necessary for microbial growth and enzyme production [27].

Effect of different culture media on MG degradation efficiency by Pseudomonas plecoglossicide MG2
There are many reports about MG decoloration and degradation by bacteria. Abu-Hussien et al. [3] reported that Streptomyces exfoliates, Tenacibaculum spp. HMG1, Pseudomonas spp. YB2, strain S20 and Enterococcus sp. could efficiently decolorize 96% of 100 mg/l MG after 120 h, 98.8% of 20 mg/l MG in 12 h, 100% of 1000 mg/l MG in 12 h, 98% of 300 mg/l MG after 96 h, and 94% of 20 mg/l MG, respectively. While Bacillus cereus and Pseudomonas aeruginosa showed 16% and 19% MG decolorization, respectively [3].
Song et al. [42] isolated Pseudomonas veronii and it exhibited 93.5% degradatoion of 50 mg/l MG. Also, He et al. [18] isolated a Pseudomonas sp. strain and it showed about 80% MG degradation (50 mg/l) in 14 h. All these experiments were performed in microbial growth medium, however, the same degradation potentials of tested microorganisms could not be achieved in the natural or simulated environment.
In the present study, the MG in simulated wastewater bioreactors was efficiently degraded by Pseudomonas plecoglossicide MG2 and the degradation products showed no cytotoxicity as will be mentioned later.
Optimization of MG degradation by Pseudomonas plecoglossicide MG2
Effect of several parameters that can contribute to MG decolorization efficiency by Pseudomonas plecoglossicide MG2 such as pH, temperature, inoculum size, aeration, medium volume and different MG concentrations were evaluated during the incubation period of 24–144 h.
Effect of pH
The dye degradation at higher pH values is important especially for industrial effluent bioremediation, which is carried out under basic conditions. Usually, the pH level had a significant effect on the dye degradation, since the optimum pH for the maximum decolorization of dyes is between 6 and 10 [21]. In the present study, Fig. 3 shows the maximum decolorization activity was noted at pH 6–7 with the maximum decolorization at pH 7 (92.5% degradation after 96 h). In contrast, at pH 4 the decolorization efficiency was sharply decreased. However, at pH 5 and pH 8 a valuable MG degradation was obtained (61%, and 74.5%, respectively after 96 h).

Effect of pH on the MG degradation efficiency by Pseudomonas plecoglossicide MG2
Similarly, Vijayalakshmidevi and Muthukumar [45] reported that the maximum MG decolorization using Ochrobactrum sp JN214485 was at pH 6. Also, Du et al. [13] found that Pseudomonas sp. strain DY1 efficiently decolorized MG at pH 6.6. In the study of Song et al. [42], they found that the highest MG decolorization by Pseudomonas veronii JW3-6 was at pH 5–7 with the maximum activity at pH 7. In accordance with these results, the highest MG decolorization by Stenotrophomonas maltophilia was at pH 6–7 [5]. Tao et al. [43] reported that the MG decolorization was not pH dependent and complete decolorization was obtained across a wide pH range from 5 to 9 by Pseudomonas sp. YB2.
The degradation efficiency at pH 4 and 9 was proved to be not significant, which reflects the unfavorable highly acidic and alkaline conditions for the microbial growth. Also, it is known that the pH value of the medium dominates the transport of dye molecules across the cell membrane, which is considered the rate limiting step in decolorization process [23].
Effect of temperature
The incubation temperature affects both microbial growth and enzyme activities, and thus affects the rate of dye decolorization [23].
MG degradation efficiency by Pseudomonas plecoglossicide MG2 was investigated under different temperatures as shown in Fig. 4. The results demonstrated that the maximum decolorization activity was found between 30 and 35 °C with maximum decolorization at 35 °C (91.5% after 96 h). A valuable decolorization percent was obtained at 40 °C. Meanwhile, lower decolorization activity was observed at 45 °C (56%). The decline decolorization activity at higher temperatures can be attributed to the loss of cell viability, decreased rates of enzymes production or the denaturation of enzymes that are responsible for MG decolorization [21, 23]. MG was efficiently decolorized (90–97%) at 28–30 °C using Pseudomonas sp. strain DY1 as reported by Du et al. [13]. It was reported that MG decolorization by Pseudomonas veronii JW3-6 was more active (92.9%) at 30 °C and subsequently reduced to 70.1% at 40 °C [42]. Alaya et al. [5] concluded that the temperature range 25–30 °C was suitable for MG decolorization by Stenotrophomonas maltophilia as compared to temperatures higher than 35 °C. In addition, the maximum rate of MG decolorization is generally observed related to the optimum cell growth of Pseudomonas sp. YB2 [43] and Ochrobactrum sp JN214485 [45] at 30 °C.

Effect of temperature on MG degradation by Pseudomonas plecoglossicide MG2
Effect of inoculum size
The inoculum concentration of pseudomonas plecoglossicide MG2 directly affects the MG decolorization. As shown in Fig. 5, at 24 h incubation, the best inoculum size is 8% (34% MG degradation). At 48–72 incubation, the increase in inoculum concentration from 2 to 6% lead to a gradual increase in MG decolorization with the maximum degradation at 6% inoculum size (84%). At 96–144 h incubation, the MG decolorization efficiency was the same using inoculum size 4 and 6% (about 90%). It was noted that higher inoculum size than 6% resulted in lower MG decolorization activity at 48–144 h incubation (degradation reduction about 41–80%). This could be related to the restraint of bacterial metabolic activities at a higher density of cells due to nutrient limitations and lower O2 transfer [1]. At lower inoculum size (2%), MG decolorization decreased and this may be related to longer time for cells to multiply and lowering the enzyme production. In this way, Kabeer et al. [20] reported that Bacillus vietnamensis sp. MSB17 could effectively decolorize MG using 4% inoculum size. More than this inoculum size lead to constant reduction of MG degradation.

Effect of inoculum size on MG degradation efficiency by Pseudomonas plecoglossicide MG2
Effect of aeration
Under aerobic conditions, oxygen transfer in the culture medium plays an important role in each of the cell growth and product formation. As illustrated in Fig. 6, the MG decolorization gradually increased with increasing the aeration levels from 65 to 80%. The maximum MG decolorization by Pseudomonas plecoglossicide MG2 was obtained at the highest aeration ratio (80–90%) at 96 h and a longer incubation period. The observed decrease of MG decolorization at lower aeration ratios is due to oxygen transfer limitations, leading to a decrease in the enzymatic production by Pseudomonas plecoglossicide MG2. Tao et al. [43] reported that Pseudomonas sp. YB2 efficiently decolorized MG at high aeration ratio in 250 ml Erlenmeyer flask; however the growth decreased when the solution volume increased in the flasks (low aeration ratio) and subsequently the MG decolorization activity decreased.

Effect of aeration on the degradation efficiency of Pseudomonas plecoglossicide MG2
In the present study, the effect of static and shaking conditions were also studied and the results are illustrated in Fig. 7. The decolorization of 50 mg/l of MG was obtained after 72 h with degradation percent of 94% under static condition whereas it was 65% after the same period under shaking condition. Increasing the incubation period to 96 h under shaking condition resulted in the maximum MG decolorization (92%).

Effect of shaking and static conditions on MG degradation efficiency of Pseudomonas plecoglossicide MG2
In a previous study, Pseudomonas plecoglossicide MG2 proved the production of multi-oxidative-reductive enzymes such as laccase, lignin peroxidase, manganese peroxidase, tyrosinase, triphenylmethane reductase, anthraquinone reductase and azoreductase. Some of these enzymes switched on under aerobic conditions and others switched on under static conditions. Therefore, this organism can decolorize MG under shaking and static conditions.
Khan et al. [21] reported that the MG decolorization was observed significantly under static condition which could be attributed to the higher activity of reductive enzymes. Moreover, a sufficient amount of oxygen is also required for the activity of oxidative enzymes that are available under the static conditions. However, the slow decolorization reaction under shaking conditions was due to high oxygen amount that inhibited the reductive enzymes [11]. It was suggested that, MG decolorization under static conditions by microorganisms is related to the availability of reduced electron carriers such as NADH to reduce MG. Interestingly, most of MG decolorization strains demonstrated high efficiency under static or anaerobic condition as reported by Parshetti et al. [37] and Chaturvedi and Verma [9]. Pseudomonas plecoglossicide MG2 had also higher MG degradation efficiency under shaking conditions, which could support its practical application due to its ease of operation [43]. Alaya et al. [5] reported that the decolorization of MG was stimulated by incubation of Stenotrophomonas maltophilia under shaking conditions with increasing the oxygen levels in the liquid medium.
Effect of initial dye concentration
Degradation of MG was performed with different initial concentrations (25–200 mg/l). As shown in Fig. 8, Pseudomonas plecoglossicide MG2 showed high efficiency in MG degradation at MG concentrations of 25–100 mg/l with nearly complete degradation after 96 h for 25–50 mg/l MG (94.7%) and 120 h for 100 mg/l MG (81.5%). Meanwhile, at 200 mg/l MG, the degradation percent decreased to about 18.9% even after 144 h incubation. Moreover, the bacterial density in the culture medium was remarkably decreased and the degradation efficiency was reduced to about 8% at 400 mg/l MG after incubation for 144 h (data not shown). With a further increase in MG concentration greater than 400 mg/l, the decolorization was negligible, indicating the inhibition effect of high MG concentration on the growth and activity of the tested organism.

Effect of initial MG concentration on its degradation efficiency by Pseudomonas plecoglossicide MG2
Tony et al. [44] suggested that the decolorization rate decreased gradually as dye concentration increased. This reduction might be related to the toxic effect of dye on bacterial cells or the incorrect binding of the dye molecules with the enzyme active sites. In accordance with these results, MG at higher concentrations could inhibit the growth of Kocuriarosea MTCC 1532 [37], Pseudomona veronii JW3-6 [42] and Bacillus vietnamensis MSB17 [20].
Bioreactor
The results depicted in Figs. 9, 10, 11 showed the performance of AS, TC-AS and TC bioreactors at different concentrations of malachite green (50, 100 and 150 mg/l).

Variation of different pollution parameters at 50 mg/l MG for the different bioreactors. A, B and C are, activated sludge, tested culture-activated sluge, tested culture bioreactors, respectively

Heatmap showing the performance of different bioreactors at 100 mg/l MG. A, B and C are activated sludge, tested culture-activated sluge, tested culture bioreactors, respectively

Area plot showing the performance of different bioreactors at 150 mg/l of MG. A, B and C are activated sludge, tested culture-activated sluge, tested culture bioreactors, respectively
Effect of simulated wastewater pH on MG decolorization
The pH of wastewater plays an important role in dye decolorization. It was reported that bacterial strains have a favorable pH 7–8 for decolorization [34].
The effect of AS on MG decolorization at different dye concentrations was achieved at an optimal pH varied from 7.3 to 7.6 at 50 mg/l MG, 8–8.3 at 100 mg/l and 7.2 − 7.8 at 150 mg/l. The results showed that high decolorization for AS was achieved at 100 mg MG/l with an average percentage removal of 98.3% at a pH ranged from 8 to 8.3. Increasing the concentration of dye up to 150 mg/l leads to decrement of the decolorization percentage to 36.5%. Chen [10] reported that using conventional AS was not efficient for decolorization of dyes at high concentrations. On the other hand, it was noticed that the TC-AS decolrization efficiency was almost the same at 100 mg MG/l and 150 mg/l reached a value greater than 98% at a pH ranged from 7.9 to 8.3. However, TC showed the highest dye decolorization efficiency with an average value exceeding 99% at 100 and 150 mg MG/l at an optimal pH ranged from 8.3 to 8.6. These results are in agreement with the data reported by Mahmoud et al. [28]. Shah [41] found that using the isolated pure strain either alone or mixed with AS increase the decolorization of MG in the presence of carbon source. The cell surface was improved to be negatively charged and leads to more ionic attraction leading to a high binding affinity of MG molecules [34]. It was reported that at alkaline medium (pH > 7) the uptake of MG increased due to the change in polarity [31]. In the present work, the obtained results as illustrated in Figs. 9, 10, 11 showed clearly that MG removal increased as pH of the solution increased and the best decolorization occurred at alkaline medium (pH > 7.9).
Effect of dye concentration on organic matter removal
Decolorization of MG is mainly affected by dye concentration [15]. Figures 9, 10, 11 show the variation of COD concentration with time (days) at different dye concentrations. Effect of different concentrations of MG were examined starting from 50 mg/l, then increased to 100 mg/l and finally 150 mg/l on the degradation rate of MG in simulated wastewater using different bioreactors. It was obvious that at the lowest MG concentration (50 mg/l), TC achieved the best removal efficiency for COD compared to AS and TC-AS in the order of TC > AS > TC-AS. While increasing the concentration up to 100 mg/l, the performance was in the order of TC > TC-AS > AS. Moreover, reaching to 150 mg/l, the removal efficiency for organic matter was in the order of TC > TC-AS > AS. It is worth to mention that AS was deteriorated and reached 75.43% removal efficiency.
At 50 mg/l of MG, the AS reached a removal rate of almost 89.31% with an average COD removal value of 105.3 mgO2/l. This can be attributed to the capability of AS under aerobic conditions to produce certain enzymes such as manganese peroxidase and laccase which degrade MG to CO2 and water resulted in an increase of MLSS [16]. In this study, it was observed that the removal rate of COD by AS dropped from 89.31 to 75% with increasing the concentration of MG from 50 to 150 mg/l. This may be due to high MG concentrations caused incorporable impact on MLSS resulting in a change of AS characteristics [30]. As well as, at high MG concentrations, the surface of AS (aerobic granules) became sutured with dye [24]. It also attributed to the adsorption of MG to the sludge granules and the oxygen uptake rate decrement of biosorption [29].
The results proved that incorporation of AS with the pure tested culture at a concentration of MG above 50 mg/l have a better removal rates for organic matter than the AS due to the synergetic interaction between different microorganisms [12, 22]. The average percentage removal for COD increased up to 92.95%. Furthermore, raising up the concentration to 150 mg/l did not significantly affect the performance of organic matter removal (92.41%). Song et al. [42] studied the use of pseudomonas veroni Jw-3–6 for the degradation of 50 mg/l of MG within a period of 6 days and reached 93.5%. The results of this study were much better than those obtained by Nath et al. [34] who obtained a removal value of 79% for COD and dye removal of 96% using AS at 50 mg/l at a hydraulic retention time of 72 h. The efficiency of TC at 50 mg/l was 90.53% and at 100 mg/l reached 94.47%. Finally the results of increasing the dye concentration to 150 mg/l indicated that the tested strain bioreactor was capable of biodegradation of MG efficiently. The residual COD reached 24 mgO2/l with an average COD removal rate of 95.95%. It was clear that the tested culture could survive at high dye concentrations and achieve the best removal efficiency for organic matter.
Optimum time for MG biodegradation at different dye concentrations
The steady state conditions were reached for all the tested bioreactors after 26 days at 50 mg MG/l. Raising the concentration up to 100 mg/l the adaptation time decreased to 20 days and after more than 18 days it was completely steady for the degradation of 150 mg/l MG. After that the growth rate experiments revealed that the time needed for biodegradation of MG dye was different for each bioreactor at different dye concentration. For AS bioreactor, the time needed at 50 and 100 mg/l was almost 8 h while at 150 mg/l, it reached up to 12 h which is better than that achieved by Nath et al. [34]. The TC-AS bioreactor decreased the time needed for biodegradation in comparison with AS bioreactor at different concentrations of MG. Starting with 50 mg/l it takes 4 h and 8 h for both 100 and 150 mg/l, respectively. However, for the TC bioreactor it took only 4 h to reach complete degradation at all the examined dye concentrations. Table 2 shows the minimum and maximum COD removal values at different MG concentrations at the optimum time of biodegradation.
Biomass of different cultures
The results obtained for the biodegradation of MG using AS revealed that the MLSS and MLVSS decreased with increasing the dye concentration. The MLSS was 3.9, 3.21 and 3.54 g/l with corresponding MLVSS of 2.64, 2.5 and 2.4 g/l at 50, 100 and 150 mg/l of MG. However, the TC-AS bioreactor showed better removal efficiencies for COD, color, and dye concentration than the AS bioreactor. This may be due to the syntrophic interaction between the AS and Pseudomonas plecoglossicide MG2 [32]. The results for MLSS and MLVSS were 3.23, 3.14, 3.6 g/l and 2.51, 2.24, 2.0 g/l for 50, 100 and 150 mg/l, respectively. The MLSS and MLVSS achieved from using the tested culture alone increase with increasing the dye concentration. Increasing the MLSS is attributed to the growth rate of the tested culture; consequently, the increase of MLVSS indicates the growth of Pseudomonas plecoglossicide MG2 and this was confirmed by high removal rates of COD and other pollution parameters. The MLSS was 3.19, 4.64, 4.9 g/l with MLVSS of 2.37, 3.5 and 3.6 g/l, respectively for 50, 100 and 150 mg/l.
Oxidation reduction potential impact on biodegradation of MG
The efficiency of pollutant removal can be investigated by measuring the oxidation reduction potential (ORP) of aqueous solutions. ORP represents the redox status of wastewater. There is a linear relationship between COD and ORP. The result showed that as the COD removal efficiency increased as the ORP value increased. This was confirmed by the residual COD and ORP measurements. Moreover, this emphasizes that biodegradation occurs effectively under aerobic conditions [25]. At 50 mg MG /l, the average mean of ORP values of AS and TC-AS bioreactors were 353,352 and 324 mv, respectively. Increasing the concentration of MG up to 100 mg/l, the efficiency of AS bioreactor decreased. However, the behavior of TC bioreactor was the best at higher dye concentrations. The ORP increased from 325 to 432 and 553 at 50, 100 and 150 mg MG/l. In agreement with these results, Li and Bishop [26] indicated that the positive values of ORP emphasized the oxidation process under aerobic conditions and accordingly, increment of COD removal rates with retention time.
FTIR
FTIR spectroscopy is a widely used technique for investigation of dyes degradation. Figure 12 shows the FTIR spectra of MG and its products after biodegradation by Pseudomonas plecoglossicide MG2. The spectrum of the untreated MG displayed the main characteristic absorption bands at 3410, 2915, 1572, and 1154 cm−1, which are assigned for the vibrations of NH asymmetric stretching, C-H asymmetric stretching, C=C stretching of benzene rings, and the aromatic C-N stretching, respectively. In addition, the peaks at 1348 and 822 cm−1 are attributed to the vibrations of –CH3 asymmetric bending and C=C trisubstituted benzene rings, respectively.

FTIR spectra of MG before and after degradation by Pseudomonas plecoglossicide MG2
On the other hand, the spectrum of extracted MG products after biodegradation showed remarkable changes in the fingerprint region 1500–500 cm−1. In addition, the disappearance of the characteristic peak of benzene rings at 1572 cm−1 indicates to changes in the benzene rings as a result of the biodegradation process. The appearance of new peaks at 3776, 3664 cm−1 assigned for OH stretching vibrations due to formation of hydroxylated products [8]. Moreover, another new peak appeared at 1644 cm−1, which implies to the formation of C=O during one or more steps of the biodegradation process. The peak at 2916 cm−1 is attributed to the –CH stretching by asymmetric CH2 group referring to methylene-substituted products [8]. The peak at 1398 cm−1 is due to –NH or –CN stretching vibrations in amine III group [8]. A peak at 1239 cm−1 for C-N stretch with a sharp peak at 1061 cm−1 and a peak around 3260 cm−1 for N–H stretch represents the formation of primary and secondary amines. The peak at 886 cm−1 of the di-substituted benzene derivatives indicated aromatic nature of amines. Also, the peak at 1716 cm−1 that initially appeared in the spectrum of MG before degradation disappeared in the spectrum of degraded MG products. The FTIR analysis of MG degraded products confirms the structural and functional changes in MG during degradation. The FTIR analysis also referred to the formation of hydroxylated and demethylated substituted benzenes as a proposed pathway for MG biodegradation. Similar findings were previously reported for the microbial degradation of MG [5, 6, 8, 9, 12, 37, 38].
Degradation pathways of MG
LC–ESI–MS analysis of MG degradation products
The degradation products of MG were determined by LC–ESI–MS analysis and presented in Fig. 13. The results showed that the intermediates of MG degradation were desmalachite green (m/z 316, Rt 16.69 min), didesmalachite green (m/z 302, Rt 23.39 min), tetradesmalachite green (m/z 273, Rt 11.24 min), 4-(diphenylmethyl)aniline (m/z 259, Rt 11.24 min), malachite green carbinol (m/z 347, Rt 14.09 min), bis[4-(dimethylamino)phenyl]methanone (m/z 268, Rt 23.55 min), [4-(dimethylamino)phenyl][4-(methyl-amino)phenyl]methanone (m/z 254, Rt 22.39 min), bis[4-(methylamino)phenyl]methanone (m/z 240, Rt 12.47 min), (4-amino- phenyl)[4-(methylamino)phenyl]methanone (m/z 226, Rt 15.63 min), bis(4-amino phenyl)methanone (m/z 212, Rt 7.26 min), (4-amino phenyl)methanone (m/z 197, Rt 5.36 min), 4-(dimathylamino)benzaldehyde (m/z 149, Rt 6.69 min).
Mass spectra of MG intermediates degradation determined by LC–MS analysis (A) desmalachite green (m/z 316, Rt 16.69 min), (B) didesmalachite green (m/z 302, Rt 23.39 min), (C) tetradesmalachite green (m/z 273, Rt 11.24 min), 4-(diphenylmethyl)aniline (m/z 259, Rt 11.24 min), (D) malachite green carbinol (m/z 347, Rt 14.09 min), (E) bis[4-(dimethylamino)phenyl]methanone (m/z 268, Rt 23.55 min), (F) [4-(dimethylamino)phenyl][4-(methyl-amino)phenyl]methanone (m/z 254, Rt 22.39 min), (G) bis[4-(methylamino)phenyl]methanone (m/z 240, Rt 12.47 min), (H) (4-amino- phenyl)[4-(methylamino)phenyl]methanone (m/z 226, Rt 15.63 min), (I) bis(4-amino phenyl)methanone (m/z 212, Rt 7.26 min), (J) (4-amino phenyl)methanone (m/z 197, Rt 5.36 min), and (K) 4-(dimathylamino)benzaldehyde (m/z 149, Rt 6.69 min)
The biodegradation of malachite green by two proposed pathways is shown in Fig. 14. The degradation either directly through a step by step demethylation and hydroxylation process, or indirectly through an oxidative breakdown reaction and a step by step demethylation process. From previous studies, it was concluded that MG biodegradation is initiated by either demethylation process or firstly, reduction reaction and then demethylation process [3]. Similar pathways of triphenylmethane dye degradation by different bacteria were obtained by Ioth et al. [19] who mentioned that the products of crystal violet degradation by Bacillus subtilis IF0 13719 and N. coralline were diaminophenol and Michler’s ketone. Also, Wang et al. [47] concluded that degradation of MG by Exiguobacterium sp. MG2 produced leucomalachite by hydrogenation which is cleaved into 4-dimethylamino-phenyl–phenyl-methanon and subsequently, it is cleaved into 3-dimethylamino-phenol and benzaldehyde.
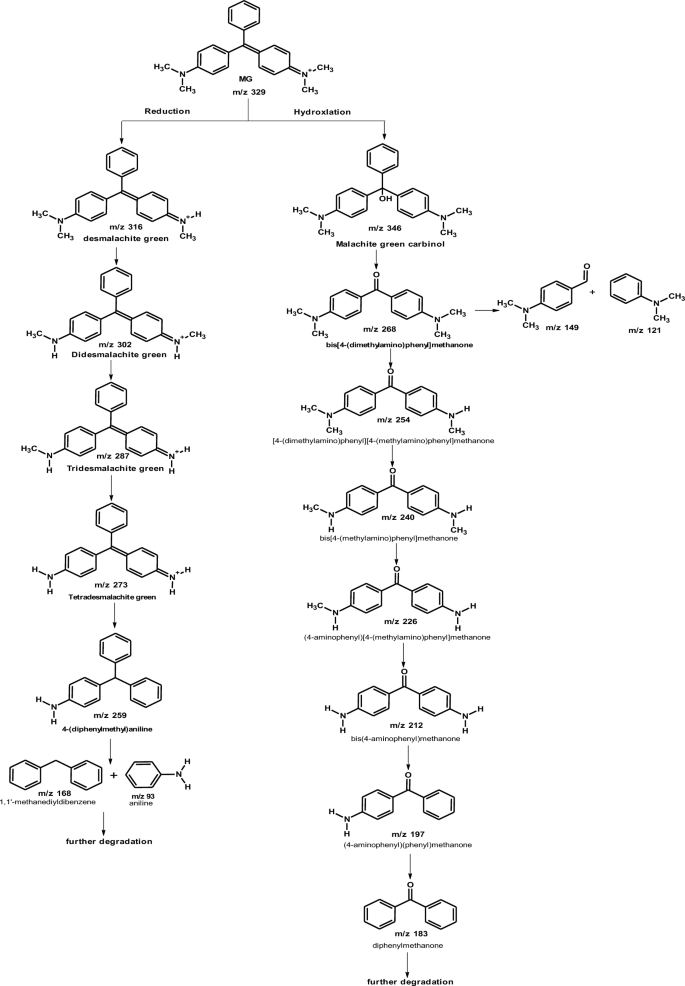
the proposed pathway of MG biodegradation by Pseudomonas plecoglossicida MG2
Abu-Hussien et al. [3] reported that GC–MS and HPLC of the degradation products of MG by Streptomyces exfoliates confirmed the presence of leucomalachite green, 1,3-benzenedicarboxylic acid, di-tertbutyl 2- phenylethoxy silane, bis-2- ethylhexyl ester, bis-2-ethylhexyl ester, 1,4-benzenedicarboxylic acid, 1,2-benzenedicarboxylic acid, di-n-octyl phthalate and dioctyl ester. Also, five degradation products could be identified by the degradation of MG by Pseudomonas veronii [42]. These intermediate byproducts were leucomalachite green, 4-dimethylamino-benzophenone, 4-dimethyl-aminophenol, hydroquinone and benzaldehyde. Tao et al. [43] found that the degradation of MG by Pseudomonas sp. YB2 was confirmed by GC–MS and the degradation intermediates were leucomalachite green, dimethylaniline, 4,4′-bis(dimethylamino) benzophenone, phenol, and 4-(dimethylamino) benzophenone. In another study, LC–MS analysis of biodegradation products of malachite green by Pseudomonas sp. strain DY1 confirmed the presence of malachite green carbinol, N,N-di-methylaniline, (dimethyl amino-phenyl)-phenyl-methanone, (amino phenyl)-phenyl methanone, (methyl amino-phenyl)-phenyl-methanone, and di-benzyl methane [13]. In the study of Chaturvedi and Verma [9], GC–MS analysis of the degradation products of MG by Ochrobactrum pseudogrignonense strain GGUPV1 showed the presence of 4-(dimethyl amino)pheny-phenyl, phenol-3,5,-demethoxy and phenol-3-(demethylamino).
Cytotoxicity of extracted degraded product
Cytotoxicity is one of the most important indicators for biological evaluation in vitro studies. It determines whether a product or a compound will have any toxic effect on living cells. The cytotoxic effect of MG before the treatment with Pseudomonas plecoglossicide MG2 on a normal human retina cell line showed a highly toxic effect on vero cells with LC50 of 28.9 µg/ml and LC90 at 79.7 µg/ml. On the other hand, the extracted products after degradation by Pseudomonas plecoglossicide MG2 showed no toxicity on vero cells at all tested concentrations. These data revealed the potential of Pseudomonas plecoglossicide MG2 as a MG biodegrader. In accordance with these results, Vilhena et al. [46] found that MG showed high cytotoxicity effect against tested cell lines (ACP02, L929, MNP01, and MRC-5). They also reported that higher MG concentrations exhibited cell necrosis while lower MG concentrations induced opoptosis. In the study of Abu-Hussien et al. [3], they found that MG degradation products (after degradation by Streptomyces exfoliates) exhibited no cytotoxicity on human skin fibroblast normal cells (HSF).
Add Comment